Competitor Benchmarking: The Practitioner's Guide With Actual Numbers
Most benchmarking efforts die in a spreadsheet nobody opens. A team spends two weeks pulling competitor data, builds a 40-slide deck, presents it once, and never updates it. The problem isn't the data - it's that nobody tied the benchmarking to a decision that actually needed making.
Here's the thing: pick 3 metrics tied to revenue, not 15 tied to vanity. Benchmark quarterly at minimum. Use the Assess-Benchmark-Strategize framework below, and you'll have something people actually reference in meetings instead of something that rots in a shared drive.
What Competitor Benchmarking Actually Means
Competitor benchmarking is the ongoing measurement of specific KPIs against your rivals. It's not competitive analysis - though people swap the terms constantly. Benchmarking is narrower and continuous: you track measurable metrics over time against defined peers. Competitive analysis is broader, covering strategy, positioning, and market forces on a periodic basis.
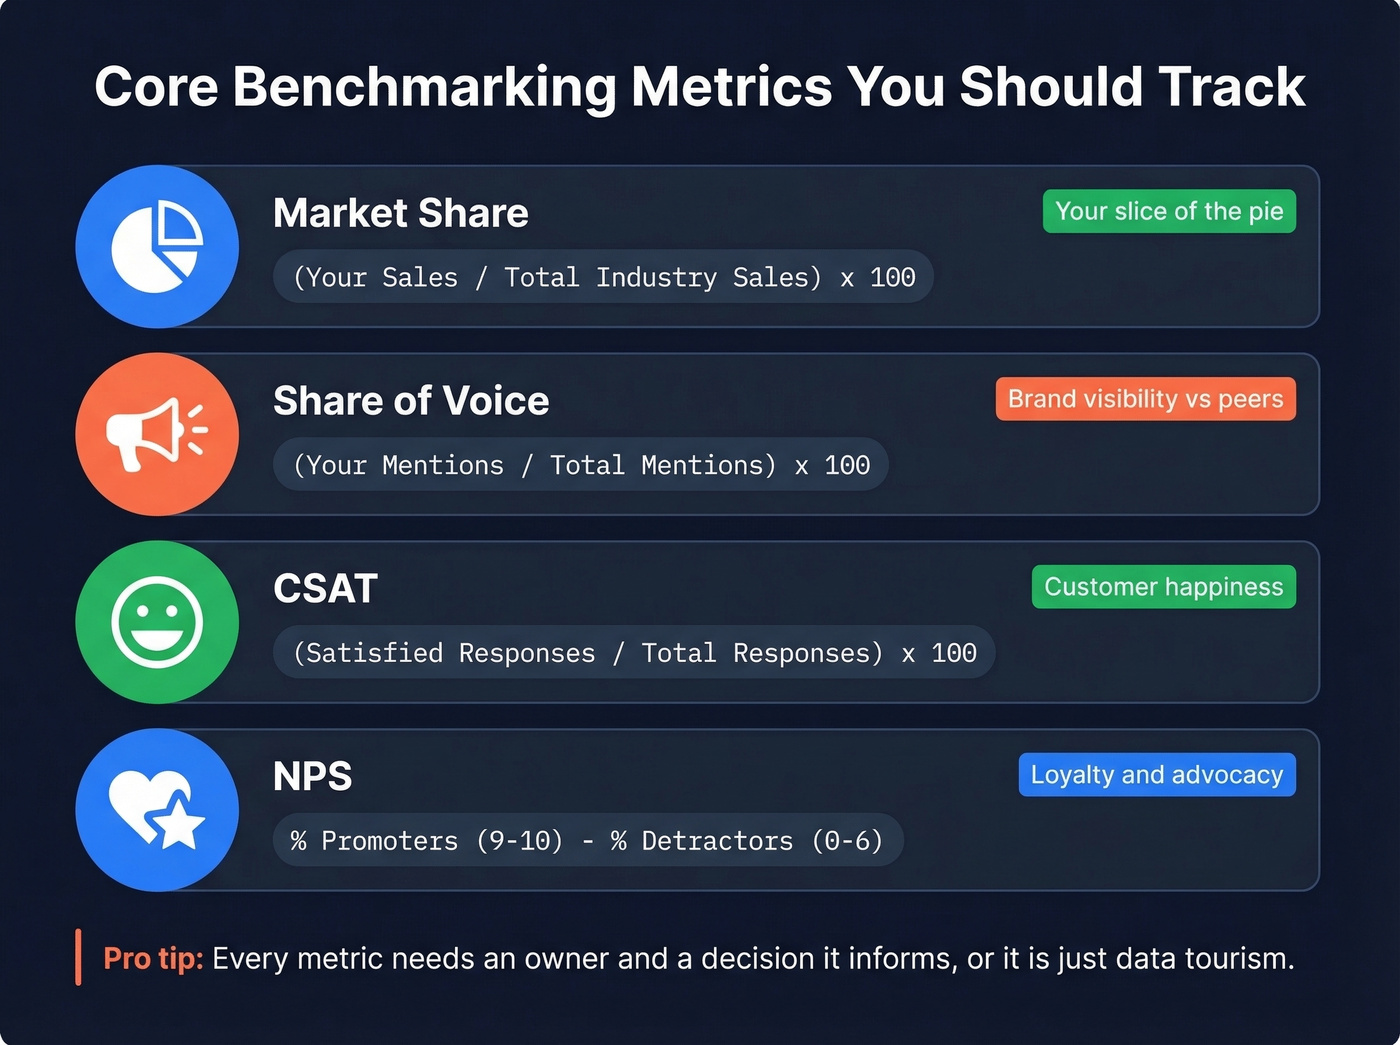
The distinction matters because benchmarking without a decision it informs is just data tourism. Every metric you track should answer a question someone in the business is actually asking.
The ROI That Gets Budget Approved
MetricNet analyzed 4,000+ benchmarking engagements and found a consistent pattern: a $25,000 investment generating $250,000/year in savings. That's IT service benchmarking specifically, but the principle scales across functions.
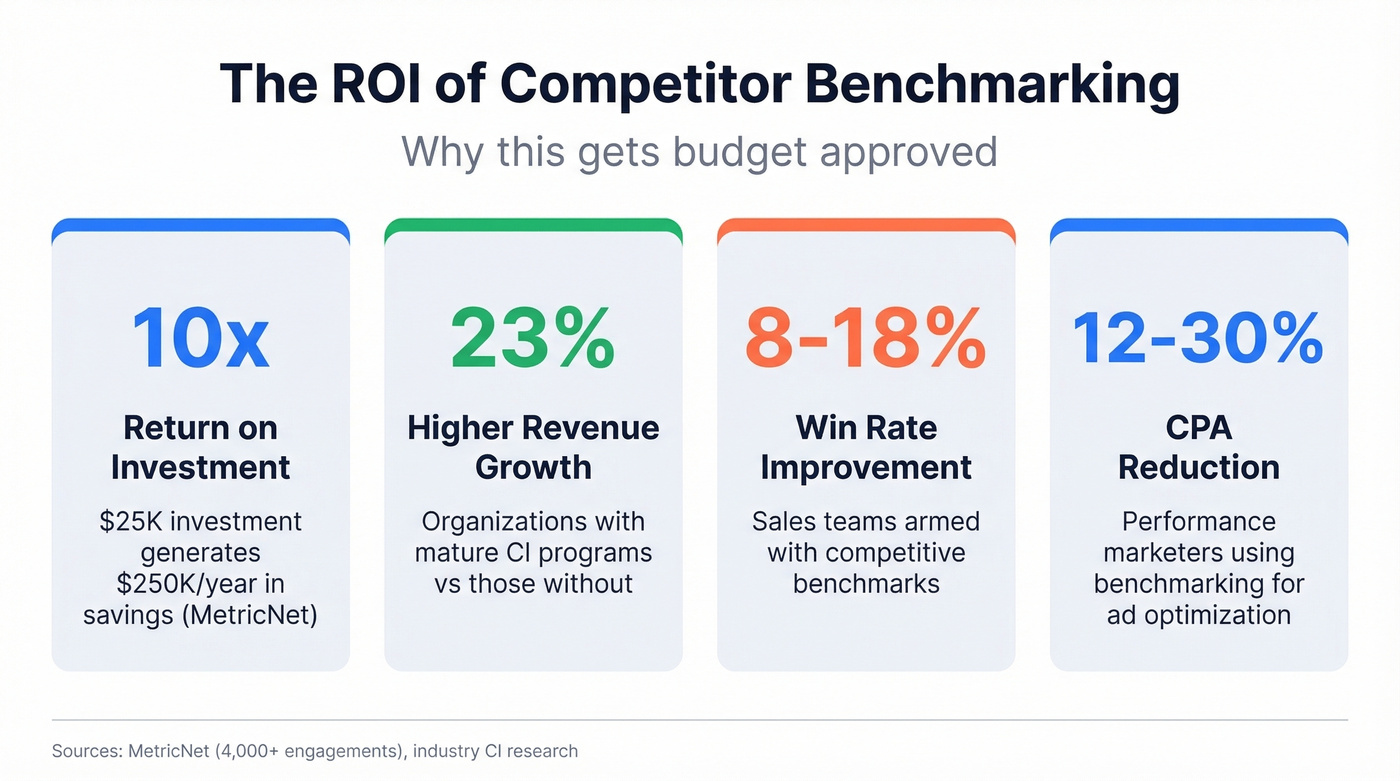
On the competitive intelligence side, organizations with mature CI programs see 23% higher revenue growth than those flying blind, and sales teams armed with competitive benchmarks report 8-18% win rate improvements. Performance marketers using benchmarking for ad optimization see 12-30% CPA reductions. Teams that measure against competitors make faster, better decisions. Teams that don't are guessing.
The 3-Phase Framework
We've run this framework across dozens of B2B benchmarking projects. It follows three phases - Assess, Benchmark, Strategize - and skipping any of them is how projects stall out.
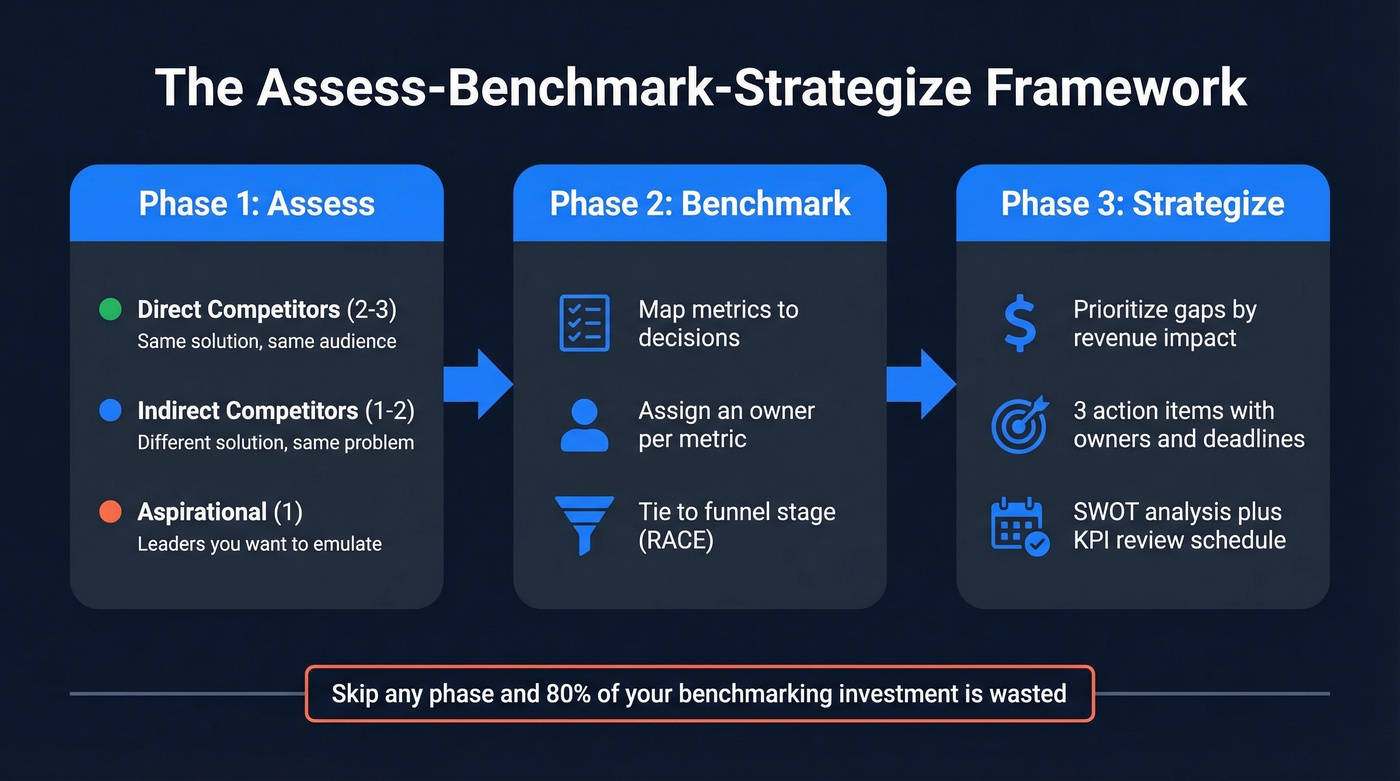
Phase 1: Assess
Not every competitor deserves the same scrutiny.
| Tier | Definition | Key Metrics |
|---|---|---|
| Direct | Same solution, same audience | Market share, win rate, G2 ratings |
| Indirect | Different solution, same problem | Community size, adoption trends |
| Aspirational | Leaders you want to emulate | Revenue growth, platform strategy |
Pick 2-3 direct competitors, 1-2 indirect, and 1 aspirational. More than that and you'll drown in data without acting on any of it.
Phase 2: Benchmark
Map each competitor to the metrics that matter for your business - not every metric available, just the ones tied to decisions. SEO benchmarks include rankings, backlinks, and domain authority. Paid benchmarks focus on impression share and CPC. Social benchmarks cover engagement rate and follower growth.
A common frustration we see in practitioner communities and on r/sales is benchmarking that stops at lag metrics and never triggers action. Every benchmark needs an owner and a decision it informs. "Track competitor pricing" isn't a benchmark. "Review competitor pricing quarterly to inform our Q2 pricing committee" is.
If you're using a framework like RACE (Reach, Act, Convert, Engage), map each benchmark to the funnel stage it measures. This keeps your analysis tied to outcomes rather than floating in a vacuum.
Phase 3: Strategize
For each metric where you trail a competitor, ask: is this gap worth closing, and what would it take? Prioritize by revenue impact, not by how far behind you are. A 2% gap in win rate matters more than a 50% gap in Instagram followers if you sell enterprise software.
Most teams over-benchmark and under-act. If your benchmarking report doesn't end with three specific action items that have owners and deadlines, you've produced a research paper, not a strategy document. In our experience, teams that skip this phase waste 80% of their benchmarking investment.
Metrics and Formulas Worth Tracking
| Metric | Formula | What It Tells You |
|---|---|---|
| Market Share | (Your sales / Total industry sales) x 100 | Your slice of the pie |
| Share of Voice | (Your mentions / Total mentions) x 100 | Brand visibility vs. peers |
| CSAT | Satisfied responses / Total responses x 100 | Customer happiness |
| NPS | % Promoters (9-10) - % Detractors (0-6) | Loyalty and advocacy |
Beyond these, track channel-specific KPIs. MetricNet's cost-per-ticket benchmarks are worth knowing: $22 for service desk resolution vs. $69 for desktop support. Because escalation costs are additive, a ticket that goes service desk to desktop support averages $91. Resolving at the service desk instead saves $69 per ticket on average - real money at scale when you're handling thousands of tickets monthly.
Your competitor benchmarking is only as good as the data behind it. Prospeo gives you 30+ filters - including technographics, headcount growth, funding, and buyer intent across 15,000 topics - so you can benchmark competitors on the signals that actually drive revenue, not vanity metrics.
Benchmark smarter with data refreshed every 7 days, not 6 weeks.
Real Benchmarks by Industry
Formulas are useless without context. CareerPlug's dataset covering 60,000+ small businesses and 10M+ applications shows the cross-industry average is 180 applicants per hire. But automotive companies need 234 applicants while education needs just 57. If you're benchmarking against unsegmented "industry averages," you're comparing completely different businesses.
In IT, knowledge workers lose 33 hours/year to IT issues on average. Top-quartile support orgs cut that to 17 hours; bottom quartile bleeds 47. That 30-hour gap per employee per year is real money at scale.

For B2B SaaS, Baker Tilly's 2025 benchmark report surveyed 500+ companies across 20+ KPIs including CAC payback period, LTV:CAC, and net revenue retention - customizable by company size, ACV, and GTM motion. It's one of the most useful SaaS benchmarking datasets available right now.
Best Tools for the Job
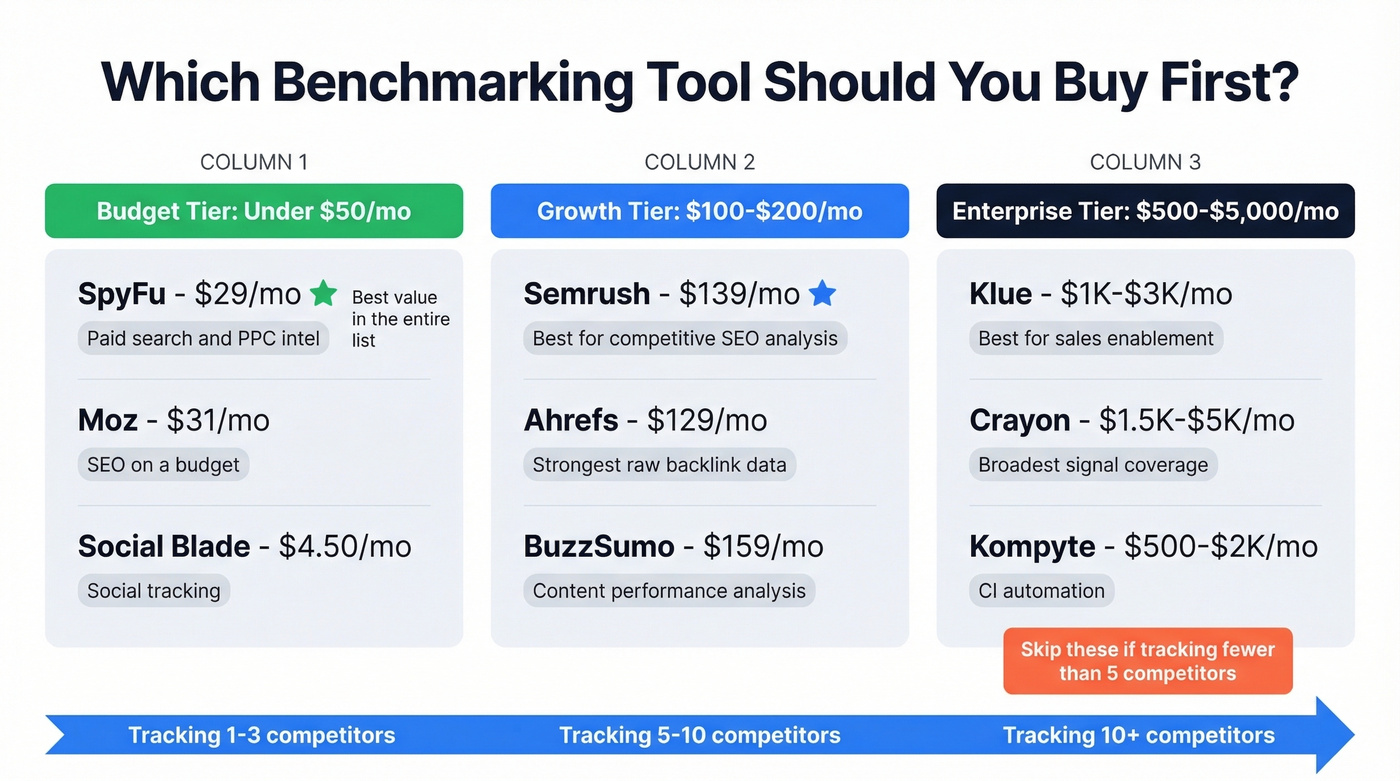
You don't need ten tools. Here's what actually matters, organized by what we'd buy first.
| Tool | Best For | Starting Price | Free Tier? |
|---|---|---|---|
| Semrush | SEO + visibility | ~$139/mo | Limited |
| Ahrefs | Backlinks + SEO | $129/mo | No |
| SpyFu | Paid/PPC intel | $29/mo | Limited |
| Moz | SEO on a budget | $31/mo | Limited |
| BuzzSumo | Content analysis | $159/mo | No |
| Social Blade | Social tracking | $4.50/mo | Yes |
| SimilarWeb | Web analytics | Not public | Limited |
| Klue | CI platform | ~$1K-$3K/mo | No |
| Kompyte | CI platform | ~$500-$2K/mo | No |
| Crayon | CI platform | ~$1.5K-$5K/mo | No |
SpyFu at $29/mo is the best value in this entire list. For that price you get competitor ad spend history, keyword bids, and historical campaigns going back many years. Nothing else comes close on a per-dollar basis for paid search intelligence.
For SEO benchmarking, Semrush edges out Ahrefs on competitive analysis features, though Ahrefs wins on raw backlink data. If you can only pick one, go Semrush.
For CI platforms, Klue, Kompyte, and Crayon automate monitoring with real-time alerts and battlecard generation. They're expensive, but for enterprise teams tracking 10+ competitors, the time savings justify the spend. Klue is the strongest for sales enablement; Crayon covers the broadest signal set. Skip these if you're tracking fewer than five competitors - the ROI doesn't justify the cost at that scale.

One area most teams overlook is benchmarking their own data quality against competitors' outbound performance. If your bounce rate sits at 15% while a competitor's sequences land clean, you're losing before the conversation starts. Prospeo's free tier gives you 75 verified emails monthly - enough to run a head-to-head accuracy test against your current provider and see where you actually stand. If you're comparing vendors, start with a shortlist from the best B2B databases and validate results with an email verifier.
AI-Powered Benchmarking in 2026
AI is compressing the benchmarking cycle dramatically. Evidence synthesis that took a week now takes hours, with AI cutting analysis time by 50%+ and reducing manual labor by 75%+. Roughly 75% of companies now use AI-powered competitor analysis, and those companies are 2.5x more likely to outperform peers.
The emerging metric to watch is "answer share" - how often your brand appears in AI-generated responses from ChatGPT, Perplexity, and Google AI Overviews. No SERP competitor is tracking this well yet, and it's going to matter more than share of voice within two years.
One caveat worth taking seriously: LLM accuracy on complex competitive analysis tasks runs 85-90%. That 10-15% error rate means AI is a first draft, not a final answer. I've seen teams publish AI-generated competitive battlecards with outdated pricing that cost them deals. Use AI to accelerate, then verify everything before it hits a sales deck.
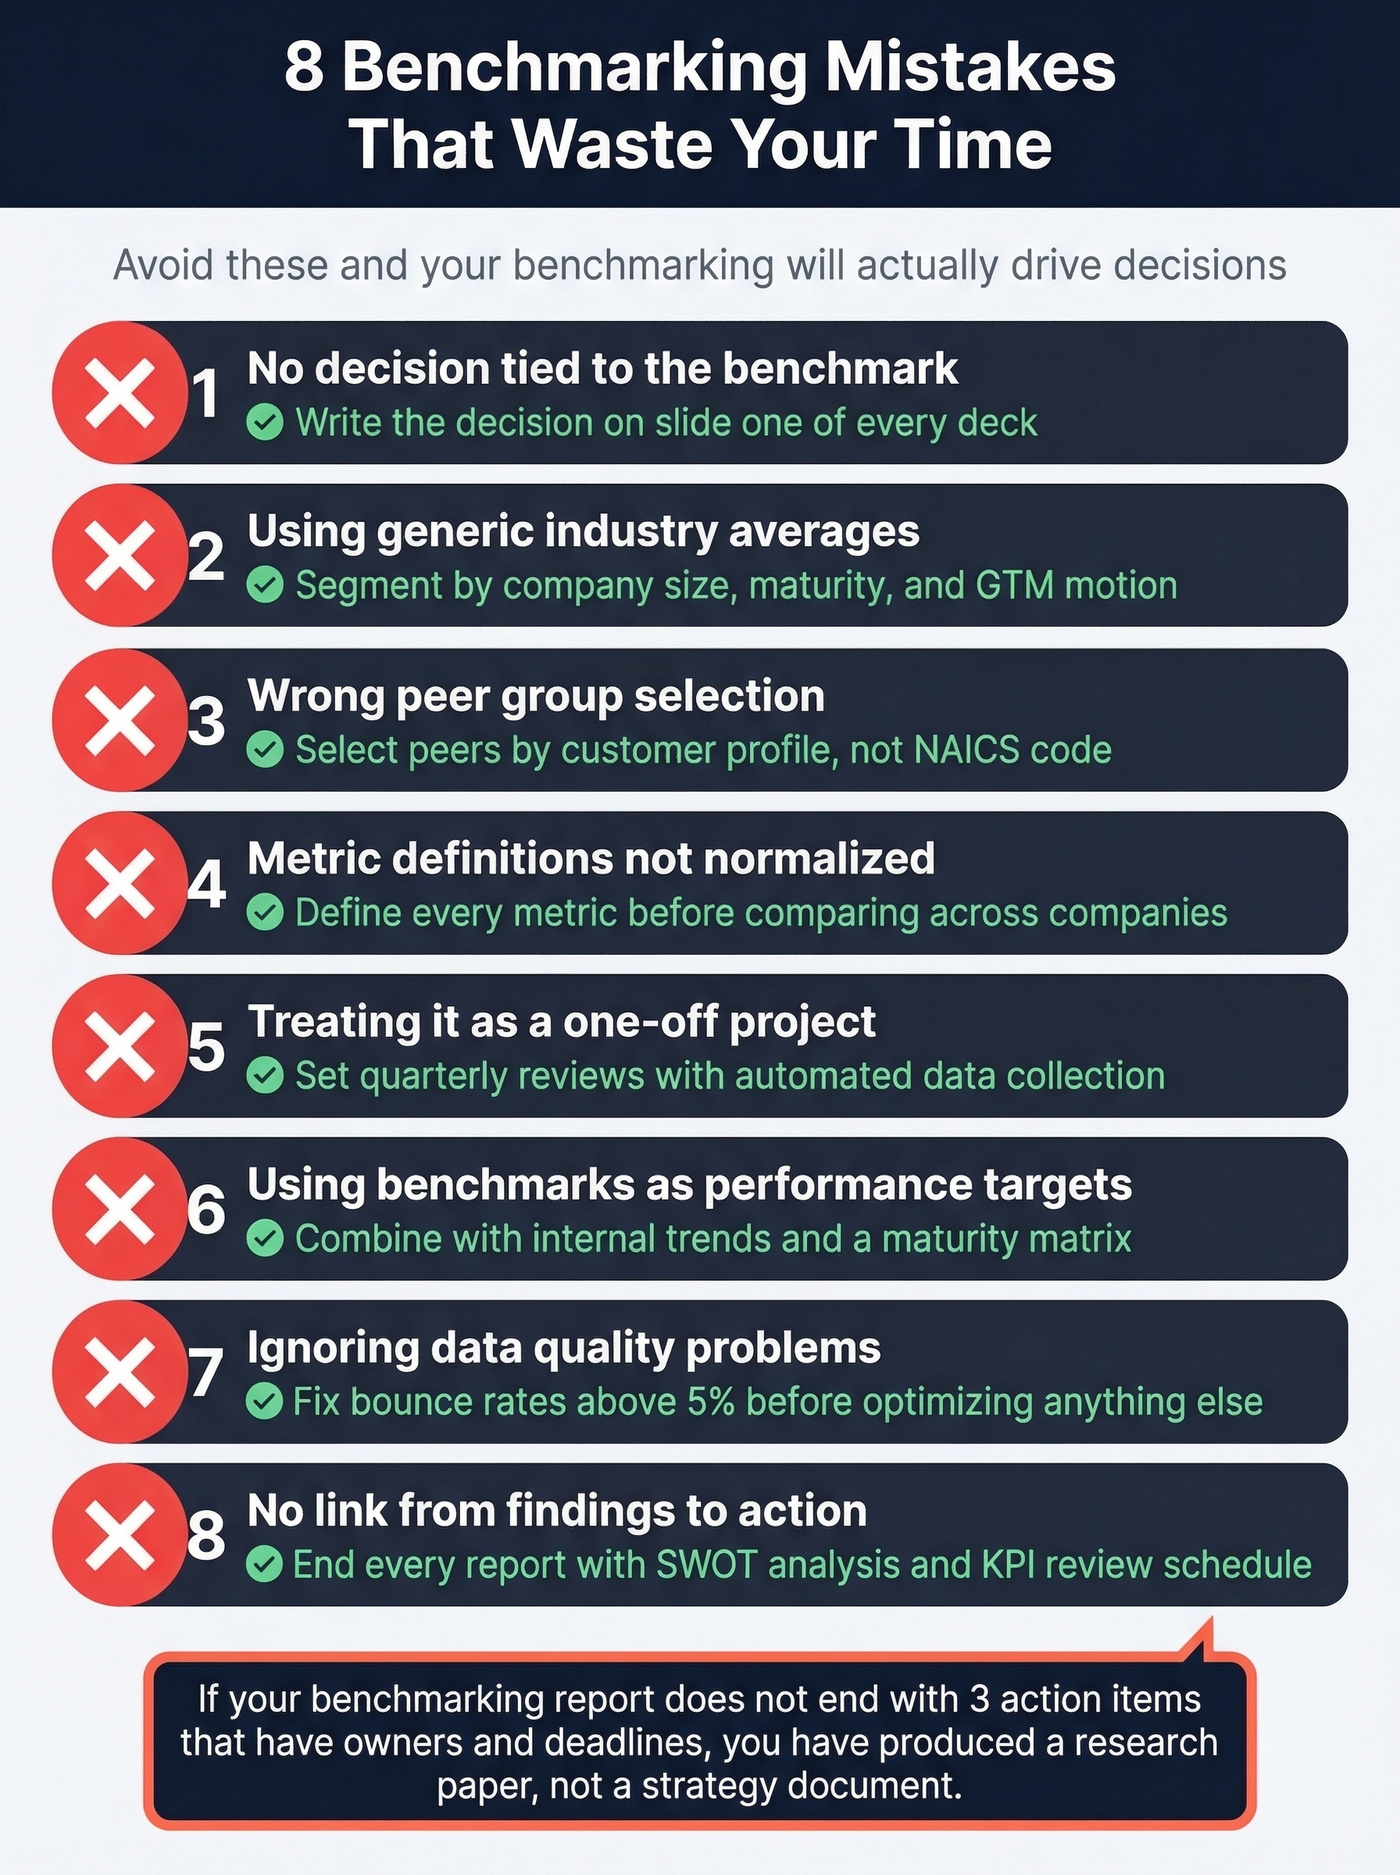
8 Mistakes That Waste Your Time
- Benchmarking without a decision it'll inform. Write the decision on the first slide of every benchmarking deck.
- Using off-the-shelf industry averages without context. Segment by company size, maturity, and GTM motion.
- Wrong peer group. Same NAICS code doesn't mean same buyers. Select peers by ideal customer profile, not industry classification.
- Not normalizing metric definitions. One company's "MQL" is another's "hand-raiser." Define every metric before comparing.
- Treating it as a one-off. Set a quarterly review cadence with automated data collection where possible.
- Using benchmarks as performance targets. Benchmarks show where the market sits, not where you should aim. Combine with internal historical trends and a maturity matrix.
- Ignoring data quality. If your outbound bounce rate exceeds 5%, your sequences are benchmarking against a handicap. Fix the root cause before you optimize anything else. (If you need a quick diagnostic, start with check bounce and then run an email reputation check.)
- Not linking findings to action. Every benchmarking report should end with a SWOT analysis and a KPI review schedule. If it doesn't, it's a document, not a tool.
Building Your Report
The best benchmarking reports aren't the longest - they're the ones that lead to a meeting where someone says "okay, here's what we're changing." Let's break down the structure that works:
Executive summary - one page with key findings, biggest gaps, and your top 3 recommendations. If a VP can't read this page and know what to do, rewrite it.
Competitor profiles - one page each covering positioning, strengths, and recent moves. Don't pad these. A tight half-page per competitor beats a bloated two-pager nobody reads.
KPI comparison table with trend arrows showing direction over time. This is the page people actually screenshot and share in Slack, so make it clean. Follow it with a gap analysis using severity ratings: critical, moderate, or minor. Then close with an action plan listing specific initiatives, owners, deadlines, and the next review date. If you want a repeatable format for sales teams, build lightweight sales battle cards and align owners to account executive KPIs.
Venngage offers 18 competitor analysis templates that handle formatting so you can focus on insights rather than slide design.
Teams using bad data for competitive intelligence waste 80% of their benchmarking investment. Prospeo's 98% email accuracy and 92% API match rate mean your outreach to competitor accounts actually lands - turning benchmarking insights into pipeline.
Turn competitor gaps into booked meetings at $0.01 per verified lead.
FAQ
How often should you benchmark competitors?
Quarterly for strategic metrics like market share and pricing. Monthly for digital metrics like SEO rankings and ad spend. For fast-moving markets where pricing or positioning shifts weekly, use CI tools with real-time alerts.
What's the difference between benchmarking and competitive analysis?
Benchmarking measures specific KPIs against competitors on a continuous cadence. Competitive analysis is broader and periodic, covering strategy, positioning, and market forces. Think of benchmarking as the quantitative subset of a full competitive analysis program.
Can you benchmark competitors on a small budget?
Absolutely - under $75/month gets you started. SpyFu at $29/mo covers paid search intelligence, Google Search Console is free for your own SEO data, and free tiers from tools like Prospeo and Social Blade fill in the gaps for data quality and social tracking.
What's the biggest competitor benchmarking mistake?
Tracking too many metrics without tying them to decisions. Pick 3-5 KPIs that directly influence revenue - win rate, CPA, share of voice - and assign each an owner. If nobody acts on a metric, stop tracking it.