CRM Forecasting: Formulas, Benchmarks & Methods (2026)
Your VP of Sales just asked why the team is going to miss the quarter by 20%. Two weeks ago, the CRM dashboard showed green across the board. That gap between what the CRM predicts and what actually closes is the entire problem with CRM forecasting - and 79% of sales organizations live with it, missing their forecast by more than 10%.
Can you actually trust CRM-driven forecasts? Yes. But not with better dashboards. The fix is better data, better formulas, and an honest measurement loop that most teams skip entirely.
What Is CRM Forecasting?
CRM forecasting uses structured pipeline data - deal stages, close dates, deal values, and historical win rates - to predict future revenue. Unlike a spreadsheet someone built on a Friday afternoon, a CRM forecast is a living model that updates as deals move through your pipeline. When it works, leadership gets real-time revenue visibility. When it doesn't, they get false confidence, which is worse than no forecast at all.
The numbers are sobering. Median B2B forecast accuracy sits at 70-79%, and only 7% of organizations consistently hit 90%+, per Gartner. Most sales teams operate with a forecast that's off by a fifth or more. The question isn't whether your forecast is wrong - it's how wrong, and whether you're measuring the gap.
Forecasting Methods Compared
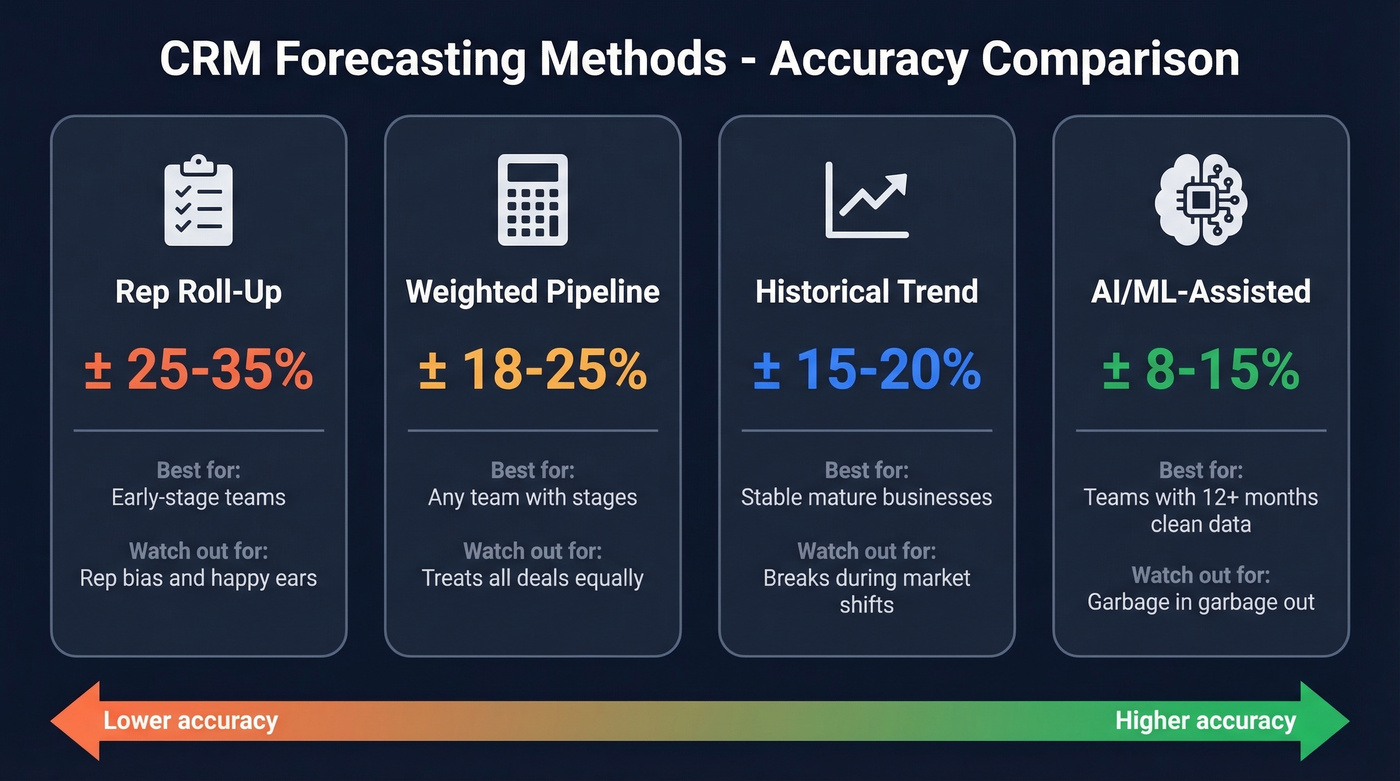
| Method | Typical Variance | Best For | Biggest Weakness |
|---|---|---|---|
| Rep roll-up | ±25-35% | Early-stage teams | Rep bias: sandbagging and happy ears |
| Weighted pipeline | ±18-25% | Any team with defined stages | Treats all deals in a stage equally |
| Historical trend | ±15-20% | Stable, mature businesses | Breaks during market shifts |
| AI/ML-assisted | ±8-15% | Teams with 12+ months of clean data | Garbage in, garbage out |
Rep Roll-Up: The Gut-Feel Default
Each rep submits their number, the manager adjusts it down, and the VP adjusts it again. The result is a forecast shaped more by personality and politics than data. At ±25-35% variance, this isn't a forecast - it's a range so wide it's barely useful for resource planning. If you're still here, move to weighted pipeline immediately.
Weighted Pipeline
This is the minimum viable forecasting method. The formula:
Weighted Value = Deal Value x Stage Probability
| Deal | Value | Stage Probability | Weighted Value |
|---|---|---|---|
| Acme Corp | $50,000 | 60% | $30,000 |
| Beta Inc | $40,000 | 30% | $12,000 |
| Gamma LLC | $30,000 | 25% | $7,500 |
| Total | $120,000 | $49,500 |
The unweighted pipeline says $120,000. The weighted forecast says $49,500. That $70,500 gap is why this method exists - the weighted number is almost always closer to reality. The limitation: it assumes every deal at a given stage has the same close probability, which is obviously wrong. A $50k deal with an engaged champion at 60% isn't the same as a $50k deal where the prospect ghosted after the demo.
Historical Trend Analysis
Picture a mature SaaS company with three years of consistent 8% quarter-over-quarter growth and predictable seasonal dips in Q1. For that team, historical trend forecasting works beautifully - variance drops to ±15-20%. But the moment you enter a new segment, launch a new product, or face a macro downturn, historical patterns become liabilities. This method rewards stability and punishes change.
AI/ML-Assisted Forecasting
Skip this if you have less than 12 months of clean CRM data or your stage definitions aren't standardized. AI forecasting reduces errors 20-50% versus traditional methods, bringing variance down to ±8-15%. But ML models are pattern-recognition engines. Feed them inconsistent stage definitions and deals that should've been closed-lost months ago, and they'll find patterns in noise.
The Formulas You Actually Need
Two formulas cover 90% of what a RevOps team needs for accurate sales forecasting solutions with CRM data. Everything else is refinement.
We covered weighted pipeline above. The key discipline is calibrating your stage probabilities against actual historical win rates, not aspirational ones. If your "Proposal Sent" stage historically converts at 40%, don't assign it 60% because it feels close.
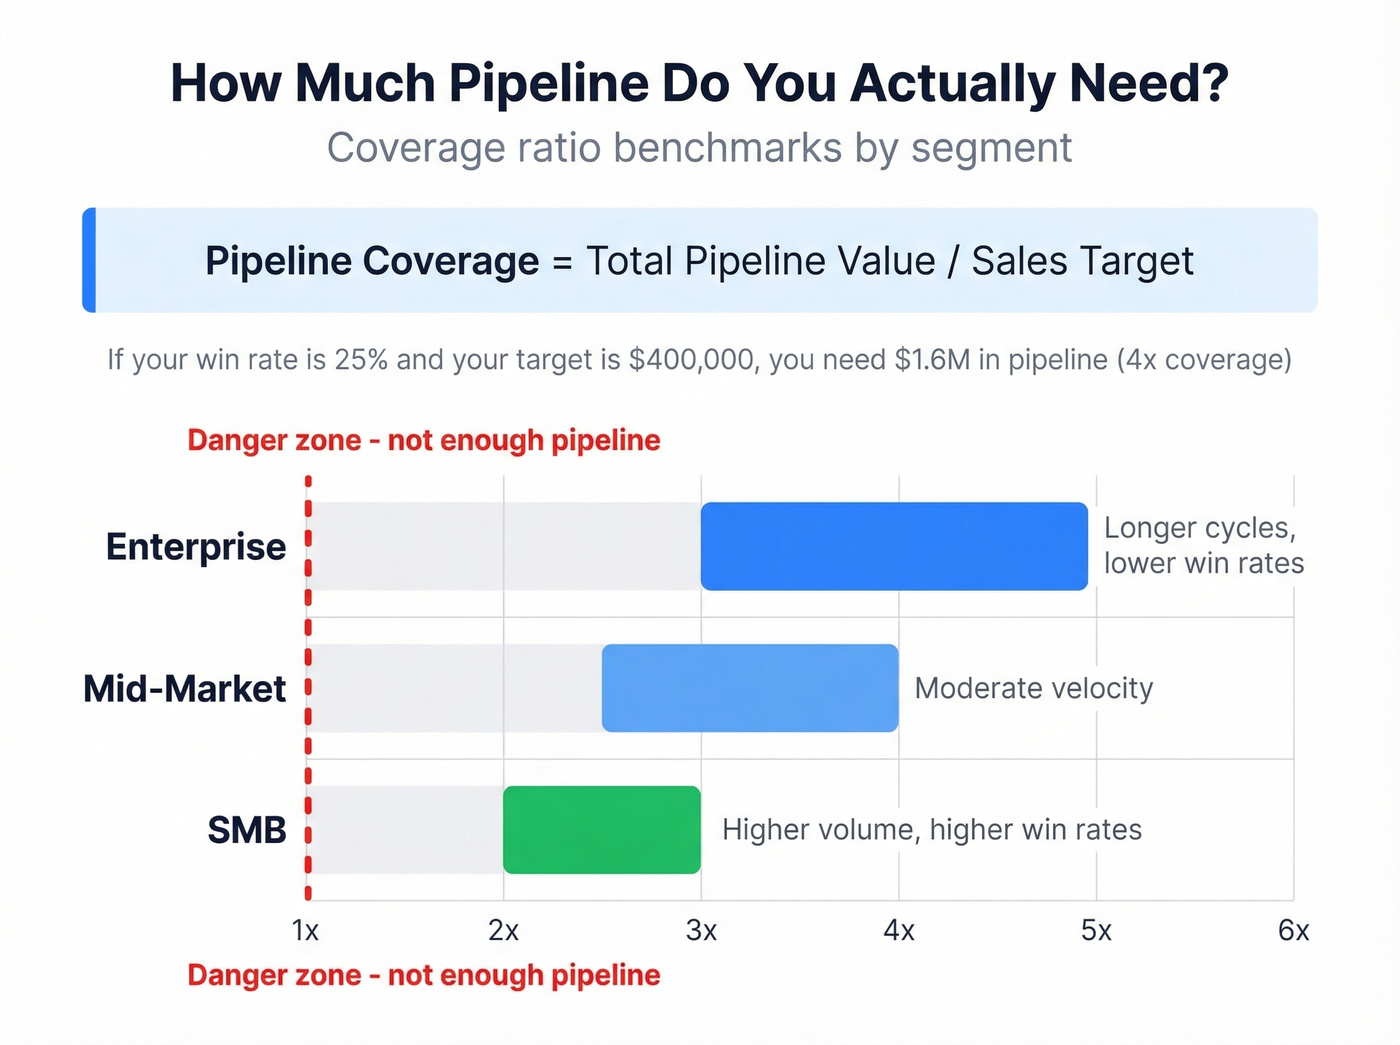
Pipeline Coverage Ratio:
| Segment | Coverage Needed | Why |
|---|---|---|
| Enterprise | 3-5x | Longer cycles, lower win rates |
| Mid-market | 2.5-4x | Moderate velocity |
| SMB | 2-3x | Higher volume, higher win rates |
Win rate drives coverage directly. If your win rate is 25% and your target is $400,000, you need $1.6M in pipeline - that's 4x coverage. If your win rate is 40%, you only need 2.5x. Teams that don't calculate this number are flying blind on whether they have enough pipeline to begin with, regardless of forecast methodology.
Why CRM Forecasts Fail
This isn't a methodology problem. It's systemic. In our experience, the single biggest predictor of forecast accuracy is CRM data hygiene, not methodology sophistication. Here are the seven root causes we see repeatedly.
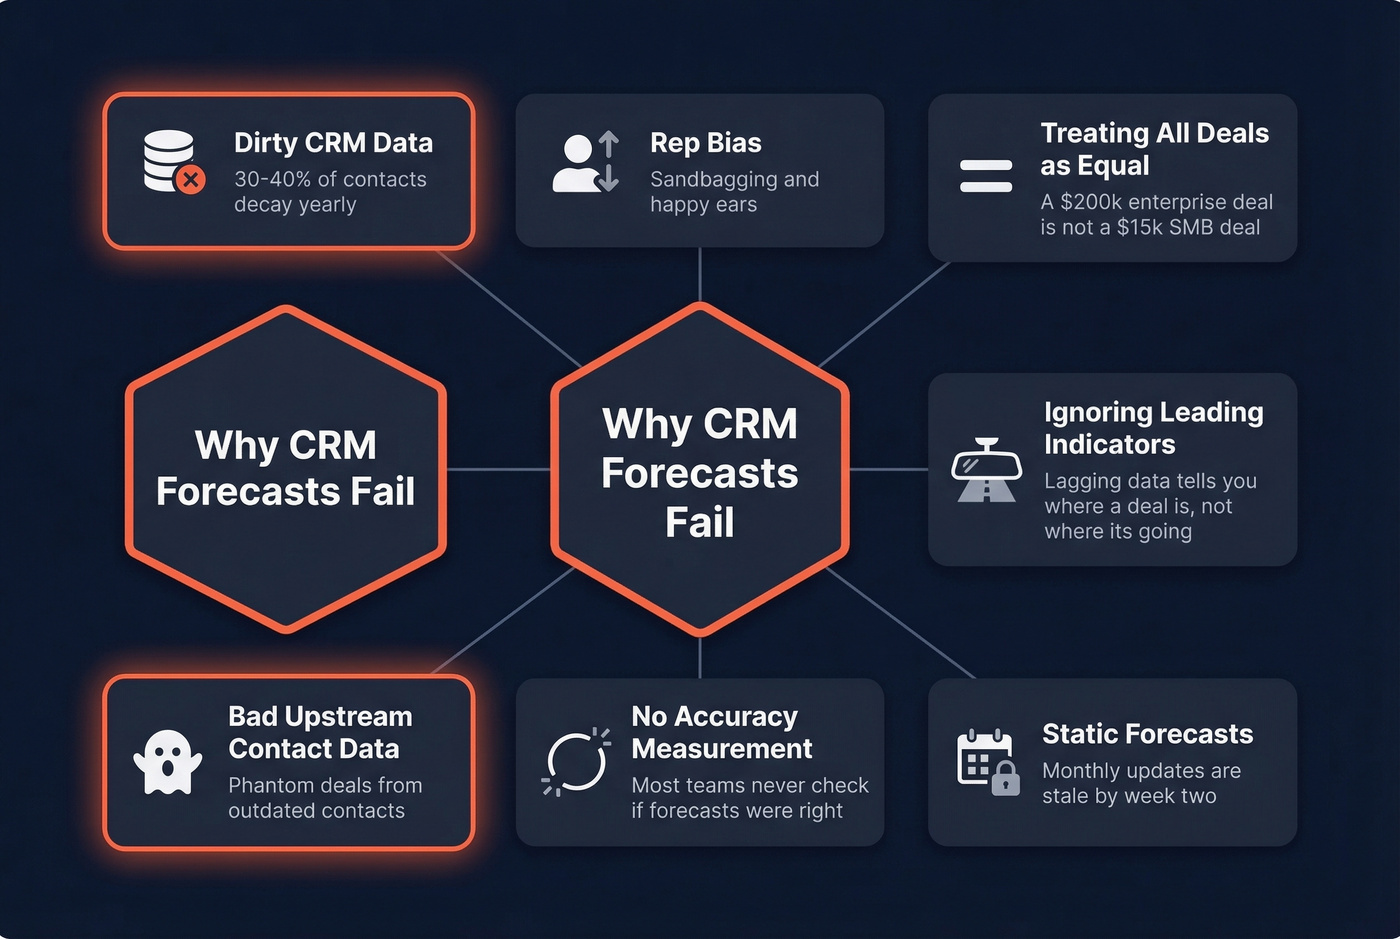
Dirty CRM data. Duplicate contacts, outdated job titles, wrong company associations. A forecast built on dirty data isn't a forecast - it's fiction with a formula attached. (If you're rebuilding your stack, start with contact management software basics.)
Rep bias. Some reps lowball to look like heroes when they overperform. Others inflate because they genuinely believe every prospect who said "looks interesting" is about to sign. Both distortions compound at the team level.
Treating all deals in a stage as equal. A $200k enterprise deal at "Negotiation" with legal redlines pending is fundamentally different from a $15k SMB deal where the buyer just needs to click DocuSign. Weighted pipeline doesn't distinguish between them, and that's a problem.
Ignoring leading indicators. One practitioner on r/salestechniques reported dropping their margin of error from 15% to 5% after layering conversation scoring into their forecast model. Lagging indicators tell you where a deal is. Leading indicators - engagement velocity, stakeholder sentiment, meeting frequency - tell you where it's going. (This is where pipeline health metrics help.)
Static forecasts. A forecast that updates monthly is stale by week two. Rolling forecasts updated weekly outperform quarterly snapshots because they catch pipeline changes before they compound into surprises.
No accuracy measurement loop. The question on r/SalesOperations - "Do any of you actually track how accurate your forecasts are?" - tells you everything. Most teams forecast religiously and never measure whether their forecasts were right.
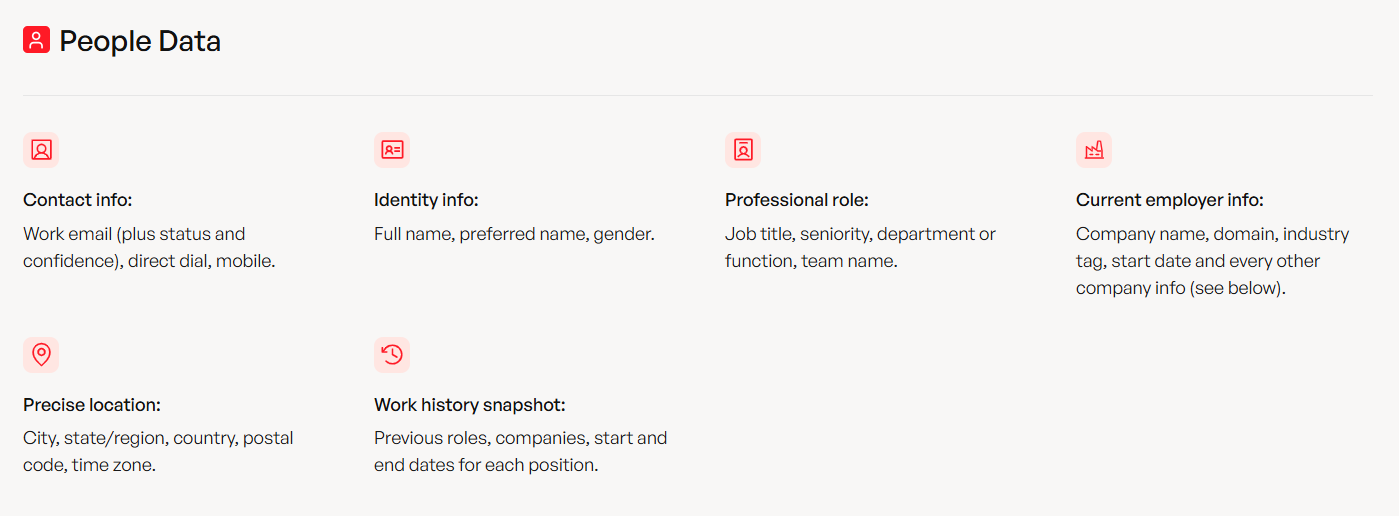
Bad upstream contact data. Here's the root cause nobody talks about. Contact data decays an estimated 30-40% per year. If a third of your contacts have outdated emails or wrong phone numbers, those pipeline deals are phantoms inflating your forecast. The prospect changed jobs six months ago, but the deal still sits at "Proposal Sent" because nobody verified the contact is still reachable. Prospeo's native Salesforce and HubSpot integrations address this at the source - 300M+ professional profiles refreshed on a 7-day cycle, 98% email accuracy, and 50+ data points returned per enriched record. When your CRM reflects reality, your forecast does too. (If you want options, compare data enrichment services.)
Dirty CRM data is the #1 reason forecasts fail. Contact data decays 30-40% per year - inflating your pipeline with phantom deals. Prospeo's 7-day data refresh cycle and 98% email accuracy keep your CRM clean so your weighted pipeline actually reflects reality.
Stop forecasting on ghost contacts. Start with verified data.
How to Measure Forecast Accuracy
The r/salesforce thread asking "how much can you really trust CRM-driven sales forecasts?" gets at the core issue: most teams don't measure accuracy at all. Let's break this down.
Use WMAPE, not MAPE. Mean Absolute Percentage Error treats a 50% miss on a $10k deal the same as a 50% miss on a $500k deal. Weighted MAPE weights errors by deal size, which is what actually matters for revenue planning. Use WMAPE as your primary metric. (For a broader KPI set, see sales operations metrics.)
Track forecast bias. Accuracy tells you how far off you are. Bias tells you which direction. If your forecast consistently runs optimistic - predicting $500k and closing $400k - your stage probabilities need recalibration.
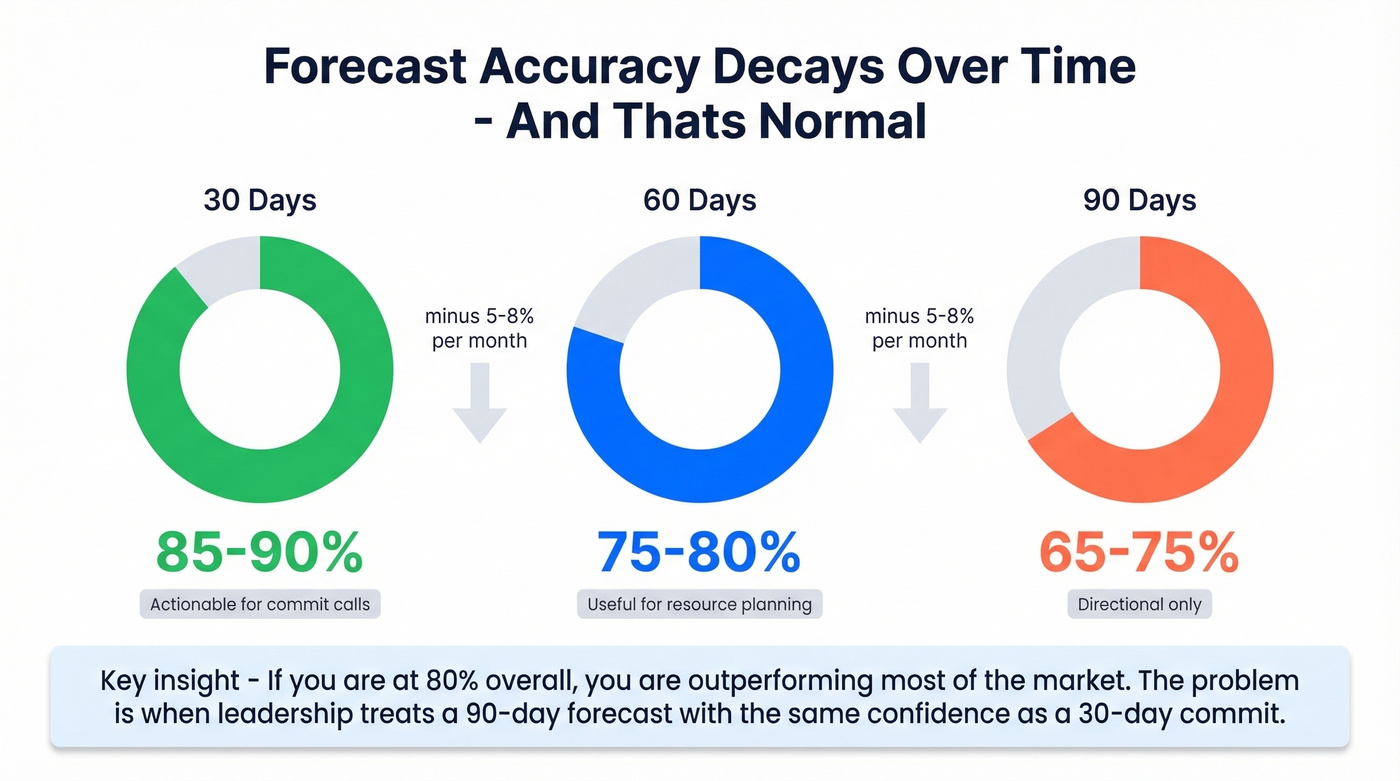
Understand horizon decay. Forecasts get less accurate the further out you look. This isn't a failure. It's physics.
| Forecast Horizon | Typical Accuracy | Notes |
|---|---|---|
| 30 days | 85-90% | Actionable for commit calls |
| 60 days | 75-80% | Useful for resource planning |
| 90 days | 65-75% | Directional only |
Accuracy decays roughly 5-8% per month. A 90-day forecast at 70% accuracy isn't broken - it's normal. The problem is when leadership treats it with the same confidence as a 30-day commit. If you're at 80% overall, you're outperforming most of the market.
How AI Changes Sales Forecasting
Every vendor in the space is pushing AI as the answer. And AI does help - ML-driven forecasting reduces errors 20-50% versus traditional methods. Modern models ingest engagement velocity, conversation sentiment from call recordings, email response patterns, and historical win/loss data. Salesforce claims their tools can flag deal risks 60 days before close.
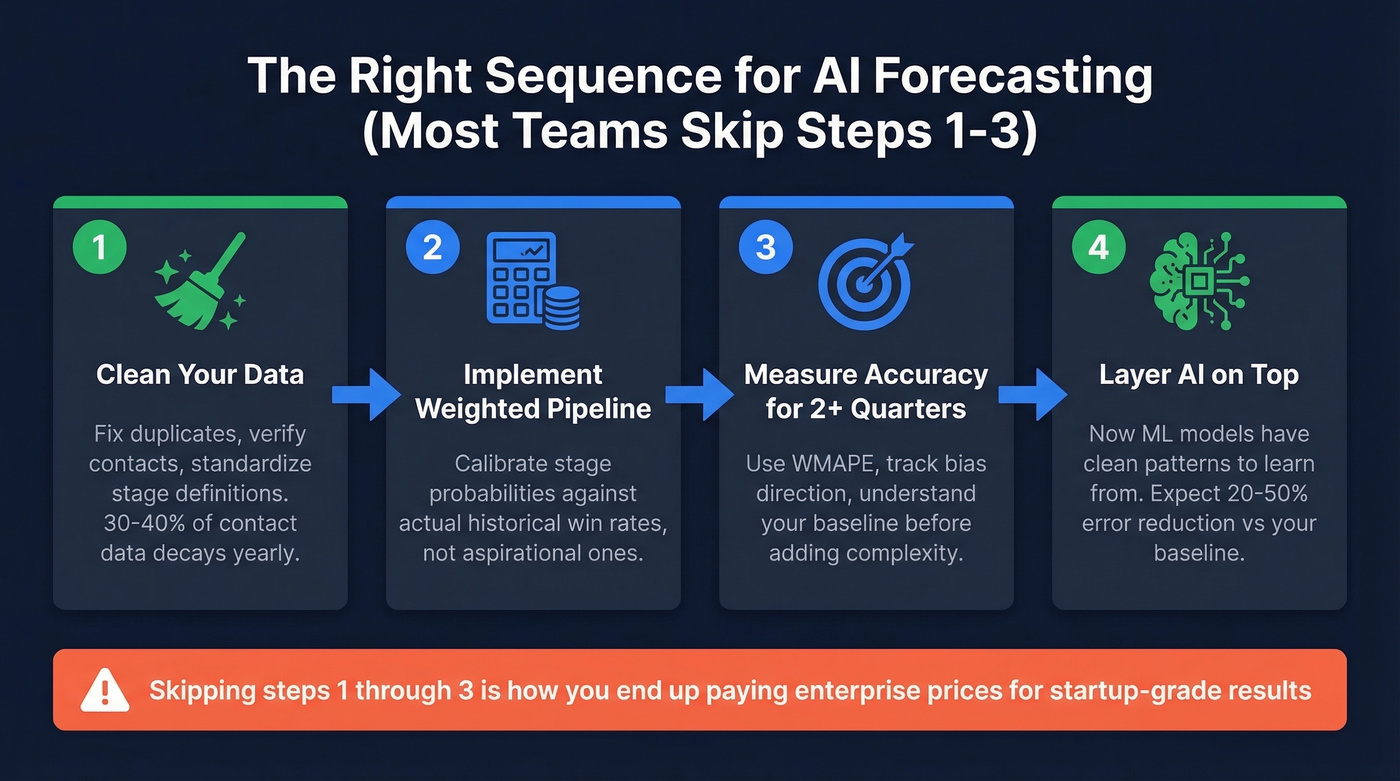
Here's the thing: most teams buying AI forecasting tools are solving the wrong problem. If you're a smaller team, you don't need a $75k AI forecasting platform. You need clean data and disciplined weighted pipeline. We've seen teams invest heavily in AI forecasting only to get marginal improvement because the underlying data was a mess. An expensive tool that's confidently wrong is still wrong.
The right sequence: clean your data first, implement weighted pipeline as your baseline, measure accuracy for at least two quarters, then layer AI on top. Skipping steps one through three is how you end up paying enterprise prices for startup-grade results. (If you're evaluating vendors, start with best sales forecasting tools.)
Tools Worth Knowing
The tool landscape splits into CRM-native forecasting and dedicated platforms. Pricing for Clari and Gong is custom; ranges shown are typical market estimates based on team size and contract terms.
| Tool | Type | Starting Price | Best For |
|---|---|---|---|
| Salesforce Sales Cloud Enterprise | CRM-native | ~$165/user/mo | Full-stack orgs already on Salesforce |
| HubSpot Sales Hub Professional | CRM-native | ~$90/user/mo | Mid-market teams wanting simplicity |
| Pipedrive Growth | CRM-native | $39/user/mo | SMB teams on a budget |
| Clari | Dedicated | ~$25k-$75k+/yr | Revenue operations at scale |
| Gong Forecast | Dedicated | ~$30k-$100k+/yr | Teams already using Gong for calls |
CRM-native forecasting is where most teams should start. Salesforce, HubSpot, and Pipedrive all include forecasting in their mid-tier plans, and for teams under 50 reps, that's usually sufficient. You don't need a $50k Clari contract to run weighted pipeline math. (If you're comparing CRMs, see examples of a CRM.)
Dedicated platforms like Clari and Gong Forecast earn their price when you have complex, multi-segment pipelines and need AI-driven deal scoring and scenario modeling. For a 200-person sales org doing $50M+ in ARR, the ROI math works. For a 15-person team, it's overkill.
A $39/month Pipedrive instance with clean, verified contact data will produce more accurate forecasts than a $165/month Salesforce instance full of duplicates and zombie deals. The tool matters far less than the data quality underneath it. (This is also why sales pipeline challenges show up as “forecasting problems.”)
Quick-Start Checklist
If you're building or rebuilding your CRM forecasting process, follow these six steps in order. Skipping ahead is how teams end up with sophisticated methodology on top of unreliable data.
Audit and enrich your CRM data. Before touching your forecast model, verify that your contacts and accounts are current. Automated enrichment tools with CRM integrations eliminate the manual cleanup that never actually happens. (See a practical lead enrichment workflow.)
Define pipeline stages and assign probabilities. Map your sales process to CRM stages, then calibrate probabilities against the last 12 months of closed-won and closed-lost data. Don't guess. (If you need a framework, use a sales process optimization checklist.)
Calculate pipeline coverage ratio by segment. Enterprise teams need 3-5x, mid-market 2.5-4x, SMB 2-3x. If you're short, that's a pipeline generation problem, not a forecasting problem.
Choose your forecasting method. Weighted pipeline is the minimum. Layer in AI/ML only after you have 12+ months of clean historical data and the budget to support it.
Set a measurement cadence. Track WMAPE and forecast bias monthly. Compare predicted versus actual at the deal level, not just the aggregate - aggregate accuracy masks segment-level problems.
Recalibrate quarterly. Stage probabilities drift as your market, product, and team change. Use the most recent 6-12 months of data each quarter.
Every outdated job title and dead email in your CRM is a deal that inflates your forecast but will never close. Prospeo enriches your CRM with 50+ data points per contact at a 92% match rate - replacing decayed records with verified emails, current titles, and direct dials.
Clean pipeline data means forecasts your VP can actually trust.
What's a good forecast accuracy rate?
80%+ is strong for most B2B teams. Median accuracy sits at 70-79% per Gartner, and only 7% of organizations consistently hit 90%+. If you're at 80%, focus on reducing directional bias rather than chasing perfection.
How often should I update my forecast?
Weekly minimum. Rolling weekly forecasts catch pipeline shifts - deals slipping, new opportunities accelerating - before they compound into quarter-end surprises. Monthly updates are stale by week two.
Can small teams benefit from CRM forecasting?
Absolutely. Even a five-rep team benefits from weighted pipeline over gut-feel roll-ups. Pipedrive offers built-in forecasting starting at $39/user/month, and pairing any CRM with clean contact data means a small team's forecast can outperform larger orgs running on dirty data.
What's the difference between pipeline coverage and forecast accuracy?
Coverage measures whether you have enough deals to hit your target - it's forward-looking capacity. Accuracy measures whether predictions matched reality - it's backward-looking calibration. You need both: coverage ensures sufficient pipeline, accuracy ensures your probability assumptions are correct.
How does data quality affect forecast accuracy?
Directly and dramatically. Outdated contacts inflate your pipeline with deals that won't close - a prospect who changed roles six months ago still shows as an open opportunity. Automated enrichment on a weekly refresh cycle keeps your pipeline grounded in reality and is the single most impactful fix for forecast inaccuracy rooted in bad data.