The B2B Customer Journey: What the Data Actually Says (and What Most Teams Get Wrong)
Most B2B journey maps are expensive wallpaper. Teams spend weeks in whiteboard sessions, produce a beautiful Miro board, then watch their SDRs blast the same generic sequence three months later. 82% of organizations create journey maps, but only 47% use them effectively. The problem isn't the map - it's what happens after the workshop ends.
The average B2B deal takes 272 days, involves 6.8 stakeholders, and spans 76 touchpoints across 3.7 channels. Meanwhile, 67% of buyers prefer a rep-free experience and 45% used AI in a recent purchase. If your map assumes human-led selling at every stage, it's already outdated.
What Is the B2B Customer Journey?
The B2B customer journey is the complete path a buying group takes from first recognizing a problem to becoming a long-term customer and advocate. Sounds simple. It isn't.
Unlike a B2C purchase where one person sees an ad, clicks, and buys, B2B buying processes involve an average of 6.8 stakeholders navigating 76 touchpoints across 3.7 channels over 272 days. These aren't sequential steps. They're overlapping, looping, and frequently contradictory - the VP of Engineering is evaluating your API docs while procurement negotiates terms and the CFO hasn't even heard your name yet.
As one B2B marketer put it on Reddit, marketing owns roughly 81% of that journey timeline. The deal is largely won or lost before sales ever gets involved.
Getting this wrong is expensive. 54% of B2B buyers will abandon a purchase or switch suppliers after a poor omnichannel experience. That's not a branding problem - it's a revenue problem.
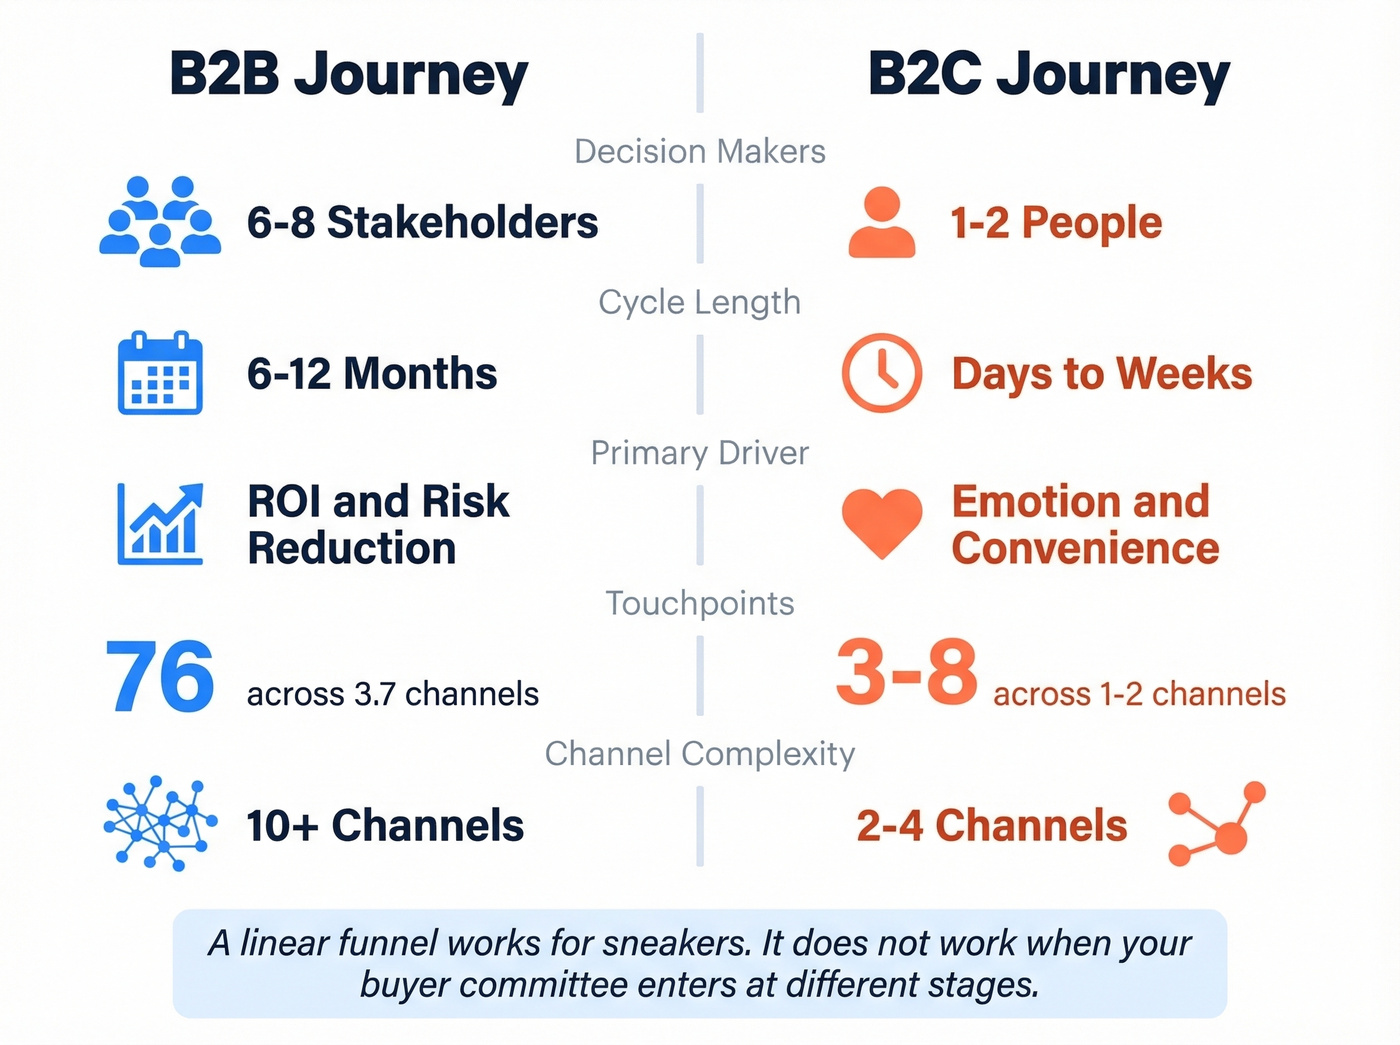
B2B vs B2C: 5 Differences That Matter
B2B and B2C journeys share vocabulary but almost nothing else in practice.
| Dimension | B2B | B2C |
|---|---|---|
| Decision-makers | 6-8 stakeholders | 1-2 people |
| Cycle length | 6-12 months avg | Days to weeks |
| Primary driver | ROI & risk reduction | Emotion & convenience |
| Touchpoints | 76 across 3.7 channels | 3-8 across 1-2 channels |
| Channel complexity | 10+ channels per journey | 2-4 channels typical |
A linear funnel with "awareness, consideration, purchase" might work for selling sneakers. It doesn't work when your buyer committee includes someone who entered at the decision stage because their boss forwarded a pricing PDF.
The 5 B2B Customer Journey Stages (With Benchmarks)
Every framework uses slightly different labels, but the underlying structure is consistent. McKinsey's "rule of thirds" applies across all stages: roughly a third of buyers prefer in-person interactions, a third prefer remote channels, and a third prefer digital self-serve. Your map needs to accommodate all three at every stage.
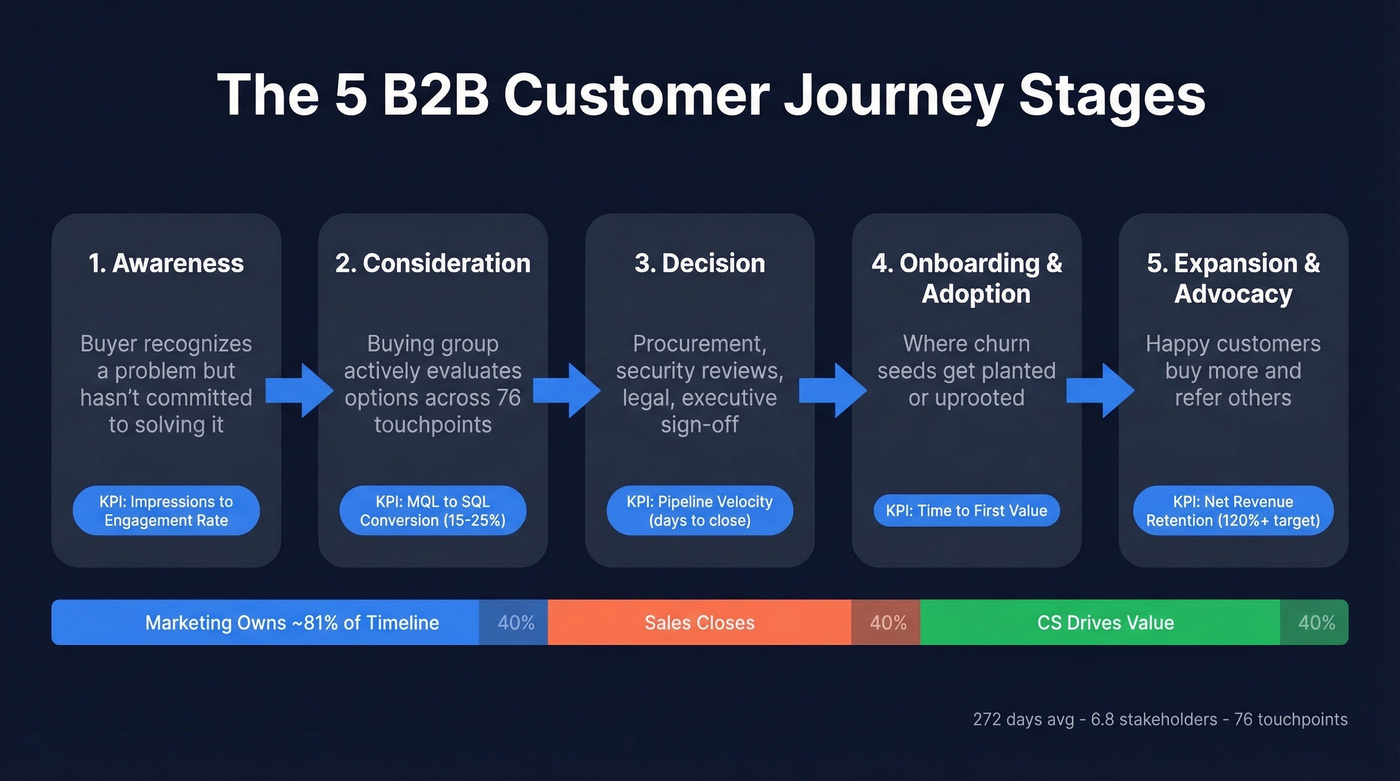
Awareness
The buyer recognizes a problem but hasn't committed to solving it. Touchpoints are mostly content-driven: blog posts, podcasts, peer conversations, industry reports. The dominant emotion is curiosity mixed with uncertainty - buyers are still framing the problem, not evaluating solutions. This is also where lead generation begins, since the contacts you capture here feed every downstream stage. KPI: impressions-to-engagement rate and first-touch attribution.
Consideration
The buying group is actively evaluating options. This is where the touchpoint count explodes - demos, vendor comparisons, analyst reports, internal business cases. Typical SaaS conversion from MQL to SQL runs 15-25% (see benchmarks). The key emotion is anxiety: buyers fear making the wrong choice in front of their peers, and 69% report inconsistencies between a supplier's website and what sellers say, which amplifies that anxiety. KPI: MQL-to-SQL conversion rate.
Decision
Procurement, security reviews, legal redlines, executive sign-off. This stage often becomes the longest part of the cycle because of all the organizational friction stacked on top of what should be a straightforward "yes." The dominant emotion is impatience layered with risk aversion - the champion has already decided but needs organizational buy-in. We've seen teams lose deals here not because of product fit, but because their proposal sat in legal for six weeks while a competitor closed in two. KPI: pipeline velocity, measured as days from verbal yes to signed contract (track it with pipeline health).
Onboarding & Adoption
The journey doesn't end at signature. This is where churn seeds get planted or uprooted. The buyer's emotional state shifts to cautious optimism: they've staked their reputation on this choice and need early wins to validate it. Teams that over-focus on acquisition and ignore post-sale stages are building a leaky bucket. KPI: time-to-first-value and product adoption milestones.
Expansion & Advocacy
Happy customers buy more and refer others. A customer who renews at 120% NRR is worth more than three new logos. The best B2B companies design this stage deliberately, not as an afterthought - it's the culmination of the entire lifecycle. KPI: net revenue retention and expansion revenue (tie this to upsell vs cross-sell strategy).
What's Changed in 2026
The B2B buyer journey is shifting faster than most maps can keep up with.
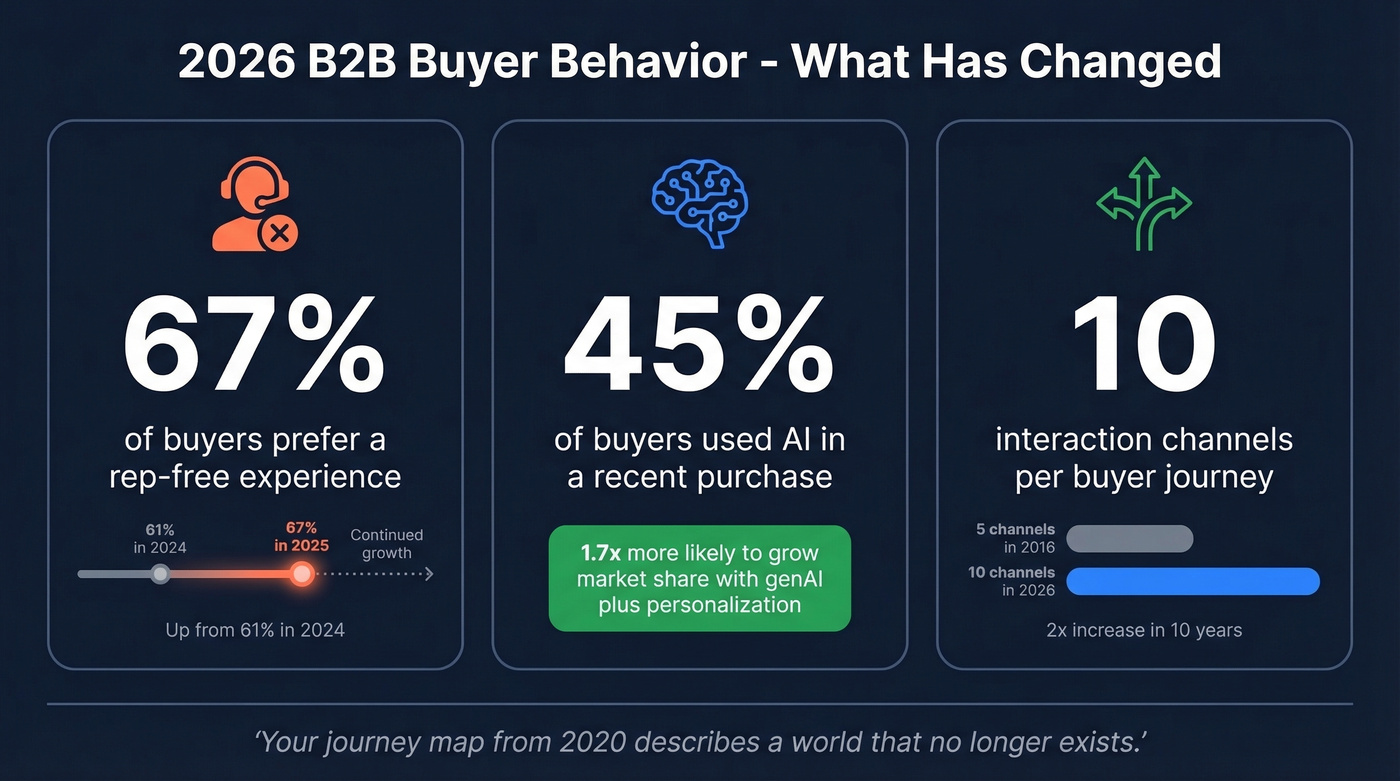
The rep-free preference keeps climbing. In a 2024 survey of 632 buyers, 61% preferred a rep-free experience. By 2025, that number hit 67%. The trajectory is clear: 20% of buyers are now comfortable spending $1M-$10M+ through remote or self-serve channels, up from 15% in 2022.
AI is reshaping the buying process itself. 45% of buyers used AI during a recent purchase. On the seller side, 19% of B2B sales organizations are implementing genAI use cases and another 23% are experimenting. Teams that combine genAI with personalization are 1.7x more likely to increase market share.
Channel complexity is rising fast. Buyers now use an average of 10 interaction channels throughout their journey, up from 5 in 2016. Your journey map from 2020 - the one with three channels and a linear flow - describes a world that no longer exists.
Let's be honest: most teams don't need a fancier journey map. They need a simpler one that they actually update. A three-stage map reviewed monthly beats a seven-stage masterpiece that nobody opens after Q1.
With 6.8 stakeholders per deal, reaching the right people at the right stage isn't optional - it's the entire game. Prospeo gives you 30+ filters including buyer intent, job changes, and department headcount so you can map real contacts to every stage of the buying committee's journey. 98% email accuracy means your touchpoints actually land.
Stop mapping journeys you can't activate. Start with verified buyer data.
How to Map Your B2B Customer Journey
Here's the thing: most mapping guides focus on the workshop. The workshop is the easy part. The hard part is everything before and after it.
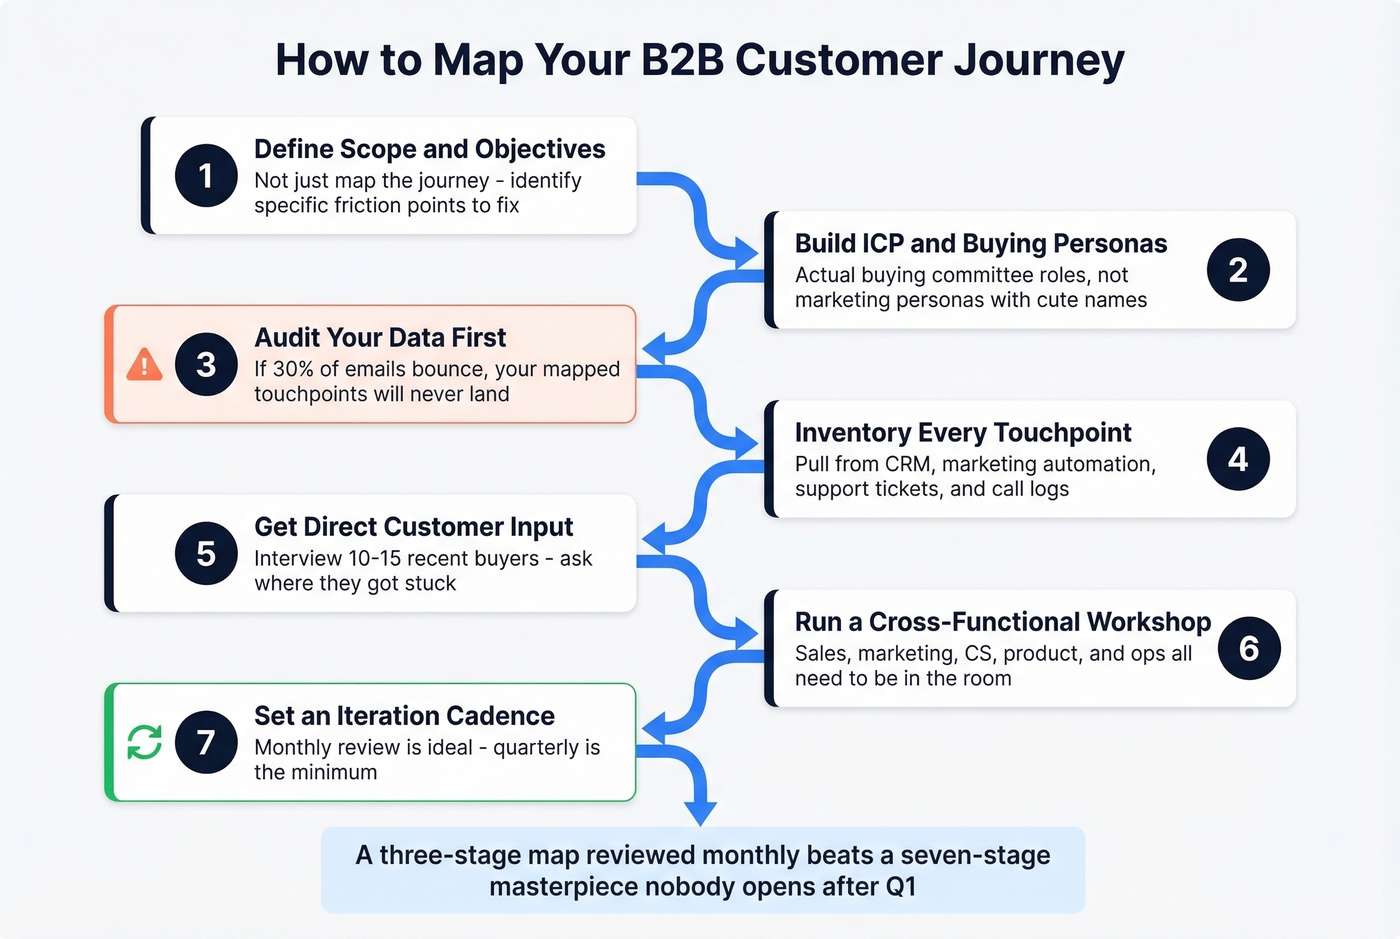
1. Define scope and objectives first. "Map the customer journey" isn't a goal. "Reduce time-to-close for mid-market deals by identifying the three biggest friction points" is a goal.
2. Build your ICP and buying personas. Not marketing personas with cute names - actual buying committee roles. Who initiates? Who evaluates? Who signs? Who blocks? (Use an ideal customer profile template to keep this grounded.)
3. Audit your data before you map. If 30% of your emails bounce and job titles are 18 months stale, the journey you design will never reach the right people. In our experience, this is where most teams cut corners - and it's the step that matters most. Prospeo's 7-day data refresh and 98% email accuracy can clean your CRM before you start, so your mapped touchpoints actually land.
4. Inventory every touchpoint. Pull data from your CRM, marketing automation, support tickets, and sales call logs. Map what buyers actually do, not what you assume they do.
5. Get direct customer input. Interview 10-15 recent buyers. Ask where they got stuck, what almost made them walk away, and what information they couldn't find. Maps built without customer input are fiction.
6. Run a cross-functional workshop. Sales, marketing, CS, product, and ops need to be in the room. Designing in silos produces a map that reflects one team's perspective, not the buyer's reality.
7. Set an iteration cadence. Quarterly review with fresh data is the minimum. Monthly is better. The map is a living document or it's wallpaper.
7 Mistakes That Kill Journey Maps
1. Mapping the journey you want, not the one buyers take. Your internal funnel says "demo, trial, close." Your buyers say "read three blog posts, ask a friend, ignore your emails for two months, then request pricing." Map reality.
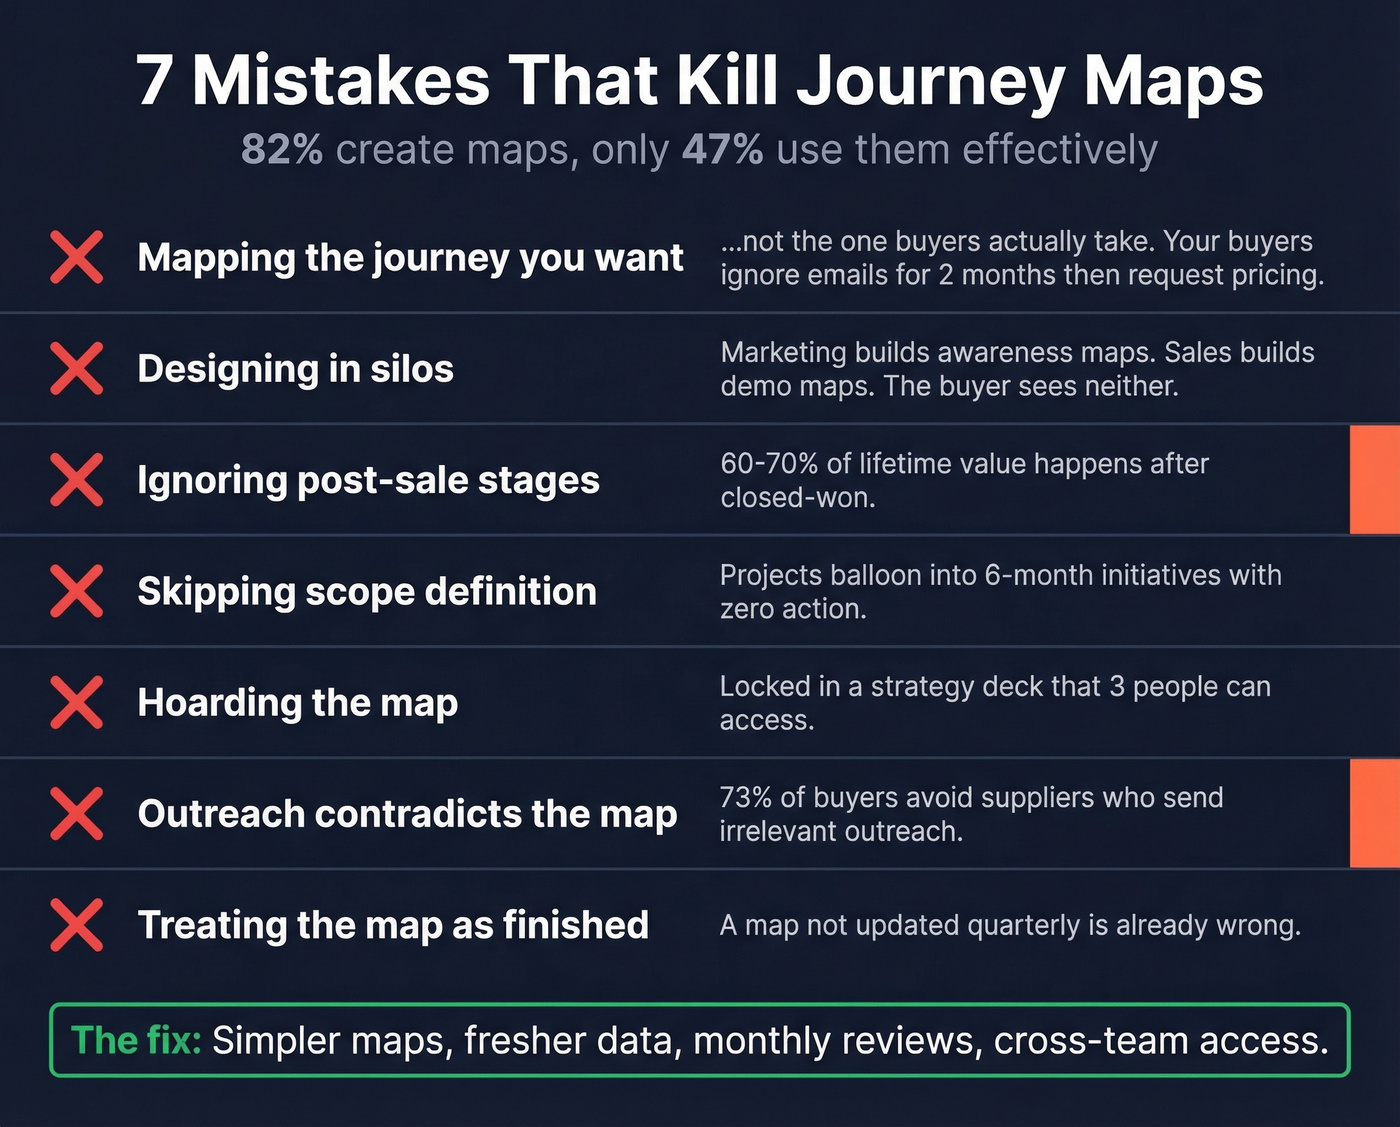
2. Designing in silos. When marketing builds the map alone, it reflects marketing's view. When sales builds it, it starts at the demo. The buyer doesn't care about your org chart.
3. Ignoring post-sale stages. We've reviewed dozens of journey maps that end at "closed-won." That's where 60-70% of lifetime value actually begins. Without lifecycle insights from onboarding and renewal data, you're optimizing for acquisition while hemorrhaging revenue (see churn analysis).
4. Skipping scope definition. Without clear objectives, mapping projects balloon into six-month initiatives that produce beautiful artifacts and zero action.
5. Hoarding the map. Journey maps locked in a strategy deck that three people have access to don't change behavior. Frontline teams - SDRs, AEs, CSMs - need to see and use the map daily.
6. Sending outreach that contradicts the map. 73% of B2B buyers actively avoid suppliers who send irrelevant outreach. Your journey map says "send personalized email to VP of Engineering" but your CRM has an email that bounced six months ago and a title from 2022. The map is only as good as the data powering it (fix the basics like email bounce rate).
7. Treating the map as finished. A journey map that isn't updated quarterly is already wrong. The gap between the 82% who create maps and the 47% who use them effectively? It's almost entirely an iteration problem. One Reddit practitioner summed it up well: the buying journey is fundamentally non-linear, and any map that pretends otherwise will break on contact with reality.
How AI Changes Journey Mapping in 2026
Practical AI Use Cases
AI isn't replacing journey maps - it's making them dynamic instead of static. The use cases are already here: automated CRM data integration, behavioral analysis across digital touchpoints, predictive analytics that flag at-risk deals before they stall, and NLP-powered sentiment analysis on support tickets and call transcripts.
From Static to Agentic Orchestration
The 2026 shift isn't just "use AI to personalize emails." It's agentic orchestration - AI that reads intent signals, sentiment, and context to dynamically adjust the next touchpoint without human intervention.
A concrete example: a prospect visits your pricing page three times in a week while simultaneously filing a frustrated support ticket on their current vendor. An agentic system pauses the standard nurture sequence, alerts a human AE with context, and queues personalized outreach that references the specific pain point. This kind of responsiveness strengthens buyer relationships in ways that static drip campaigns never will.
Gartner recommends operationalizing both buyer-facing and seller-facing AI agents and building modular content that these systems can assemble dynamically. The static personalization playbook - "insert first name, reference company" - has run its course. Purchase-history-based recommendations have dropped 24% in effectiveness per HubSpot's 2026 analysis.
Tools for Execution
Journey Mapping
Start simple. Miro, UXPressia, and Lucidchart all offer free tiers, with paid plans typically starting around $8-20/user/month. Skip this if you're under 50 people and haven't validated your map with 10 customer interviews yet - a spreadsheet works fine until then.
Analytics & CRM
Salesforce and HubSpot are the obvious choices for tracking journey data at scale. Google Analytics covers the digital touchpoint layer for free. Enterprise journey analytics platforms run $30K-100K+/year - worth it at scale, overkill for most mid-market teams.
Data Quality & Enrichment
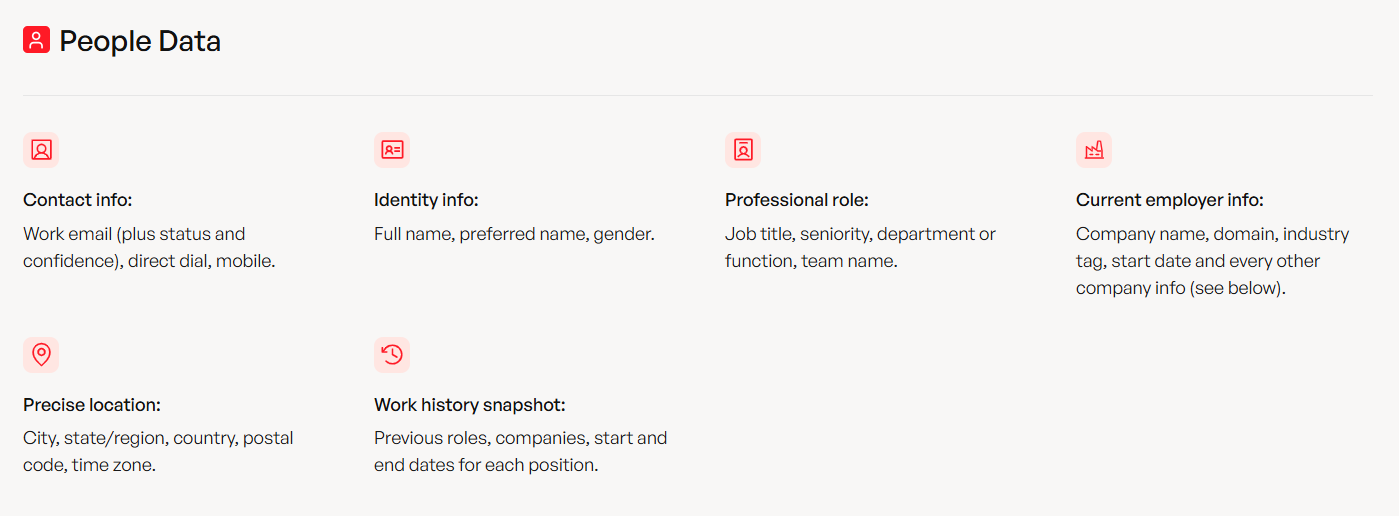
This is where most journey maps quietly fail. You've designed the perfect touchpoint sequence, but 25% of your emails bounce and half your job titles are outdated. Without clean data, your carefully mapped outreach goes cold before it ever reaches the right person. Prospeo fills this gap with 300M+ professional profiles, 98% email accuracy, and a 7-day data refresh cycle. CRM enrichment returns 50+ data points per contact at an 83% match rate. Free tier available, no contracts, and paid plans start at roughly $0.01 per email credit (compare options in data enrichment services).
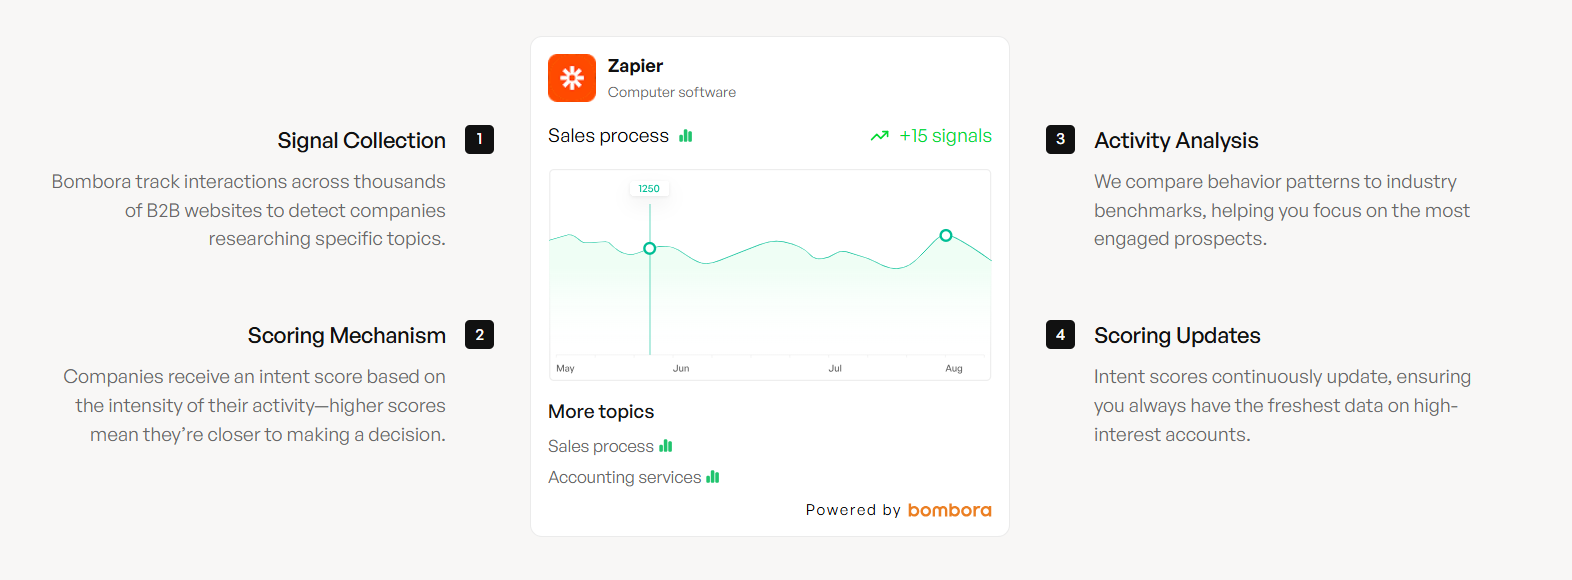
Marketing owns 81% of the B2B journey timeline, but that only matters if you're reaching in-market buyers before competitors do. Prospeo tracks 15,000 intent topics via Bombora and refreshes data every 7 days - so you engage buying groups while they're still in the awareness stage, not after they've already shortlisted someone else.
Catch buyers at the start of their journey, not the end of it.
FAQ
What are the main B2B customer journey stages?
Five core stages: awareness, consideration, decision, onboarding/adoption, and expansion/advocacy. Real journeys are non-linear - buyers loop back, skip stages, and enter at different points depending on their role in the buying committee.
How long does a typical B2B buying cycle take?
Benchmarks show 272 days from first touch to revenue, with 76 touchpoints across 3.7 channels. Enterprise deals trend longer. Marketing influences roughly 81% of that timeline - the deal is mostly pre-pipeline.
How does AI improve B2B journey mapping?
AI enables predictive analytics, real-time personalization, and agentic orchestration - adjusting next-best actions based on intent and sentiment signals instead of static rules. Teams blending genAI with personalization are 1.7x more likely to grow market share.
How do you keep journey contact data accurate?
CRM data decays fast - job titles change, people leave companies, emails go stale. Build a quarterly data audit into your mapping cadence and use enrichment tools with frequent refresh cycles to keep your outreach hitting the right inboxes.