Email Analytics: What to Track, What to Ignore, and What's Broken
Your dashboard says 38% open rate. The team's celebrating. But a big chunk of those "opens" are Apple Mail preloading tracking pixels on devices where nobody read a word. You're optimizing against phantom engagement, and your email analytics are built on noise.
Let's fix that.
The Short Version
Stop obsessing over open rates. Track four metrics: deliverability rate, click-through rate, conversion rate, and revenue per email. Everything else is context.
Before you analyze anything, clean your list. Bad data poisons every metric downstream. Your stack needs three layers: your ESP's built-in reporting, one deliverability monitor (Google Postmaster Tools - free), and one verification tool like Prospeo.
35% of companies see email ROI of 36:1 or higher. You don't get there by tracking fifteen vanity metrics.
What Is Email Analytics?
Email analytics covers two separate problems, and most guides mash them together. That's why the advice feels generic.
Campaign analytics is what marketers think of first: open rates, click rates, conversions, unsubscribes, revenue attribution. It measures how recipients interact with your emails. 58% of marketing teams send emails weekly or more, which means most companies generate enough campaign data to spot patterns - if they're measuring the right things. Tracking the right email campaign metrics from the start is what separates teams that iterate from teams that guess.
Operational analytics is the other half. This tracks team behavior: how fast reps respond, email volume per person, busiest send windows, SLA compliance. Sales managers and support leads care about this. Tools like EmailAnalytics and timetoreply live here, not in the marketing stack.
The distinction matters because the metrics, tools, and benchmarks are completely different for each. A marketing team optimizing CTR and a sales manager tracking response times shouldn't be reading the same dashboard.
How Email Tracking Works
Most email metrics rely on two simple mechanisms. Open tracking embeds an invisible 1x1 pixel image in the email body - when a recipient's email client loads that image, the server logs an "open." Click tracking wraps every link in a redirect URL so the redirect fires before sending them to the destination.
For attribution beyond the email itself, UTM parameters tag links so Google Analytics or your CRM can trace which campaign, source, and medium drove a conversion. This is where measurement connects to revenue.
Both mechanisms have blind spots. Image blocking prevents pixel loads. Privacy tools strip UTM parameters. And then there's Apple MPP, which made open tracking unreliable for a huge share of inboxes.
Why Open Rates Are Broken
Apple Mail Privacy Protection launched in 2021, and it fundamentally changed what "open rate" means. When someone uses Apple Mail on any device - iPhone, iPad, Mac - Apple's proxy servers preload all images in the email, including tracking pixels. The pixel fires whether or not the person actually reads the message.
MPP also masks IP addresses, geolocation, device type, and timestamps. Your "opened at 9:14 AM in Chicago" data point? Easily a proxy load, not a human reading the email.
Here's the thing: open rates aren't useless, but they've been demoted from "primary metric" to "directional signal." The metrics that matter now are all intentional actions - clicks, replies, conversions, purchases. Things a proxy server can't fake.
If your average deal size is small and your team has fewer than five people, you probably don't need anything beyond your ESP's built-in reporting plus Google Postmaster Tools. The analytics tool rabbit hole is deep, and most small teams drown in dashboards instead of improving their actual emails. Skip the fancy stuff until you've outgrown the basics.
The Metrics That Actually Matter
The 4 You Should Obsess Over
Deliverability rate measures the percentage of emails that successfully get delivered without bouncing. Formula: (Emails delivered / Emails sent) x 100. Separately, inbox placement tracks whether those delivered emails land in the inbox vs. spam or promotions. A good deliverability rate typically ranges between 85% and 95%. Below 85%, something's wrong with your list hygiene, authentication, or sender reputation. Monitoring deliverability weekly catches problems before they snowball into full-blown reputation damage. For a deeper fix, follow an email deliverability guide before you change copy or cadence.
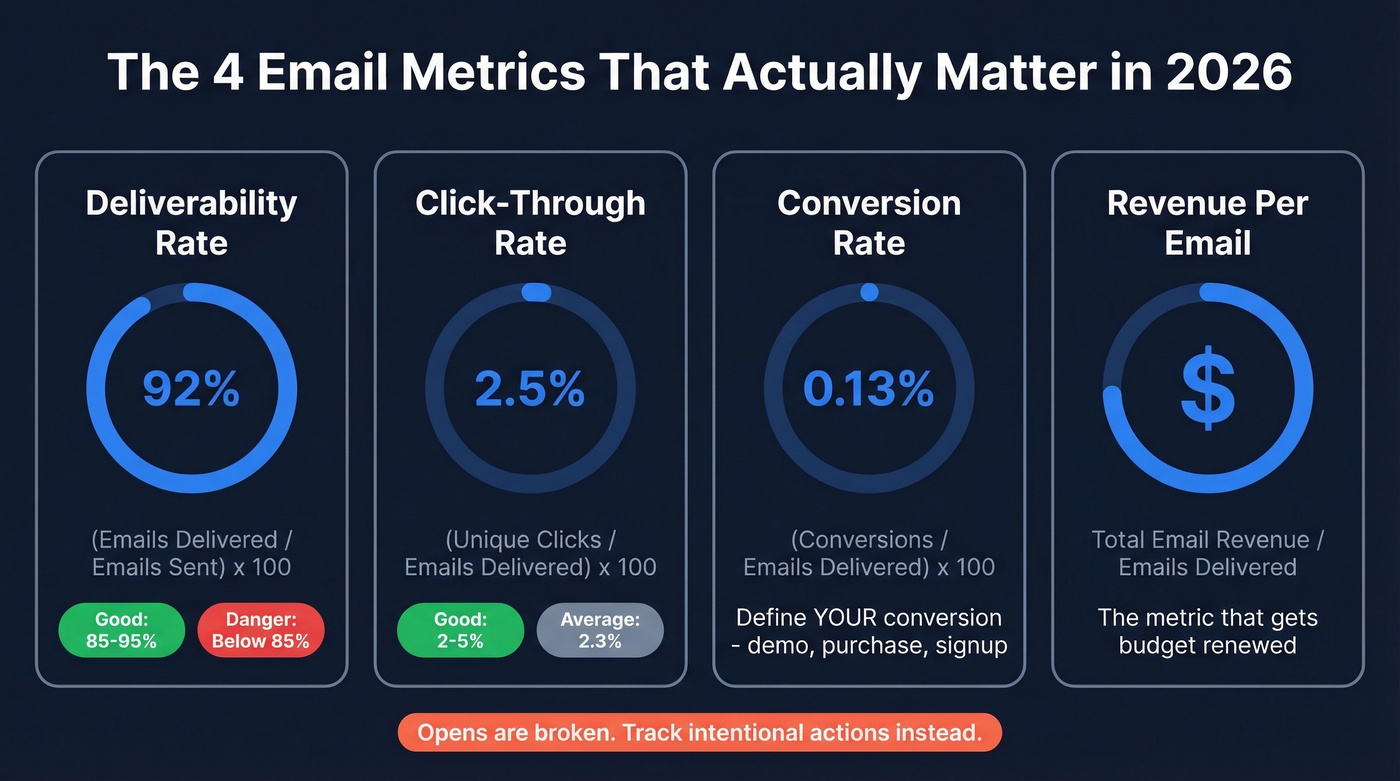
Click-through rate (CTR) is the post-MPP workhorse. Formula: (Unique clicks / Emails delivered) x 100. The cross-industry average is 2.3%, with a "good" range of 2-5% depending on industry. Unlike opens, clicks require intentional action. If you want the math and variants, use this click rate formula.
Let's make this concrete. You sent 10,000 emails last Tuesday. 9,200 were delivered (92% deliverability - healthy). Of those, 230 people clicked a link - that's a 2.5% CTR, right in the middle of the healthy range. If 12 of those clicks converted into demo bookings, your conversion rate is 0.13%, and if each demo is worth $500 in pipeline, that single send generated $6,000. Now you have a number your CFO cares about.
Conversion rate connects email to business outcomes. Formula: (Conversions / Emails delivered) x 100. What counts as a "conversion" depends on your goal - demo booked, purchase completed, form submitted. If you're not tracking this, you're measuring activity, not results. If you’re benchmarking top-of-funnel performance, compare against the average B2B lead conversion rate.
Revenue per email is the metric that gets budget renewed. Formula: Total email-attributed revenue / Emails delivered. It requires UTM parameters and proper CRM attribution, but it's the only metric that directly answers "is email making us money?" If you’re struggling to connect the dots, start with funnel metrics so email reporting maps to pipeline.
The 6 That Provide Context
These aren't primary metrics, but they help diagnose problems when the big four move in the wrong direction.
Open rate - (Unique opens / Emails delivered) x 100. Still useful as a directional trend line within your own data, but don't benchmark against industry averages. MPP has inflated them beyond usefulness. If you still need a sanity check, see what is a good email open rate.
Click-to-open rate (CTOR) - (Unique clicks / Unique opens) x 100. The cross-industry average is 10.5%. CTOR isolates content quality from subject line performance. Decent open rate but low CTOR? The email body isn't compelling enough.
Bounce rate - (Bounced emails / Emails sent) x 100. Hard bounces from invalid addresses hurt sender reputation immediately. Soft bounces are less urgent but still worth monitoring. Keep total bounce rate under 2-3%. If you’re troubleshooting spikes, use this email bounce rate breakdown.
Unsubscribe rate - (Unsubscribes / Emails delivered) x 100. The all-user average is 0.22%. Anything above 0.5% consistently signals a frequency or relevance problem.
List growth rate - (New subscribers - Unsubscribes - Bounces) / Total list size x 100. Lists naturally decay 2-3% per month. If you're not growing faster than that, your audience is shrinking.
ROI - (Revenue from email - Cost of email) / Cost of email x 100. The ultimate accountability metric, though it requires clean attribution to calculate honestly.
You just read that bounce rates above 2-3% damage sender reputation. Bad contact data is the #1 cause. Prospeo's 5-step email verification keeps bounce rates under 4% - proven across 15,000+ companies. At $0.01 per verified email, fixing your deliverability rate costs less than one bad send.
Stop poisoning your email analytics with bad data.
Industry Benchmarks for 2026
Benchmarks are guardrails, not goals. Two companies in the same industry with different list sizes, send frequencies, and audience quality will see wildly different numbers. That said, you need reference points.
| Metric | All-User Average | 2022 Benchmark | Good Range |
|---|---|---|---|
| Open rate | 35.63% | 21.5% | 17-28%* |
| CTR | 2.62% | 2.3% | 2-5% |
| CTOR | - | 10.5% | 6-17% |
| Unsub rate | 0.22% | - | Under 0.5% |
*The 2022 benchmark numbers are based on 2021 send data, making them a closer proxy for human engagement than all-user averages inflated by MPP.
By industry:
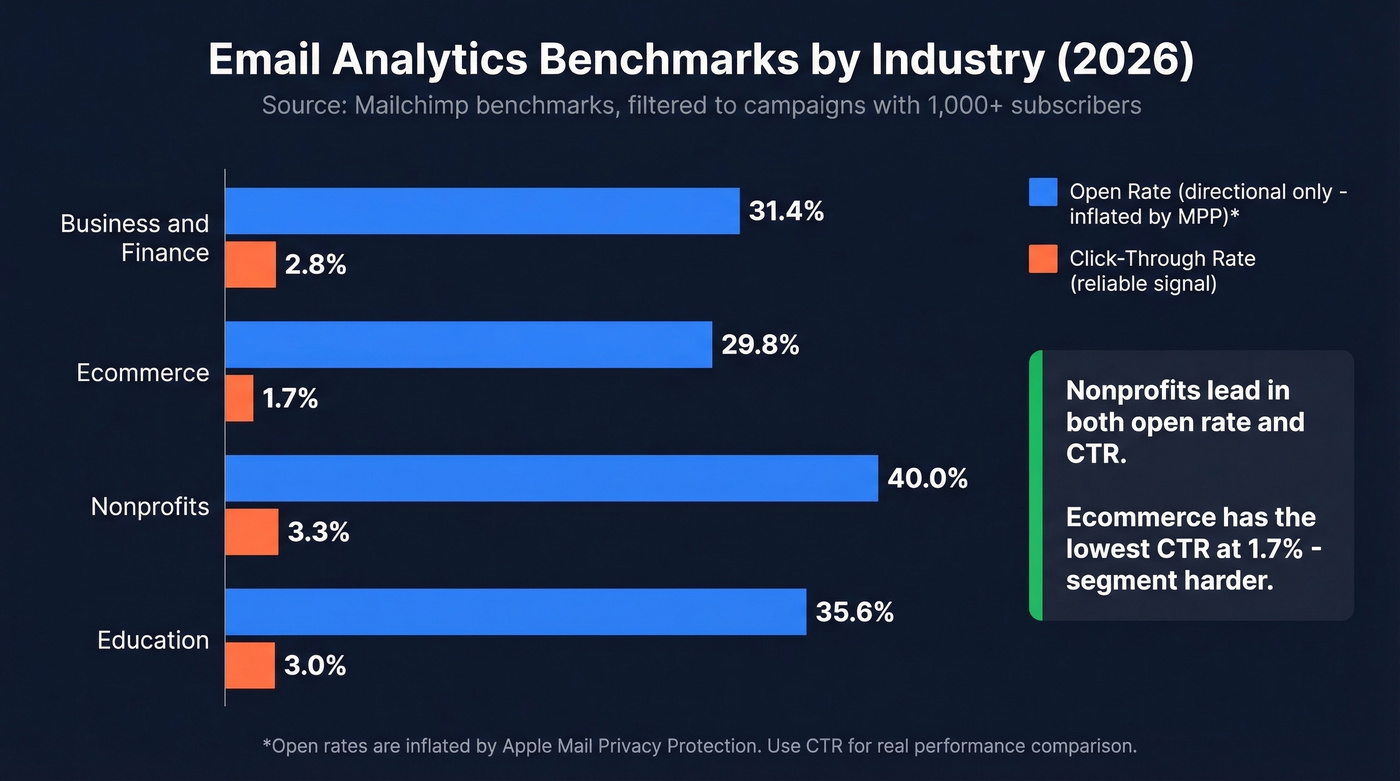
| Industry | Open Rate | CTR | Unsub Rate |
|---|---|---|---|
| Business & Finance | 31.35% | 2.78% | 0.15% |
| Ecommerce | 29.81% | 1.74% | 0.19% |
| Nonprofits | 40.04% | 3.27% | 0.18% |
| Education | 35.64% | 3.02% | 0.18% |
A note on methodology: the all-user averages come from Mailchimp's benchmarks, based on billions of delivered emails filtered to campaigns with 1,000+ subscribers and tracking enabled (last updated December 2023). The 2022 figures come from Campaign Monitor's benchmark report using 2021 send data. Neither is a 2026 dataset, but they're the most widely cited references in the industry. Use the 2022 ranges for realistic goal-setting and the industry breakdowns for relative comparisons within your vertical.
Clean Data Comes First
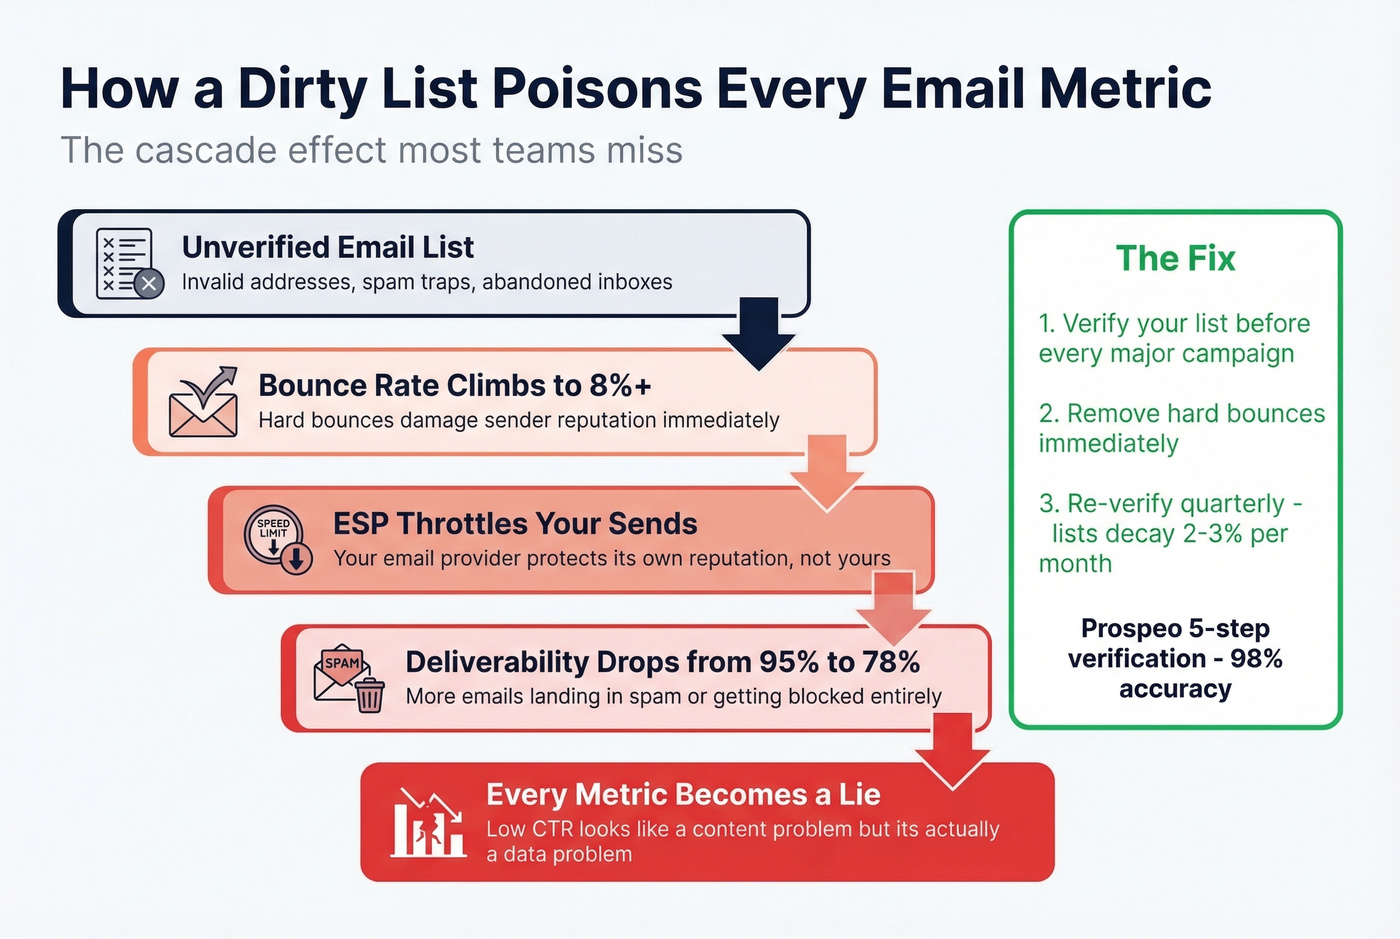
Every metric above becomes meaningless if your list is dirty. We've seen this pattern play out dozens of times: bounce rate creeps to 8%, your ESP starts throttling sends to protect its own reputation, deliverability drops from 95% to 78%, and suddenly your "low CTR" isn't a content problem - it's a data problem. You're optimizing the wrong thing. If you suspect reputation issues, start with how to improve sender reputation.
One real example: Stack Optimize built to $1M ARR running client campaigns with 94%+ deliverability, under 3% bounce rates, and zero domain flags across all clients. List verification was the foundation. Without clean data, even the most sophisticated email campaign metrics tell you nothing useful. If you’re cleaning lists at scale, consider a dedicated spam trap removal process.
Run your list through verification before any major campaign or analytics review. Prospeo's 5-step verification process handles catch-all domains, removes spam traps and honeypots, and delivers 98% email accuracy. The free tier gives you 75 emails per month - enough to audit a segment and see how much dead weight your list is carrying.
Verify before you analyze. A clean list makes every downstream metric reliable. A dirty list makes every dashboard a liar.
Email Analytics Tools
Campaign Analytics Platforms
Most ESPs include solid analytics out of the box. You probably don't need a separate tool for campaign metrics - you need to actually use the reporting your ESP already provides. If you’re doing outbound sequences, it also helps to understand email velocity so your analytics don’t get skewed by throttling.
| Platform | Starting Price | Free Tier | Best For |
|---|---|---|---|
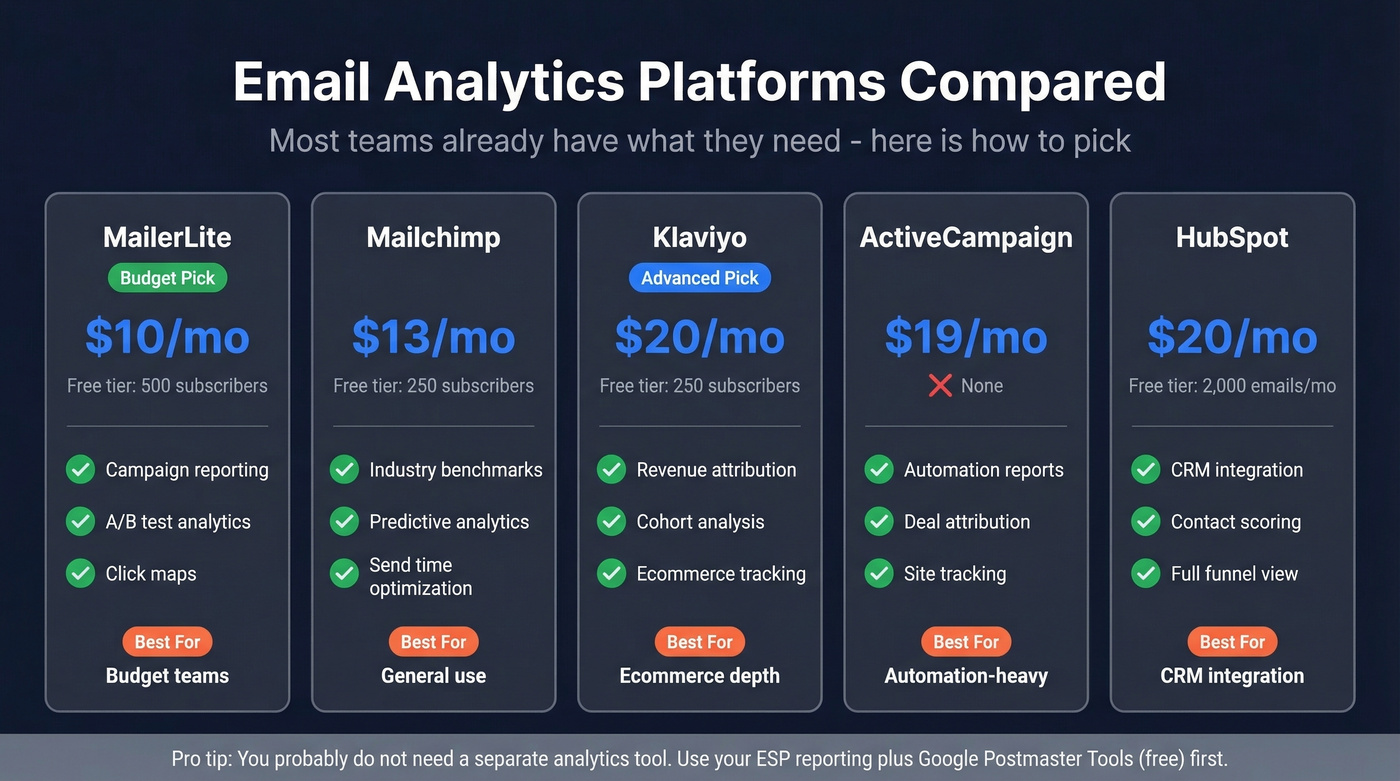
| MailerLite | $10/mo | 500 subscribers | Budget teams |
| Mailchimp | $13/mo | 250 subscribers | General use |
| Klaviyo | $20/mo | 250 subscribers | Ecommerce depth |
| ActiveCampaign | $19/mo | None | Automation-heavy |
| HubSpot | $20/mo | 2,000 emails/mo | CRM integration |
Budget pick: MailerLite. The analytics dashboard covers everything most teams need, and the free tier is generous enough to get started. Advanced pick: Klaviyo, especially for ecommerce - its revenue attribution and cohort analysis are a tier above the rest.
Team & Operational Tools
Skip this section entirely if you're a marketer. Campaign metrics don't help sales managers or support leads. They need visibility into response times, email volume, and individual rep activity - a completely different toolset.
EmailAnalytics connects to Gmail and Outlook and visualizes team email activity: average response time, emails sent per day, busiest hours. It offers a 14-day free trial. Email Meter covers similar ground with a free tier for individuals and paid plans for teams. timetoreply focuses specifically on response time SLAs, which matters when you're holding reps accountable to a 15-minute first-response standard.
For teams that just need a quick pulse on email habits, Email Meter's free tier is enough. When you're managing SLAs with real consequences, timetoreply earns its price.
Deliverability Monitoring
Start with Google Postmaster Tools - it's free and shows you how Gmail sees your domain reputation, spam rate, and authentication status. Every sender should have this running. If you’re tightening authentication, use a DMARC alignment checklist.
When you're sending at scale (50k+ emails/month), the decision tree is straightforward. GlockApps at $59/mo gives you inbox placement testing across providers - you'll see exactly which ISPs are sending you to spam. Postmark at $15/mo is the right call for transactional email monitoring. Everest by Validity at $15,000/yr is the enterprise play - overkill for most teams, but necessary if you're sending millions monthly and need ISP-level feedback loops.
The benchmark to watch: 85-95% deliverability is "good." Below 85%, stop sending and start diagnosing.
Five Common Mistakes
1. Trusting open rates as a primary KPI. Post-MPP, open rates are inflated for anyone with Apple Mail users. Shift your primary metrics to CTR and conversion rate.
2. Never cleaning your list. Every list decays - people change jobs, abandon addresses, get auto-forwarded to spam traps. Verify before every major campaign. A 5-minute upload saves weeks of deliverability recovery.
3. Blasting the entire list without segmentation. This is one of the fastest ways to tank engagement and train ISPs to deprioritize you. Segment by engagement recency, and stop automating without personalizing.
4. Ignoring deliverability until it's a crisis. Check Google Postmaster Tools monthly. Set a calendar reminder. Don't wait until your emails hit spam - by then, recovery takes weeks.
5. Not connecting email to revenue. You can't justify budget with open rates. Set up UTM parameters on every email link and track conversions in your CRM. If you can't answer "how much revenue did email drive last month," your email analytics setup isn't finished.
Your email analytics are only as good as the contacts you're sending to. Lists decay 2-3% monthly, and every invalid address drags down deliverability, inflates bounce rates, and corrupts the metrics you actually care about. Prospeo refreshes 300M+ profiles every 7 days - not every 6 weeks like competitors - so your data stays accurate between sends.
Fresh data, clean metrics, real revenue attribution.
FAQ
What's a Good Open Rate in 2026?
The all-user average is 35.63%, but Apple MPP inflates that significantly. A realistic range for actual human engagement is 17-28%. Stop benchmarking open rates as a primary KPI and focus on CTR, which reflects real intent and can't be faked by proxy servers.
What's the Difference Between CTR and CTOR?
CTR measures clicks as a percentage of all emails delivered; CTOR measures clicks as a percentage of emails opened. The average CTOR is 10.5%. CTOR is more useful for evaluating content quality because it isolates email body performance from subject line effectiveness.
How Does Apple MPP Affect Email Performance?
Apple Mail preloads tracking pixels via proxy servers, registering an "open" even when nobody reads the email. It also masks IP addresses, geolocation, and device data. Shift measurement to clicks, conversions, and replies - metrics that require intentional human action and can't be triggered by automated preloading.
What Free Tools Help With Email List Verification?
Prospeo offers 75 free email verifications per month with 98% accuracy, including catch-all handling and spam-trap removal. Google Postmaster Tools (completely free) monitors your domain reputation and spam rate. Together, they cover verification and deliverability monitoring without any upfront cost.