Email Performance Metrics That Actually Matter in 2026
You're tracking open rates, click-through rates, maybe bounce rates - and half of those numbers are wrong. Apple's Mail Privacy Protection inflates opens. Security bots inflate clicks. "Delivered" doesn't mean "seen." The email performance metrics your ESP shows you are a funhouse mirror, and most teams are making decisions based on distorted reflections.
Here's the thing: email still generates $36 for every $1 spent. That ROI is real. But only if you're measuring the right things. HubSpot's research found 34% of marketers track click-through rate and 31% track open rate as their top metrics - both of which are compromised in 2026. Let's fix that.
The Three-Metric Priority Stack
For 2026, we've boiled it down to three numbers that actually tell you something:
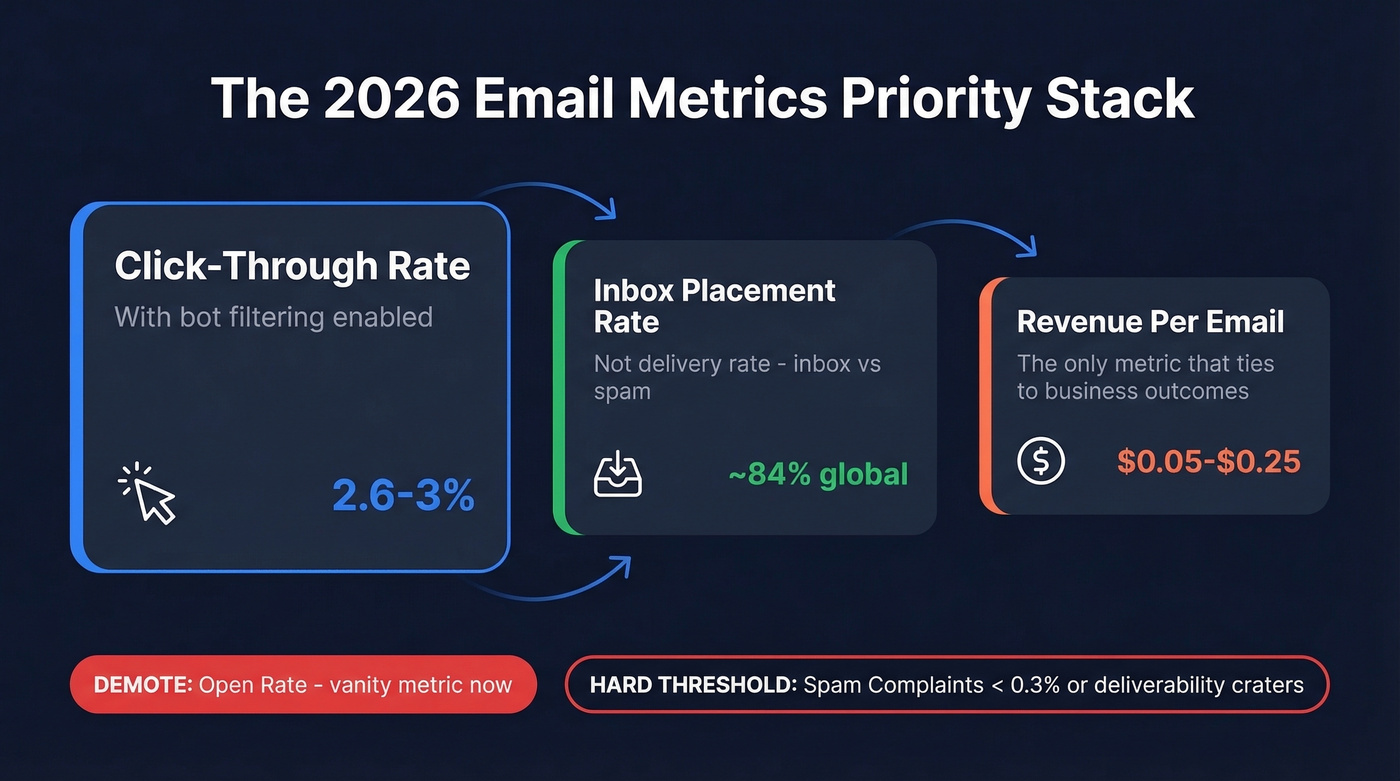
- Click-through rate - with bot filtering enabled. Raw CTR is meaningless.
- Inbox placement rate - not delivery rate. "Delivered" means the receiving server accepted it; your email can still land in spam.
- Revenue per email - the only metric that ties email to business outcomes.
One metric to demote: open rate. It's a vanity metric now.
One metric to treat as a hard threshold: spam complaint rate. Gmail and Yahoo enforce a 0.3% ceiling. Exceed it and your deliverability craters.
Key Metrics at a Glance
| Metric | Formula | 2026 Benchmark | Priority |
|---|---|---|---|
| Open Rate | Opens / Delivered | ~20-35% | Low (context only) |
| CTR | Clicks / Delivered | 2.6-3% | High |
| CTOR | Clicks / Opens | 7-13% | Medium |
| Reply Rate | Replies / Delivered | ~8.5% | High |
| Bounce Rate | Bounces / Sent | <2% | High |
| Spam Complaint Rate | Complaints / Delivered | <0.3% | Critical |
| Inbox Placement | Inbox / (Inbox + Spam) | ~84% global | High |
| Delivery Rate | Delivered / Sent | 98%+ (if bounce ≤2%) | Medium |
| Post-click Conversion Rate | Conversions / Clicks | 1-5% typical | High |
| Revenue Per Email | Revenue / Emails Sent | $0.05-$0.25 | High |
| List Growth Rate | (New - Lost) / Total | Positive | Medium |
| Unsubscribe Rate | Unsubs / Delivered | 0.1-0.3% | Medium |
Priority ratings reflect metric reliability in 2026, accounting for privacy changes, bot activity, and provider enforcement.
Engagement Metrics
Open Rate Is Broken
Open rate is a vanity metric in 2026. Full stop.
Apple's Mail Privacy Protection affects roughly 40% of all emails by pre-fetching content and generating machine opens. When MPP launched in September 2021, unique open counts jumped 6.5% in a single week, and corporate security tools pile on another 6.5% inflation on top of that. A study found that 77% of marketers wrongly believe MPP is automatically activated for all Apple Mail users - it's actually opt-in, but adoption is high enough that the damage is done.
Use open rate as directional context for A/B testing subject lines within the same audience segment. Don't use it as a KPI. Don't build automations around it. Don't report it to your CEO as proof that email is working.
The conversation among practitioners has shifted toward revenue-based success measurement, and for good reason - open rate tells you almost nothing reliable anymore.
Click-Through Rate
Formula: Total clicks / Emails delivered x 100
CTR is the engagement metric that still means something, provided you're filtering out bots. The cross-industry average sits around 2.6-3%, though ranges vary wildly by industry. Advertising and marketing averages 3.29%. IT/Tech drops to 1.86%.
One stat worth internalizing: segmented emails drive 50% more clickthroughs than unsegmented blasts. If you're sending the same email to your entire list, your CTR problem isn't your copy - it's your targeting.
Click-to-Open Rate (CTOR)
Formula: Unique clicks / Unique opens x 100
CTOR isolates content quality from deliverability. If your open rate is decent but CTOR is low, your subject line is doing its job but your email body isn't. Industry benchmarks from Designmodo show Advertising at 12.82% and Business & Finance at 10.15%. This metric is most useful when you're A/B testing email content - not subject lines, not send times, but the actual message.
Reply Rate
Formula: Replies / Emails delivered x 100
The average reply rate runs about 8.5%, and it's the most underused engagement metric in the space. For outbound sequences, reply rate tells you more about message-market fit than any other number. Most ESPs don't surface it prominently - you'll need to pull it from your sequencer (Outreach, Instantly, Lemlist) rather than your marketing platform.
If you're optimizing for replies, it also helps to use proven sales follow-up templates and keep your sequence management tight.
Bot Clicks Are Inflating Your CTR
Real talk: if you're not filtering bot clicks, your CTR is a lie.
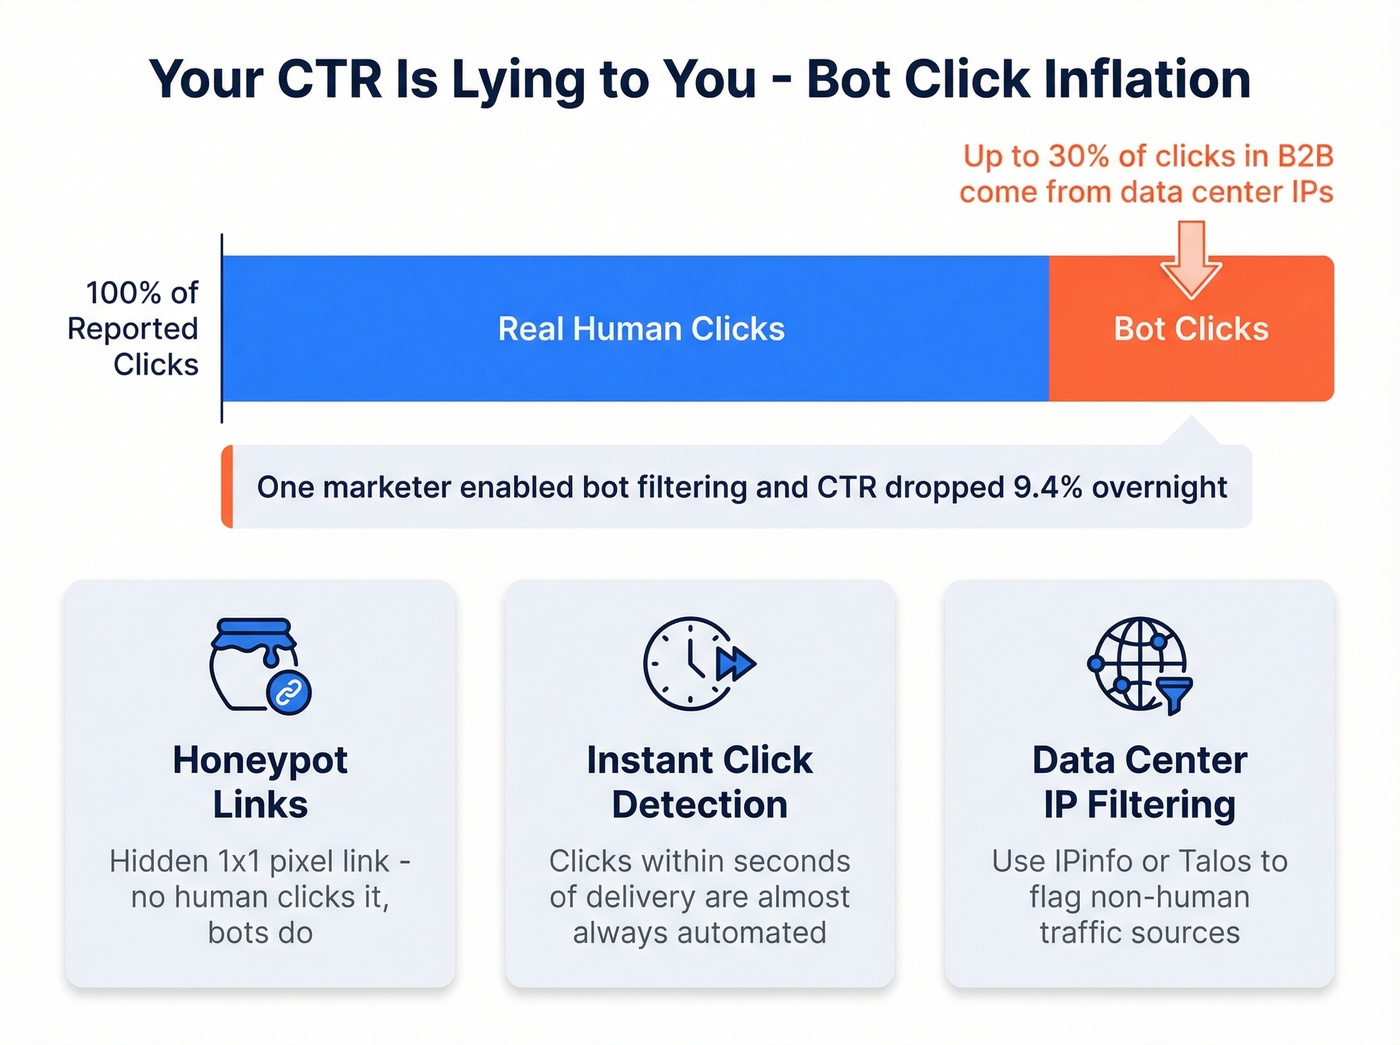
Corporate security tools scan every link in inbound emails before they reach the recipient's inbox. These automated clicks get counted as real engagement. One email marketer enabled Brevo's bot filtering and watched their CTR drop 9.4% overnight. That's nearly one in ten "clicks" being fake.
The problem is especially acute in B2B, where enterprise security stacks are more aggressive. We've seen lists where 15-30% of reported clicks came from data center IPs, not human beings.
How to detect bot clicks: Add a hidden "honeypot" link - a transparent 1x1 pixel link or a link styled to be invisible. No human would click it. If it gets clicks, you've got bots. Also watch for instant clicks within seconds of delivery and multiple links clicked simultaneously from the same IP. Tools like IPinfo and Talos help identify data center IPs in your click logs.
If you want to go deeper on measurement, use a dedicated tracking domain and sanity-check your event definitions with a clear click rate formula.
| ESP | Bot Filtering | Notes |
|---|---|---|
| ActiveCampaign | BotSense (Pro/Enterprise) | Reports only |
| Klaviyo | Built-in | Reports + attribution |
| HubSpot | Custom rules | IP/domain-based |
| Brevo | Optional toggle | 9.4% CTR drop reported |
| Beehiiv | Verified Clicks | Bot vs. legit split |
| Constant Contact | Default on | Limited customization |
Design your automations assuming bots will click. Require a click plus a page visit, or a click plus a form interaction, rather than firing a workflow off a single click event.
Bot clicks inflate your CTR. Bad data inflates your bounce rate. Prospeo's 5-step email verification and spam-trap removal deliver 98% accuracy - so the metrics you track actually reflect real human engagement, not noise.
Clean data in, clean metrics out. Start with emails that actually land.
Deliverability Metrics
Delivery Rate vs. Inbox Placement
These are two completely different metrics, and conflating them is one of the most common mistakes in email reporting.
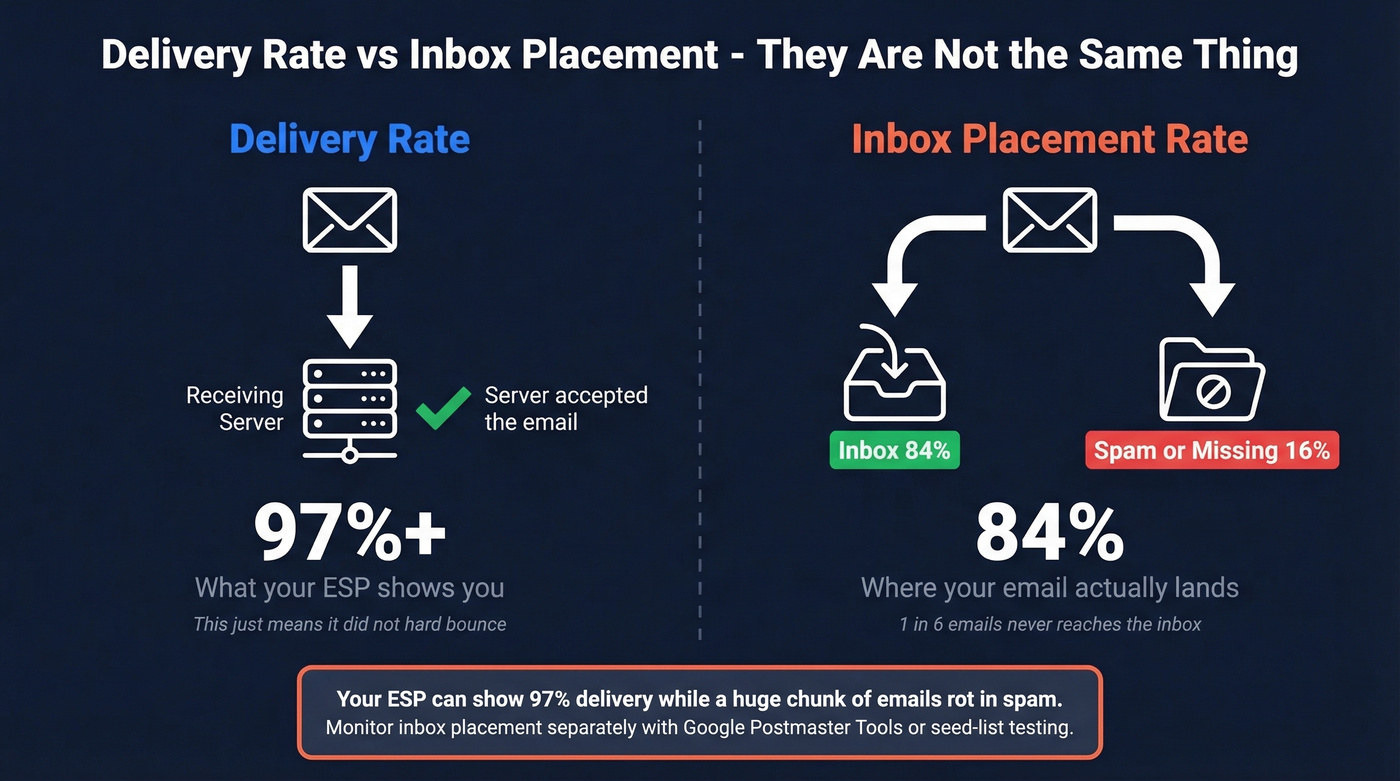
Delivery rate measures whether the receiving server accepted your email - it didn't hard bounce. Inbox placement measures whether it landed in the inbox versus spam or went missing entirely. Validity's benchmark data shows roughly 1 in 6 emails never reaches the inbox, with global inbox placement sitting around 84%. Unspam's testing across millions of emails paints an even bleaker picture: only 60% landed in the inbox, while 36% went to spam.
Your ESP might show a 97% delivery rate while a huge chunk of your emails rot in spam folders. If you're not monitoring inbox placement separately - through tools like Google Postmaster Tools or seed-list testing - you're flying blind.
If you need a deeper walkthrough, start with an email deliverability guide and keep an eye on email reputation tools.
Inbox Placement by Provider
Not all inboxes are created equal. The gap between providers is significant:
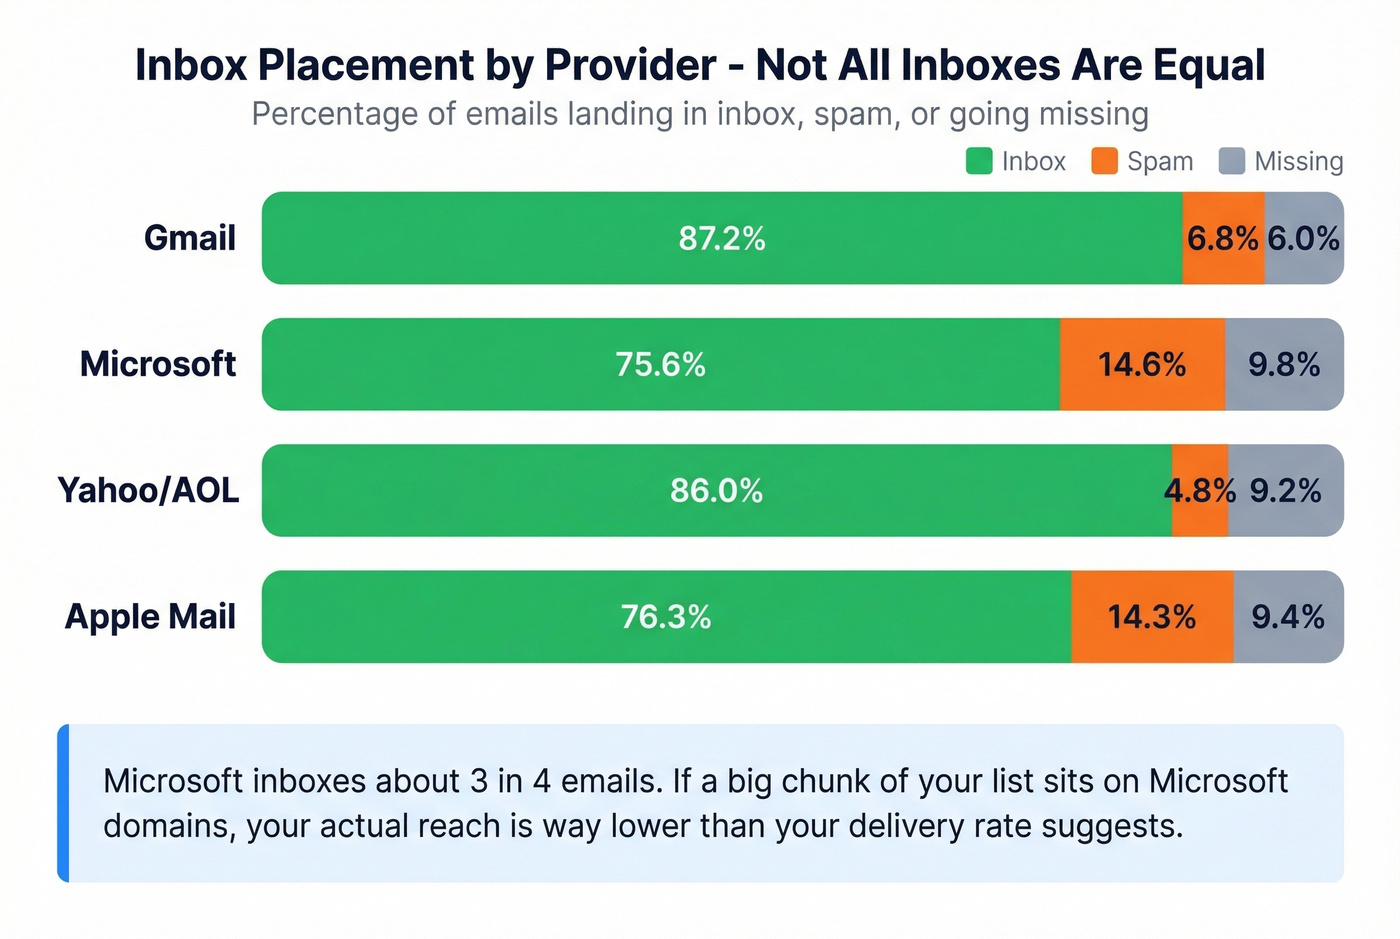
| Provider | Inbox | Spam | Missing |
|---|---|---|---|
| Gmail | 87.2% | 6.8% | 6.0% |
| Microsoft | 75.6% | 14.6% | 9.8% |
| Yahoo/AOL | 86.0% | 4.8% | 9.2% |
| Apple Mail | 76.3% | 14.3% | 9.4% |
Microsoft inboxes about 3 in 4 emails. Roughly 1 in 4 don't reach the inbox at all. If a big chunk of your list sits on Microsoft domains, your actual reach is significantly lower than your delivery rate suggests.
Bounce Rate and Spam Complaints
Hard bounces are permanent failures from invalid addresses. Soft bounces are temporary issues like a full inbox. Keep total bounce rate under 2% - anything higher signals list hygiene problems to mailbox providers.
Spam complaint rate is the metric that can kill your entire email program. Gmail and Yahoo enforce a hard 0.3% threshold for bulk senders. Three complaints per thousand emails. Exceed it consistently and your deliverability tanks across the board.
Even with full SPF, DKIM, and DMARC authentication, spam placement can exceed 30%. Authentication adoption is decent - SPF at 92%, DKIM at 88%, DMARC at 69% - but only 14% of senders implement a compliant List-Unsubscribe header. Authentication is baseline, not a guarantee.
If you're troubleshooting, use a dedicated email spam checker and fix list hygiene issues that drive email bounce rate.
High bounce rates destroy sender reputation. The fix starts before you hit send: verify every email address. Prospeo's 5-step verification process catches invalid addresses, spam traps, and honeypots before they tank your deliverability, with 98% email accuracy across 143M+ verified addresses.
Revenue and Conversion Metrics
Revenue Per Email Matters Most
Post-click conversion rate: Conversions / Clicks x 100
Revenue per email: Total revenue / Emails sent
Revenue per email is the number your CFO actually cares about. It varies by industry and business model, but tracking it forces you to connect email activity to pipeline or revenue - not just engagement proxies.
Look, if you're reporting open rates and CTR to leadership but not revenue per email, you're measuring activity instead of outcomes. Every email team should tie sends to dollars within 90 days. The teams that do will outperform the ones still celebrating "great open rates" that are 40% machine-generated.
Automation vs. Campaign Performance
This is the metric most marketers ignore, and it's arguably the most important insight in email marketing right now.
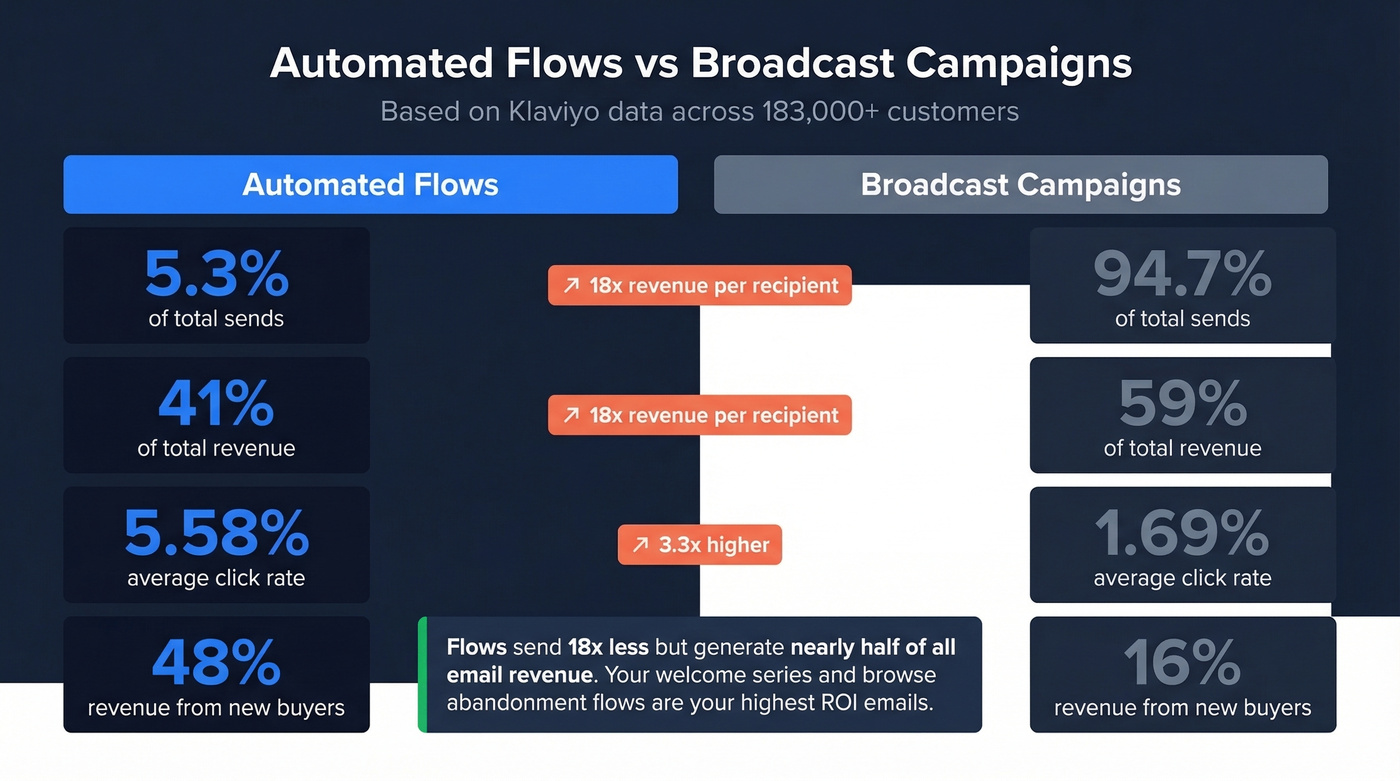
Klaviyo's data across 183,000+ customers tells a stark story: automated flows account for just 5.3% of total email sends but generate roughly 41% of total email revenue. That's an 18x higher revenue per recipient than campaigns. Flow click rates average 5.58% versus 1.69% for campaigns - more than 3x higher. Top 10% of automated flows hit click rates above 10% and revenue per recipient of $7.79.
About 48% of flow-driven revenue comes from new buyers, compared to just 16% for campaigns. Your welcome series and browse-abandonment flows aren't just nurturing existing customers - they're converting new ones at rates your broadcast campaigns can't touch.
AI product recommendations push these numbers further, lifting average click rates to 3.75% with top performers hitting 8.79%. If you're still sending the same campaign blast to your entire list while your automation flows sit half-built, you're leaving the highest-ROI channel in email underutilized.
List Health Metrics
List Growth and Unsubscribes
Net list growth: (New subscribers - Unsubscribes - Bounces) / Total list size x 100
A healthy unsubscribe rate falls in the 0.1-0.3% range for most industries. Ecommerce tends to run higher at 0.44%, while Education sits at a low 0.14%. If your unsub rate spikes after a specific send, that's a content or targeting signal - not a deliverability problem.
List growth rate matters because email lists decay naturally. People change jobs, abandon addresses, switch providers. If you're not growing faster than you're losing, your effective reach shrinks every month.
Gmail and Yahoo Enforcement
These aren't suggestions - they're hard requirements for anyone sending more than 5,000 emails per day to Gmail or Yahoo addresses:
- SPF, DKIM, and DMARC authentication - all three, properly configured
- One-click unsubscribe - functional, not buried behind a preference center
- Honor unsubscribes within 2 days
- Spam complaint rate under 0.3% - monitored via Google Postmaster Tools
Treat these as metric KPIs, not compliance checkboxes. Monitor them weekly.
If you're auditing your setup, validate your alignment and policy with DMARC alignment and confirm your DNS with real SPF record examples.
2026 Benchmarks by Industry
| Industry | Open Rate | CTR | Unsub | Bounce |
|---|---|---|---|---|
| Advertising | 25.48% | 3.29% | 0.35% | 8.99% |
| Energy/Utilities | 34.34% | 4.78% | 0.38% | 3.60% |
| Business/Finance | 33.18% | 3.36% | 0.28% | 4.64% |
| Ecommerce | 25.74% | 2.86% | 0.44% | 6.67% |
| Entertainment | 57.00% | 5.00% | 0.51% | 3.16% |
| Education | 35.91% | 3.10% | 0.14% | 0.31% |
| Healthcare | 33.99% | 2.52% | 0.20% | 0.44% |
| IT/Tech | 31.42% | 1.86% | 0.23% | 0.66% |
| Nonprofit | 40.39% | 3.46% | 0.10% | 0.41% |
| Retail | 29.10% | 2.04% | 0.18% | 0.31% |
Sources: Designmodo and Moosend, compiled from Mailchimp, Campaign Monitor, Klaviyo, and Litmus data.
Use these as directional guides, not absolute targets. Your list composition, send frequency, and content type matter more than industry averages.
How to Act on These Metrics
The biggest threat to your email performance isn't your subject line - it's your contact data. Here's the priority order:
Clean your data first. Run your list through a verification tool before every major send. Clean data is the prerequisite for every other optimization on this list. In our experience, teams that verify before sending cut bounce rates by 80%+ on day one.
Enable bot filtering on your ESP. Check the table above. If your platform offers it and you haven't turned it on, your engagement metrics are inflated. Accept the CTR drop - it's showing you reality.
Monitor inbox placement by provider. Set up Google Postmaster Tools for Gmail. Use seed-list testing for Microsoft and Yahoo. Your delivery rate is lying to you.
Replace open-triggered automations with click-based triggers. Any workflow that fires on an "open" event is triggering on machine activity 40% of the time. Rebuild those flows around clicks, page visits, or form submissions.
Track spam complaint rate weekly. Not monthly. The 0.3% threshold is unforgiving, and by the time you notice a monthly spike, the damage to your sender reputation is already done.
Check your links. One in 8 emails tested had broken or redirected links, which hurts both deliverability and click tracking accuracy. Apple's Link Tracking Protection also strips UTMs in Mail and Safari, so plan your attribution accordingly.
Skip step 6 if you're already using a link-monitoring tool - but steps 1-5 are non-negotiable for any team sending more than a few thousand emails per month.
You just read that exceeding 0.3% spam complaints craters deliverability. Teams using Prospeo's verified emails see bounce rates drop from 35%+ to under 4%. That's the difference between inbox placement and blacklists.
Stop guessing at deliverability. Start with data refreshed every 7 days.
FAQ
What's a good email open rate in 2026?
A typical cross-industry range is 20-35%, but Mail Privacy Protection inflates this number by roughly 40%. Use open rate as directional context within your own audience segments, not as a primary KPI. Entertainment hits 57% while IT/Tech averages 31.42%.
How do I detect bot clicks in my campaigns?
Add a hidden honeypot link - a transparent 1x1 pixel or invisible-styled link no human would click. If it registers clicks, you've got bot activity. Also watch for instant clicks within seconds of delivery and multiple links clicked simultaneously from data center IPs.
Which email metrics should I report to leadership?
Click-through rate (with bot filtering), inbox placement rate, and revenue per email. These three cover engagement, deliverability, and business impact. Open rate belongs in an appendix, not a headline slide.
How do I reduce my email bounce rate?
Verify every address before sending. Remove hard bounces immediately after every send and suppress addresses that soft-bounce three or more times consecutively. Keep total bounce rate under 2%.
Does email authentication guarantee inbox placement?
No. Even with full SPF, DKIM, and DMARC, spam placement can exceed 30%. Authentication is the baseline - content quality, HTML structure, sender reputation, and complaint rates all determine whether you reach the inbox.