Enterprise SaaS Churn Rate: What the Data Actually Says in 2026
A VP of Customer Success at a $40M ARR company spent an evening before a board meeting pulling churn numbers from three different analyst reports - 5%, 10%, 15% - none sourced, none segmented by deal size. She presented a range so wide it was meaningless.
The enterprise SaaS churn rate conversation is broken because nobody agrees on definitions, denominators, or segments. We dug into the actual data so you don't have to guess.
The Short Version
- Enterprise SaaS (>$100K ACV) runs about 0.7% monthly logo churn, compounding to roughly 8.1% annually, per an Optifai study of 939 companies.
- Track NRR (median 101%) and GRR (median 88%) instead of raw churn. They tell you whether the business is actually healthy.
- Enterprise churn is a relationship problem, not a product problem. Champion turnover kills more renewals than bad features ever will.
Why Most Churn Benchmarks Are Misleading
The core issue is definitional chaos. ServiceNow's SEC filings report ACV-based attrition, not logo churn. As Ordway Labs documents, companies make different "policy elections" for what counts as churn: revenue vs. customer count, voluntary vs. involuntary churn, cancellations vs. downgrades. Two companies with identical customer behavior can report wildly different numbers.
Then there's category mixing. Voluntary churn (relationship-driven) and involuntary churn (payment failures, billing errors) are fundamentally different problems requiring different solutions. Lumping them together is like averaging the temperature in Phoenix and Anchorage and calling it "the weather."
And the denominator problem? Dave Kellogg's ATR (Available to Renew) framework is the correct approach: you can't churn a customer whose contract isn't up for renewal. Most benchmark articles ignore this entirely, which inflates retention numbers and makes everyone feel better than they should.
Churn Benchmarks by ACV Band
This is the table most articles don't have. From Optifai's Pipeline Study (Q1-Q3 2025, N=939 companies):
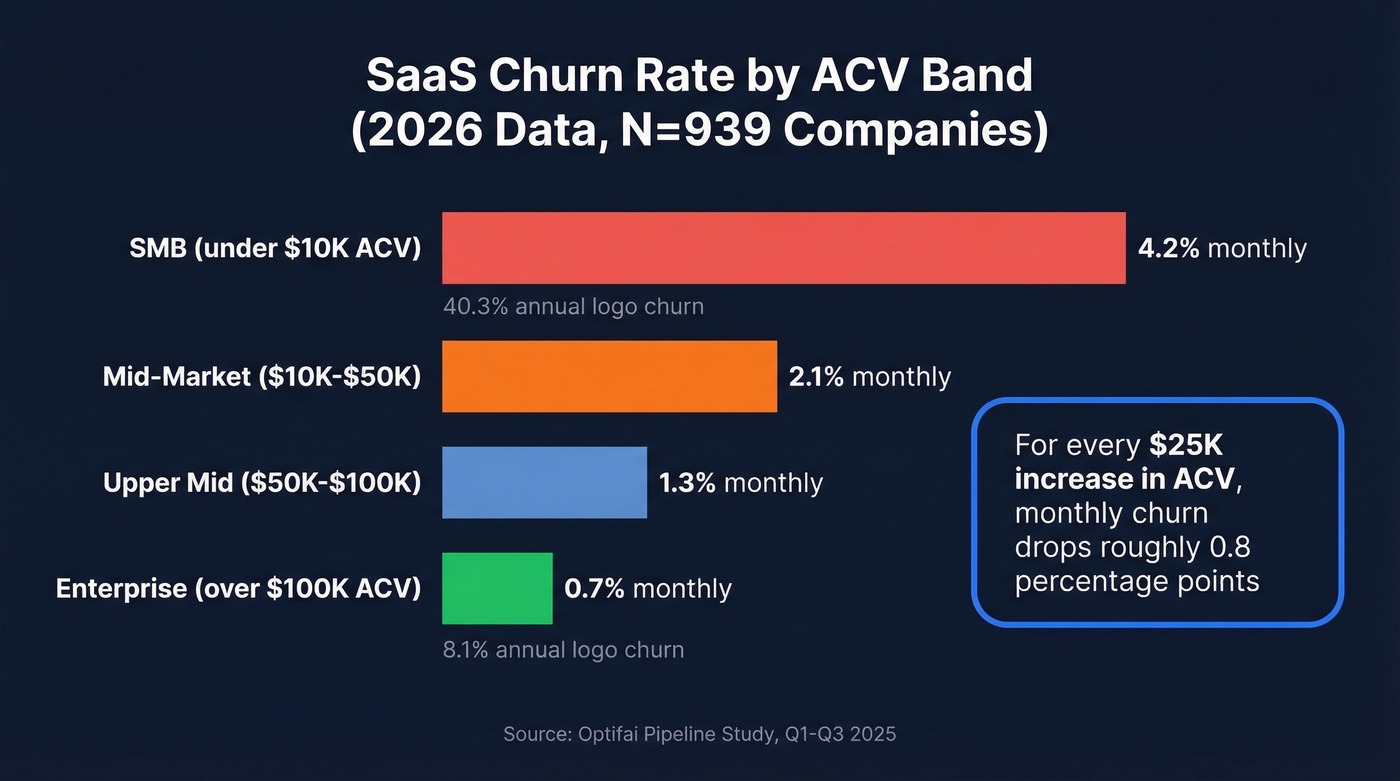
| ACV Segment | Mo. Logo Churn | Mo. Revenue Churn | Annual Logo Churn |
|---|---|---|---|
| SMB (<$10K) | 4.2% | 3.8% | 40.3% |
| Mid-Market ($10K-$50K) | 2.1% | - | - |
| Upper Mid ($50K-$100K) | 1.3% | - | - |
| Enterprise (>$100K) | 0.7% | 0.4% | 8.1% |
The spread is enormous. SMB attrition runs nearly 6x higher than enterprise on a monthly basis, and on average, for every $25K increase in ACV, monthly churn drops roughly 0.8 percentage points. That's not just because bigger customers are "stickier" - 85% of deals above $50K ACV are annual or multi-year contracts, which creates a structural retention floor that smaller deal sizes simply don't have. The enterprise line - 0.7% monthly, 8.1% annual - is your benchmark. Above that, you've got a problem worth diagnosing.
For a deeper breakdown of definitions and measurement, see our guide to churn analysis.
Champion turnover is the #1 enterprise churn driver - and it's preventable. Prospeo monitors job changes across 300M+ profiles on a 7-day refresh cycle, alerting your CS team the moment a stakeholder leaves.
Stop losing $150K accounts because nobody noticed your champion quit.
GRR and NRR Matter More Than Raw Churn
Raw churn rate is a blunt instrument. GRR (Gross Revenue Retention) and NRR (Net Revenue Retention) tell you far more.
If you need a refresher on what churn is (and the common formulas), start with what is churn.
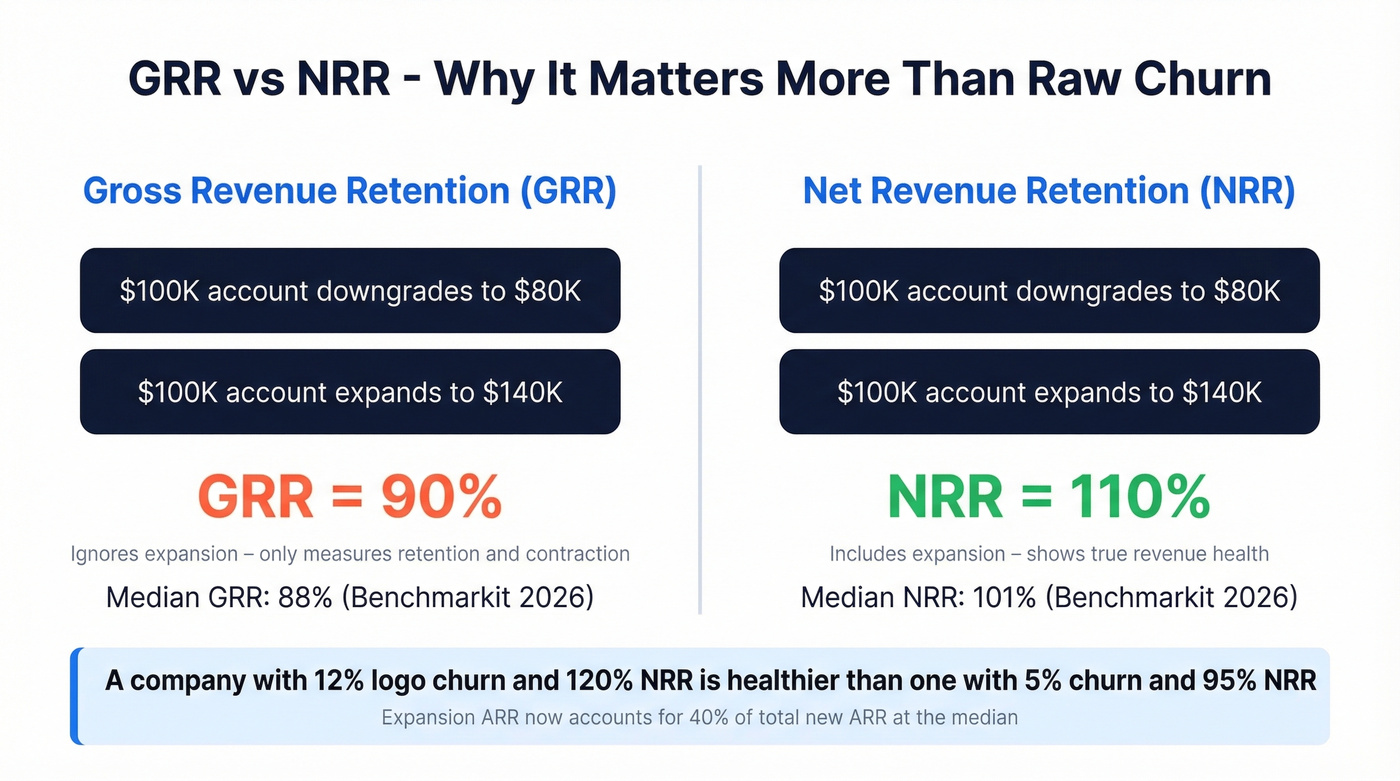
Benchmarkit's 2026 data puts median NRR at 101% and median GRR at 88%. GRR increases with ACV because larger accounts have lower downgrades and cancellations, creating a higher retention floor. Here's the simplest way to understand the distinction: if a $100K account downgrades to $80K but another expands from $100K to $140K, your GRR is 90% (ignoring expansion) while your NRR is 110% (including it). Expansion ARR now accounts for 40% of total new ARR at the median.
The KeyBanc/Sapphire annual survey adds useful context: gross retention declined to 86% in 2023 and is expected to approach the 90% threshold, while net retention remained above 100%. For public SaaS companies, median NRR sits around 108%, and top performers maintain 111%+.
Here's the thing: stop obsessing over churn rate and start obsessing over NRR. A company with 12% annual logo churn and 120% NRR is healthier than one with 5% churn and 95% NRR. The first company is growing through its existing base. The second is slowly bleeding out.
If you're aligning CS and RevOps around retention, it helps to standardize on a clear renewal rate definition too.
Why Enterprise Accounts Actually Churn
The internet is full of "improve onboarding" advice. That's SMB churn. Enterprise churn has different drivers, and they're almost entirely about relationships and organizational change.
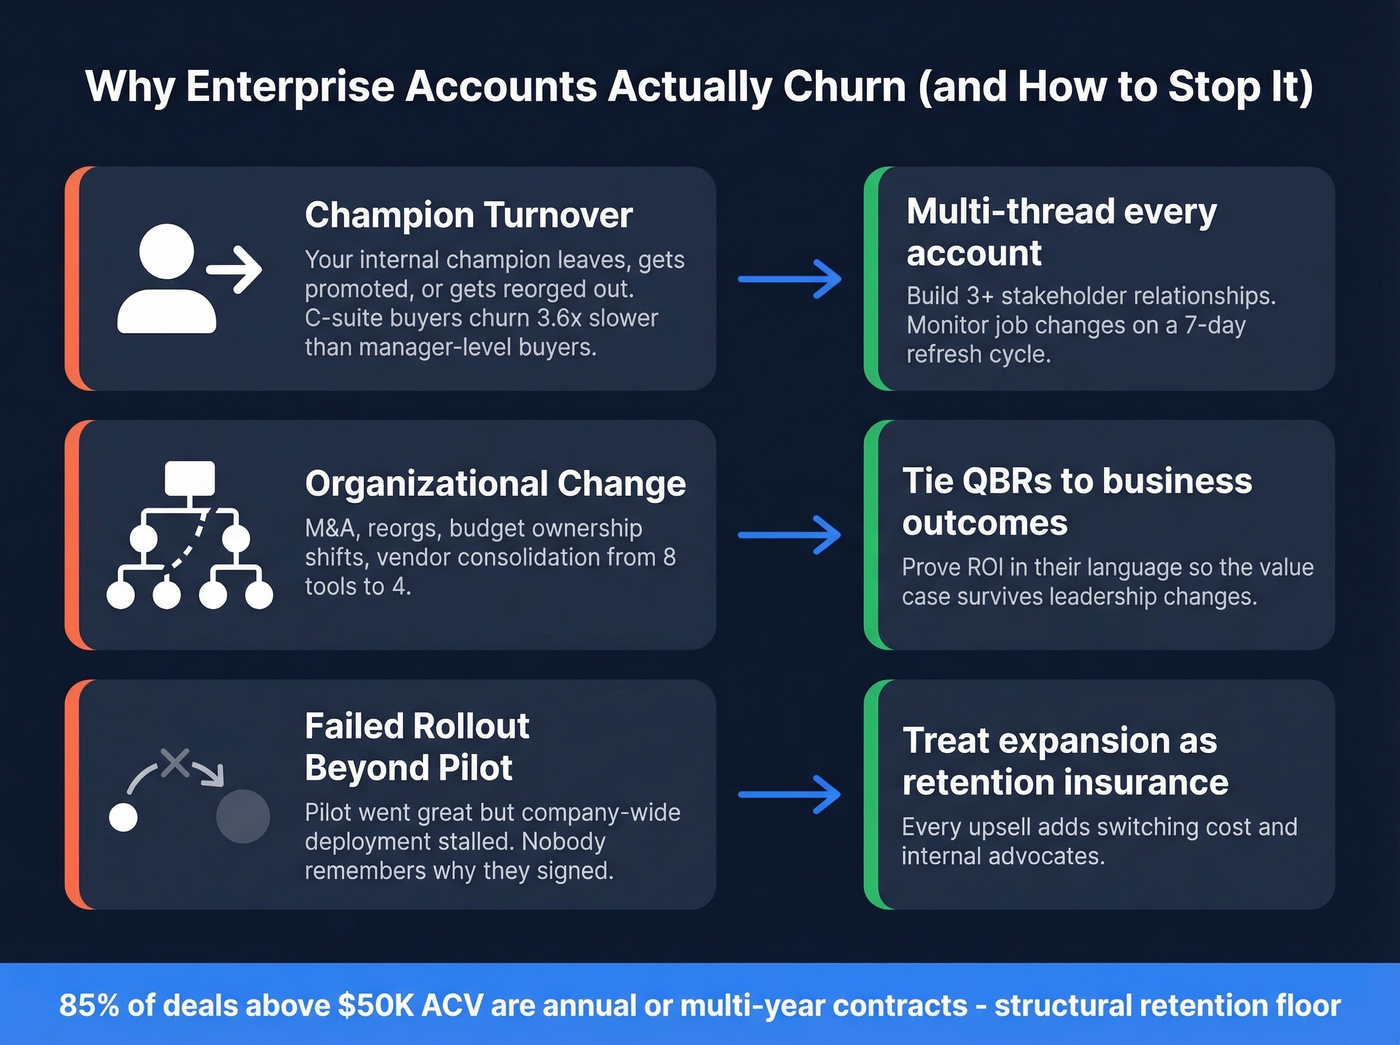
Champion Turnover
This is the #1 killer. Your internal champion gets promoted, leaves, or gets reorged out. The new VP has never heard of your product, and the renewal is in 90 days. Research on churn patterns across SaaS verticals found buyer seniority is a strong predictor of attrition: software bought by the C-suite churns 3.6x slower than tools bought by managers and ICs. We've seen it firsthand - accounts with great NPS scores churn because the one person who cared about the product moved to a different company.
This is also why account-based selling best practices (multi-threading, mapping stakeholders, and documenting value) matter more in enterprise than "activation" checklists.
Organizational Change
The other major drivers are predictable: failed rollouts beyond the initial team (the pilot went great, company-wide deployment stalled), M&A or re-orgs that change budget ownership, and procurement-driven vendor consolidation where finance mandates cutting from eight tools to four. We've watched accounts with strong satisfaction scores churn because nobody in the buying committee remembered why they signed in the first place.
If you're building a repeatable enterprise motion, our enterprise B2B sales guide covers how to structure stakeholders, champions, and renewal paths.
Churn and Unit Economics
The financial pain of enterprise churn is disproportionate to the rate.
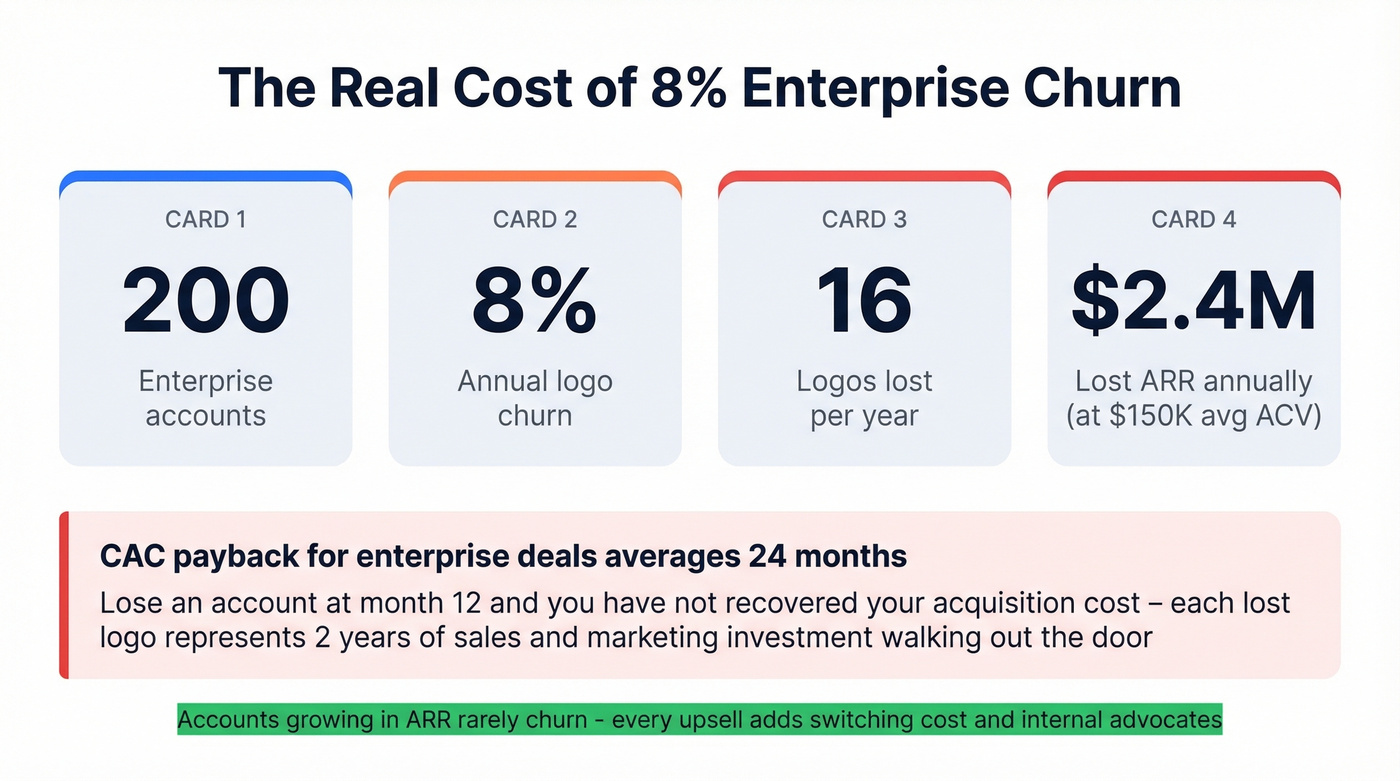
CAC payback for >$50K ACV deals averages 24 months. Lose an enterprise account at month 12, and you haven't recovered your acquisition cost. That 0.7% monthly figure looks small until you realize each lost logo represents two years of sales and marketing investment walking out the door. For a company with 200 enterprise accounts, 8% annual churn means 16 logos gone - and if average ACV is $150K, that's $2.4M in lost ARR before you factor in the sunk acquisition costs.
To pressure-test the math, use a consistent cost to acquire customer model alongside retention.
How to Reduce Enterprise Churn
The single most impactful move is multi-threading every account. Three or more stakeholder relationships is the minimum. If your entire renewal depends on one champion, you're one job change away from losing the deal.
That means tracking champion job changes proactively. Prospeo monitors job changes across 300M+ professional profiles on a 7-day refresh cycle, so your CS team knows the moment a contact moves and can identify the replacement before the renewal conversation starts.
Beyond multi-threading, run QBRs tied to business outcomes, not feature usage. Nobody renews because you showed them a dashboard of logins. They renew because you proved ROI in their language.
If you want to systematize those meetings, use these QBR questions to ask to keep reviews outcome-driven.
Treat expansion as retention insurance. Accounts growing in ARR rarely churn, because every upsell adds switching cost and internal advocates. The consensus on r/SaaS and r/CustomerSuccess backs this up - teams that tie CS comp to expansion, not just retention, consistently report lower churn.
And if your CRM data is stale? Skip the fancy churn prediction models. You can't save an account if you're emailing someone who left six months ago. Clean contact data is the unsexy foundation everything else depends on.
If you're rebuilding your process around cleaner records, start with best contact management software to keep stakeholders current.
Multi-threading requires knowing who's actually at the account right now - not six weeks ago. Prospeo's 7-day data refresh and 98% email accuracy give your CS team verified contacts for every stakeholder in the buying committee, before renewal season hits.
Build three-deep relationships at every enterprise account starting today.
FAQ
What's a good enterprise SaaS churn rate?
Below 1% monthly logo churn - or under 10% annually - for deals above $100K ACV. GRR above 90% and NRR above 110% are more meaningful benchmarks than raw churn alone, since expansion revenue can mask or offset logo losses.
How do you calculate SaaS churn rate accurately?
Use Available to Renew (ATR) as the denominator, not total ARR, to exclude multi-year contracts not up for renewal. Track logo churn and revenue churn separately on a cohort basis - blending them hides whether you're losing many small accounts or a few large ones.
Why is enterprise churn lower than SMB churn?
Enterprise deals average 0.7% monthly churn vs. 4.2% for SMB because 85% of contracts above $50K ACV are annual or multi-year, creating a structural retention floor. Larger accounts also receive dedicated CSMs and deeper integrations that raise switching costs significantly.
How can I detect at-risk enterprise accounts early?
Track champion job changes, declining product usage, and missed QBR attendance. Job change monitoring tools can flag contact departures within days, giving CS teams a 60-90 day head start on re-engaging accounts before renewal conversations begin.