The Only Google Sheets Sales Funnel Template You Need
Most free templates make you fill out a form, email you a spreadsheet with zero instructions, and leave you staring at 14 empty columns. The consensus on r/sales and r/smallbusiness tells the same story: people want simpler spreadsheet-based CRMs, but templates without explanations create confusion and endless "how do I use this?" questions.
Here's a single template structure with copy-paste formulas, stage benchmarks, and a setup walkthrough you can finish in 10 minutes.
What Your Funnel Template Actually Needs
We've seen pipelines with dozens of columns - nobody fills them in. We've also seen templates with just deal name and amount, which tell you nothing useful. Every column should either help you prioritize or help you follow up. If it doesn't do one of those two things, cut it.
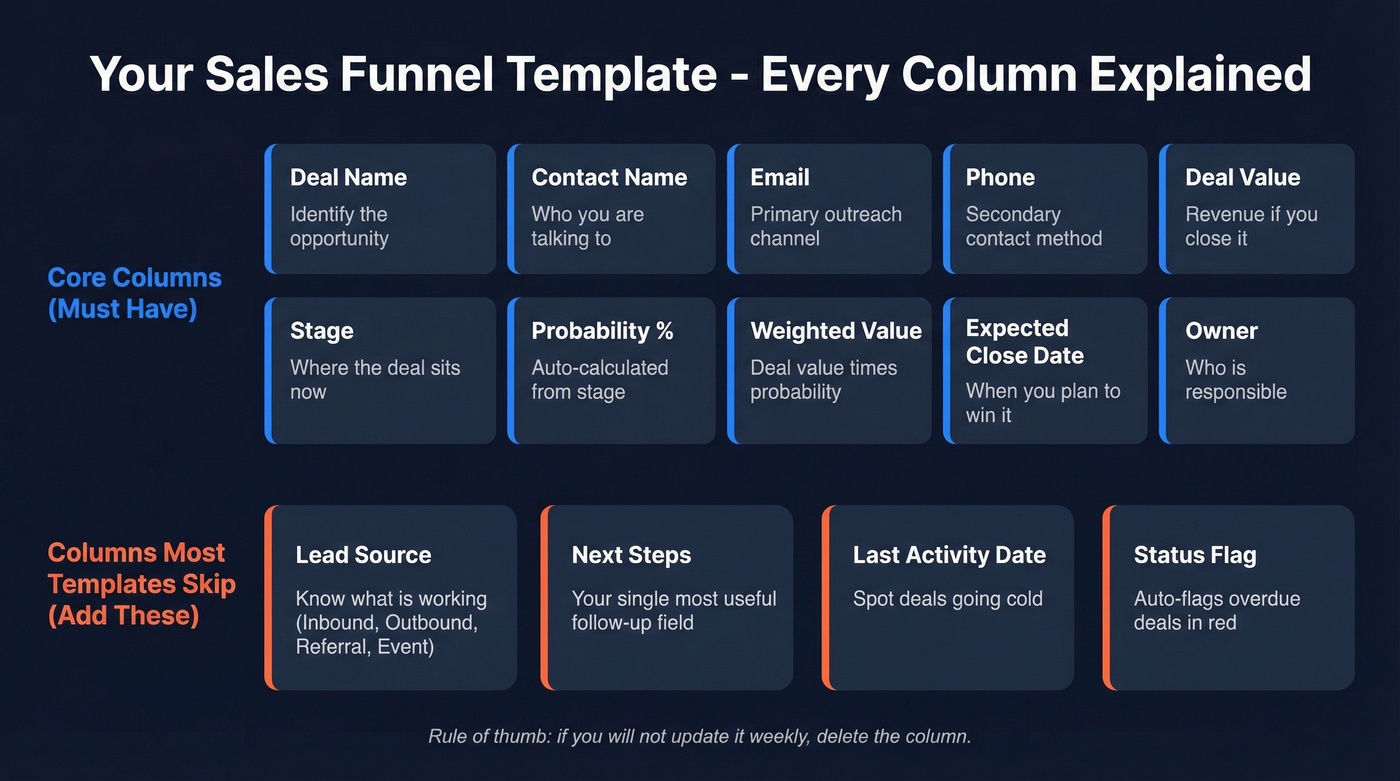
Core columns: Deal Name, Contact Name, Email, Phone, Deal Value, Stage (dropdown), Probability %, Weighted Value, Expected Close Date, Owner.
Columns most templates skip but you'll want: Lead Source, Next Steps (a brutally useful follow-up field), Last Activity Date, and a Status Flag for overdue deals. One Reddit user running a small law practice put it well - they needed to track initial contact, scheduling, whether the prospect showed, and the ability to filter out "duds." That's the right mindset. Skip anything you won't update weekly. An empty column is worse than a missing one because it trains your team to ignore the sheet entirely.
If you want a more complete stage-by-stage structure (with benchmarks), compare this to a B2B sales funnel template before you lock in your columns.
Set Up Your Sales Funnel Spreadsheet Step by Step
Create the Sheet and Add Dropdowns
Make a copy of the template here - then customize it using the steps below.
- Open the template or a new Google Sheet. Name the first tab "Pipeline" and add your column headers across row 1.
- Select the entire Stage column. Go to Data > Data validation > Dropdown and enter your stages as list items.
- Do the same for Lead Source (Inbound, Outbound, Referral, Event) and Status (Active, On Hold, Closed Won, Closed Lost).
Dropdowns prevent typos and make filtering reliable. In our experience, teams that skip this step end up with "Demo," "demo," and "Demo Call" as three separate stages within a month. That alone wrecks your conversion reporting.
Customize Stages for Your Business
Don't copy someone else's stages blindly. Pick the map that matches your actual sales motion:

- SaaS: Lead > Qualified > Demo > Proposal > Negotiation > Closed Won / Lost
- B2B services: Inquiry > Discovery Call > Proposal Sent > Contract Review > Closed Won / Lost
- Ecommerce / short cycles: New Lead > Engaged > Cart/Quote > Purchased > Repeat Buyer
If your team struggles with qualification, it helps to standardize definitions (and fields) using a simple lead scoring model.
Add or remove stages only when you need to diagnose a specific bottleneck. More than eight stages usually means reps stop updating the sheet.
Four Formulas That Make It Work
These turn a static spreadsheet into something that actually tells you what's happening.
1. Auto-probability by stage. Let the stage drive probability instead of typing it manually:
=IF(E2="Lead",0.1,IF(E2="Qualified",0.25,IF(E2="Demo",0.5,IF(E2="Negotiation",0.75,IF(E2="Closed Won",1,0)))))
Adjust percentages to match your historical win rates.
2. Weighted pipeline value. This is the number your forecast depends on:
=D2*F2
If you want to go beyond weighted value, you’ll eventually want a lightweight sales forecasting solution (or at least a consistent forecasting method).
3. Overdue deal flag. Deals sitting past their expected close date are pipeline rot:
=IF(AND(G2<TODAY(), E2<>"Closed Won", E2<>"Closed Lost"), "OVERDUE", "")
4. Monthly forecast. Pull weighted values for the current month:
=SUMIFS(H2:H500, G2:G500, ">="&EOMONTH(TODAY(),-1)+1, G2:G500, "<"&EOMONTH(TODAY(),0)+1)
One more worth tracking - pipeline velocity: (Opportunities x Avg Deal Value x Win Rate) / Sales Cycle Length. Monitor it monthly. If velocity drops, something's clogging.
If you’re not sure which KPIs to prioritize, use a simple funnel metrics checklist so you don’t over-instrument the sheet.
Benchmark Your Funnel Stages
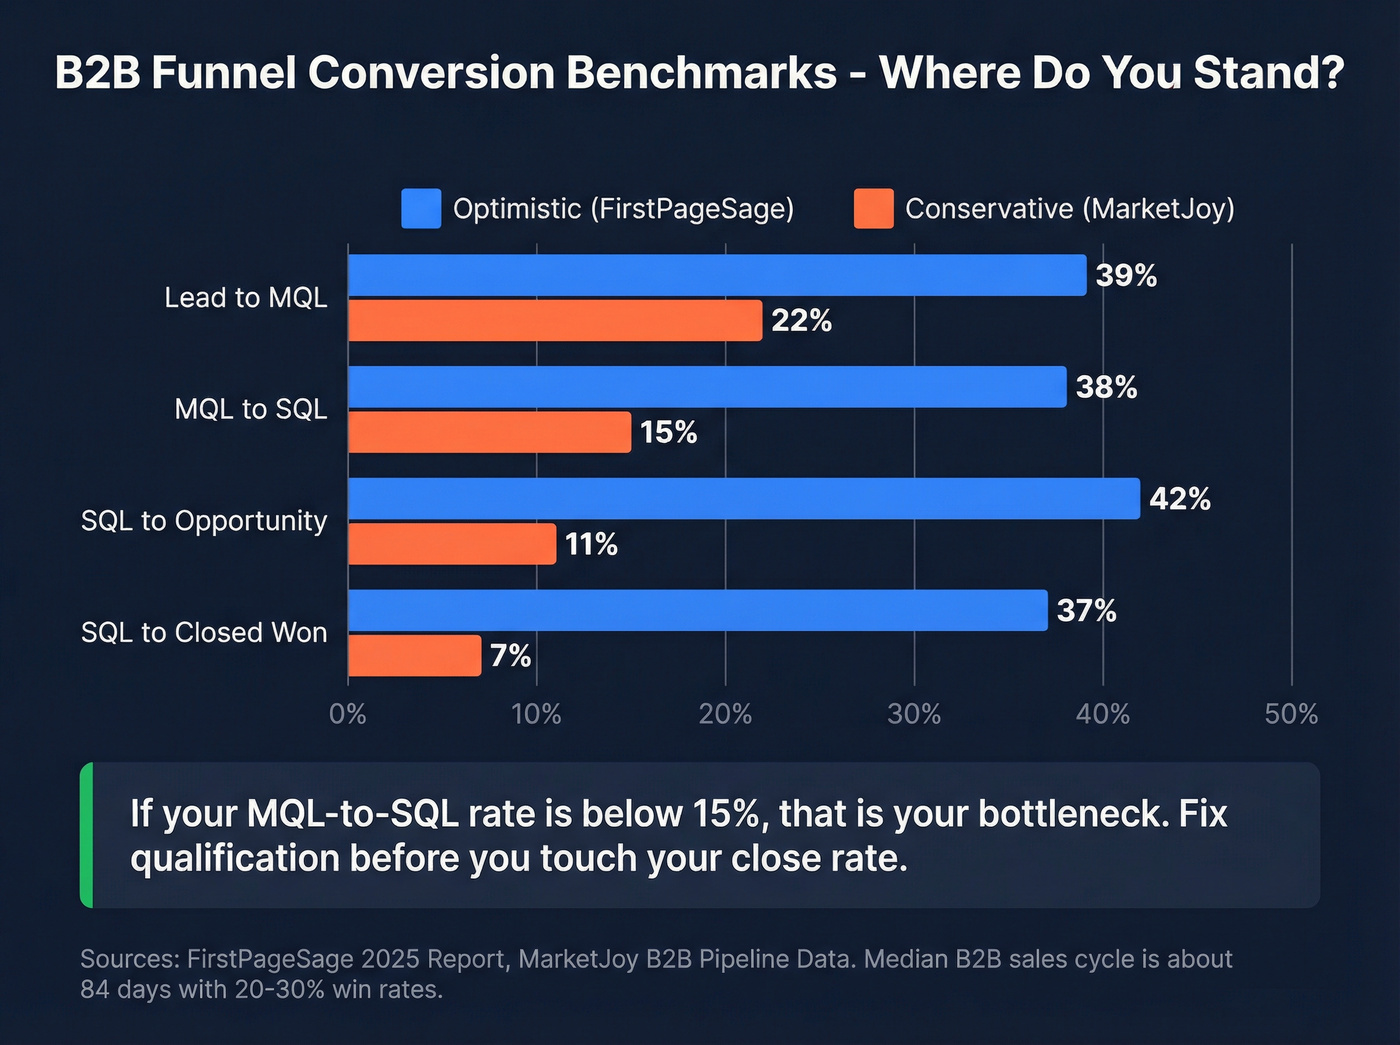
A template without benchmarks is just a data entry exercise. Here's what "normal" looks like across two data sets:
| Stage | Optimistic (FirstPageSage) | Conservative (MarketJoy) |
|---|---|---|
| Lead to MQL | 39% | 22% |
| MQL to SQL | 38% | 15% |
| SQL to Opp | 42% | 11% |
| SQL to Closed | 37% | 7% |
FirstPageSage measures SQL-to-Closed; MarketJoy measures Opportunity-to-Closed-Won. Definitions vary, which explains the spread.
FirstPageSage's benchmarks skew toward well-optimized SaaS funnels. MarketJoy's numbers reflect broader B2B reality. Median B2B sales cycle sits around 84 days, with typical win rates in the 20-30% range.
Here's the thing: if your MQL-to-SQL rate is below 15%, that's your bottleneck. Don't touch your close rate until you fix qualification. Most teams obsess over the bottom of the funnel when the real leak is at the top.
If you’re seeing inconsistent stage movement, it’s usually one of these common sales pipeline challenges (not a “bad template” problem).
Your funnel's top-of-pipe leak isn't a stage problem - it's a data problem. If your MQL-to-SQL rate looks low, bad emails are inflating the denominator. Prospeo's 300M+ profiles with 98% email accuracy mean every row in your spreadsheet is a real person you can actually reach.
Stop building funnels on bad data. Verify before you prospect.
Populate Your Funnel With Real Data
The template is ready. Now you need contacts in it.
Google Forms or Typeform piped through Zapier into your Sheet is the simplest automation path. Zapier has 2,000+ connections to Google Sheets, so most tools in your stack can push data automatically. MarketJoy's data shows contacting leads within 24 hours increases conversion by 5x - another reason to get clean data into your sheet fast.
But there's a data quality problem hiding underneath. If 20% of your emails bounce, your conversion rates are fiction. Every "Lead to MQL" percentage gets inflated by contacts who never received your first email. We've watched teams celebrate a 30% MQL rate that was really 24% once you stripped out the bounces and dead addresses. Prospeo's email verification catches invalid addresses before they enter your sheet - 98% accuracy, with a free tier of 75 verifications per month. That's enough to validate a solid initial pipeline without spending a dime.
If you’re building lists from scratch, start with a few sales prospecting techniques that fit your motion, then standardize how you capture source and intent.
If you’re prospecting via email, keep an eye on email bounce rate so your funnel math doesn’t lie to you.
You just built a pipeline tracker with weighted values and overdue flags. Now populate it with contacts that convert. Prospeo gives you 30+ filters - buyer intent, technographics, headcount growth - so every lead entering row 2 is already qualified. At $0.01 per email, filling your sheet costs less than your morning coffee.
Fill your funnel template with leads that actually pick up the phone.
When to Ditch the Spreadsheet
Google Sheets works until it doesn't. Signs you've outgrown it:
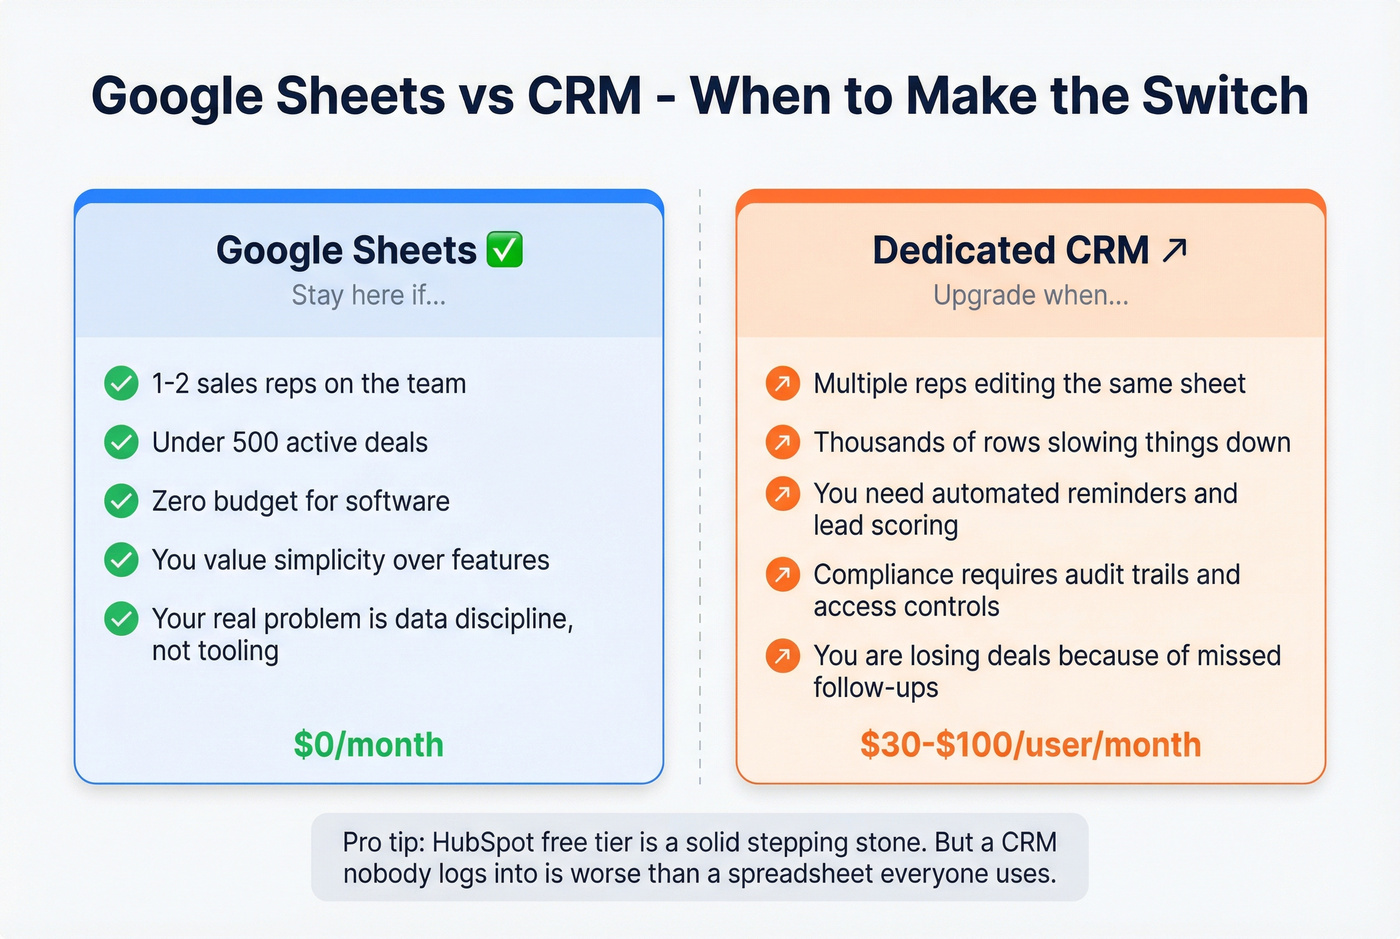
- Multiple reps sharing one sheet - permissions get messy and process breaks down fast when three people are editing the same row
- Thousands of rows - performance degrades with complex formulas, filters, and queries once you pass a few thousand active deals
- You need automated reminders, lead scoring, or audit trails - Sheets isn't built for that
- Compliance matters - access controls and auditing are limited compared to dedicated CRMs
A dedicated CRM runs $30-$100/user/month. HubSpot's free tier is a solid stepping stone. But for solo founders and small teams under 500 deals, the spreadsheet is genuinely fine - and I'd argue it's better than a CRM nobody logs into. Skip the CRM upgrade if your real problem is data discipline, not tooling.
If you do decide to upgrade, it helps to understand the examples of a CRM (and what you actually get for the price).
Quick Funnel Visualization Tip
Google Sheets doesn't have a native funnel chart, but you can fake one with a stacked bar chart. Add a helper column next to your stage counts:
=(MAX($C$2:$C$7)-C2)/2
This creates transparent "spacer" bars that center your data bars into a funnel shape. Select both columns, insert a stacked bar chart, and make the spacer series transparent. Five minutes, way more polished pipeline reviews.
For inline sparklines next to each stage, try =SPARKLINE(B2,{"charttype","bar";"max",max($B$2:$B$7)}) in a cell. It gives you a mini bar chart without leaving the data tab.
If your sheet is mostly about staying on top of next actions, keep a few proven sales follow-up templates handy so reps don’t stall after “Demo” or “Proposal.”
Google Sheets Sales Funnel Template FAQ
What's the difference between a sales funnel and a sales pipeline?
A funnel tracks the buyer's journey from awareness to purchase; a pipeline tracks your deals from first contact to close. Most Google Sheets templates combine both - tracking deal stages (pipeline) while measuring conversion rates between them (funnel). Don't overthink the distinction. Pick one sheet and use it consistently.
How many stages should my sales funnel have?
Five to seven works for most B2B funnels: Lead, Qualified, Demo/Meeting, Proposal, Negotiation, Closed Won, Closed Lost. Start with five and add stages only when you need to diagnose a specific bottleneck.
Can Google Sheets replace a CRM?
For one to two reps tracking under 500 active deals, yes. Sheets handles basic pipeline tracking, follow-up notes, and reporting with zero subscription cost. Above that threshold - or when you need automated reminders, lead scoring, and audit trails - a CRM like HubSpot's free tier or Salesforce is worth the switch.
How do I keep my funnel data accurate?
Verify contact data before importing. Bad emails inflate every metric downstream. Set a weekly review cadence to update stale deals, archive closed-lost records, and flag overdue follow-ups using the overdue formula above. Let's be honest - the biggest threat to your funnel isn't the wrong formula. It's stale data that nobody cleans up.