GTM Performance: The 2026 Guide to Go-to-Market Metrics & Tag Manager Speed
98% of GTM leaders say their strategy is being executed. Only 10% say it's actually effective. That's not a strategy problem - it's an execution problem wearing a strategy costume. Whether your GTM performance challenge is anemic pipeline metrics or a Google Tag Manager container dragging page speed into the gutter, the root cause is the same: you're measuring the wrong things, or measuring the right things with bad data.
The Quick Version
- Go-to-market: Track pipeline coverage, win rate, and NRR above all else. Segmented benchmarks below.
- Google Tag Manager: Your empty container isn't the problem. Your tags and DOM manipulation are. Checklist inside.
- Both problems share a root cause: bad data. Fix that first, and downstream metrics improve on their own.
GTM Performance in 2026
The B2B Institute's 95-5 Rule frames the challenge well: 95% of potential buyers are out-of-market at any given time. Only 5% are actively shopping. Most of your go-to-market motion is either building brand for the 95% or fighting over the 5% with increasingly expensive tactics.
The numbers reflect this tension. AE quota attainment was 58% in 2025 per ICONIQ's annual report, and it's slipped further - down to 43% in 2026 estimates. Meanwhile, 80% of GTM leaders report signs of burnout or regretted attrition on their teams. Reps are working harder and closing fewer deals. G2 benchmarks show leads from AI search convert 40% better than traditional search - another signal that channels are shifting fast and teams clinging to old playbooks are falling behind.
Here's where it gets interesting. AI-native companies at $100M+ ARR convert free trials and POCs at 56%, compared to 32% for everyone else. Top sellers close deals 3x faster and generate 11x more revenue per day than their peers. The gap between high-performing and average teams isn't narrowing. It's accelerating. The differentiator isn't strategy decks - it's execution velocity powered by clean data and tight feedback loops.
Our take: Most teams don't have a strategy problem. They have a speed problem. The companies winning right now aren't smarter - they iterate weekly while everyone else reviews quarterly.
The Metrics That Actually Matter
You've probably seen lists of 25+ go-to-market metrics. Nobody tracks 25 metrics well. Here are the ones that actually predict revenue outcomes, segmented by stage and motion.
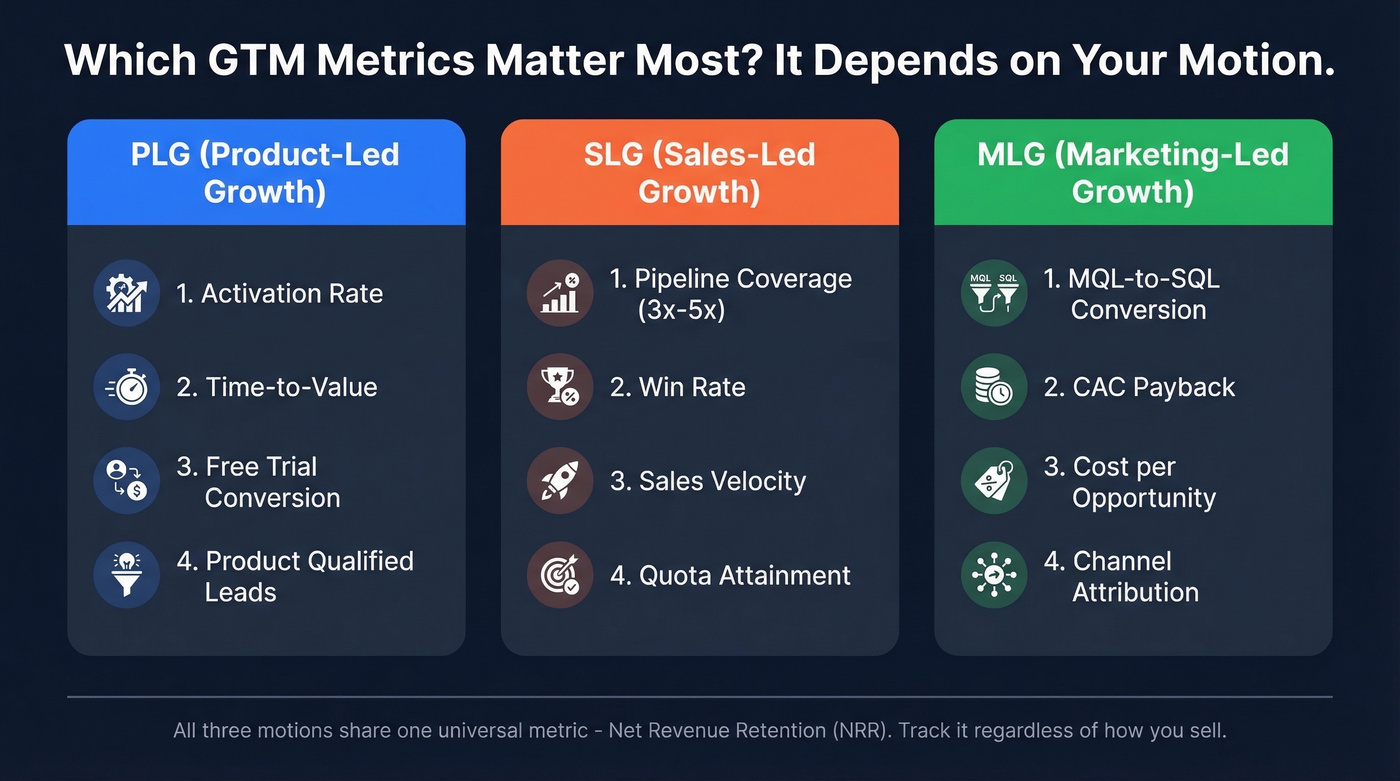
PLG teams should prioritize activation rate and time-to-value over pipeline coverage. SLG teams live and die by pipeline coverage and win rate. MLG teams need to watch MQL-to-SQL conversion and CAC payback obsessively. The benchmarks below are B2B SaaS - weight them based on how you sell.
Pipeline & Revenue
| Metric | Enterprise | Mid-Market | SMB |
|---|---|---|---|
| Pipeline Coverage | 3x-5x | 2.5x-4x | 2x-3x |
| Net-New ARR (% of total) | 30-40% | 35-45% | 40-50% |
| Expansion Revenue | 40-60% of new ARR | 25-40% | 15-25% |
Pipeline coverage is the single most diagnostic metric. Below 2x, your lead gen or qualification is broken. Above 5x, you've got a bloated pipeline full of zombie deals that'll never close. The sweet spot depends on your win rate - higher win rates let you run leaner coverage.
Net-new ARR should represent 30-50% of overall ARR growth for healthy SaaS companies in the $10M-$100M range. If it's higher, you're not retaining enough. Lower, and your new business engine is stalling. Beyond $50M ARR, 60% of new ARR typically comes from existing customers, which is why expansion revenue deserves its own line in your dashboard.
Sales velocity ties it all together:
(Qualified Opps x Average Deal Size x Win Rate) / Sales Cycle Length
Example: 100 qualified opps x $50K ACV x 30% win rate / 4 months = $375K/month velocity
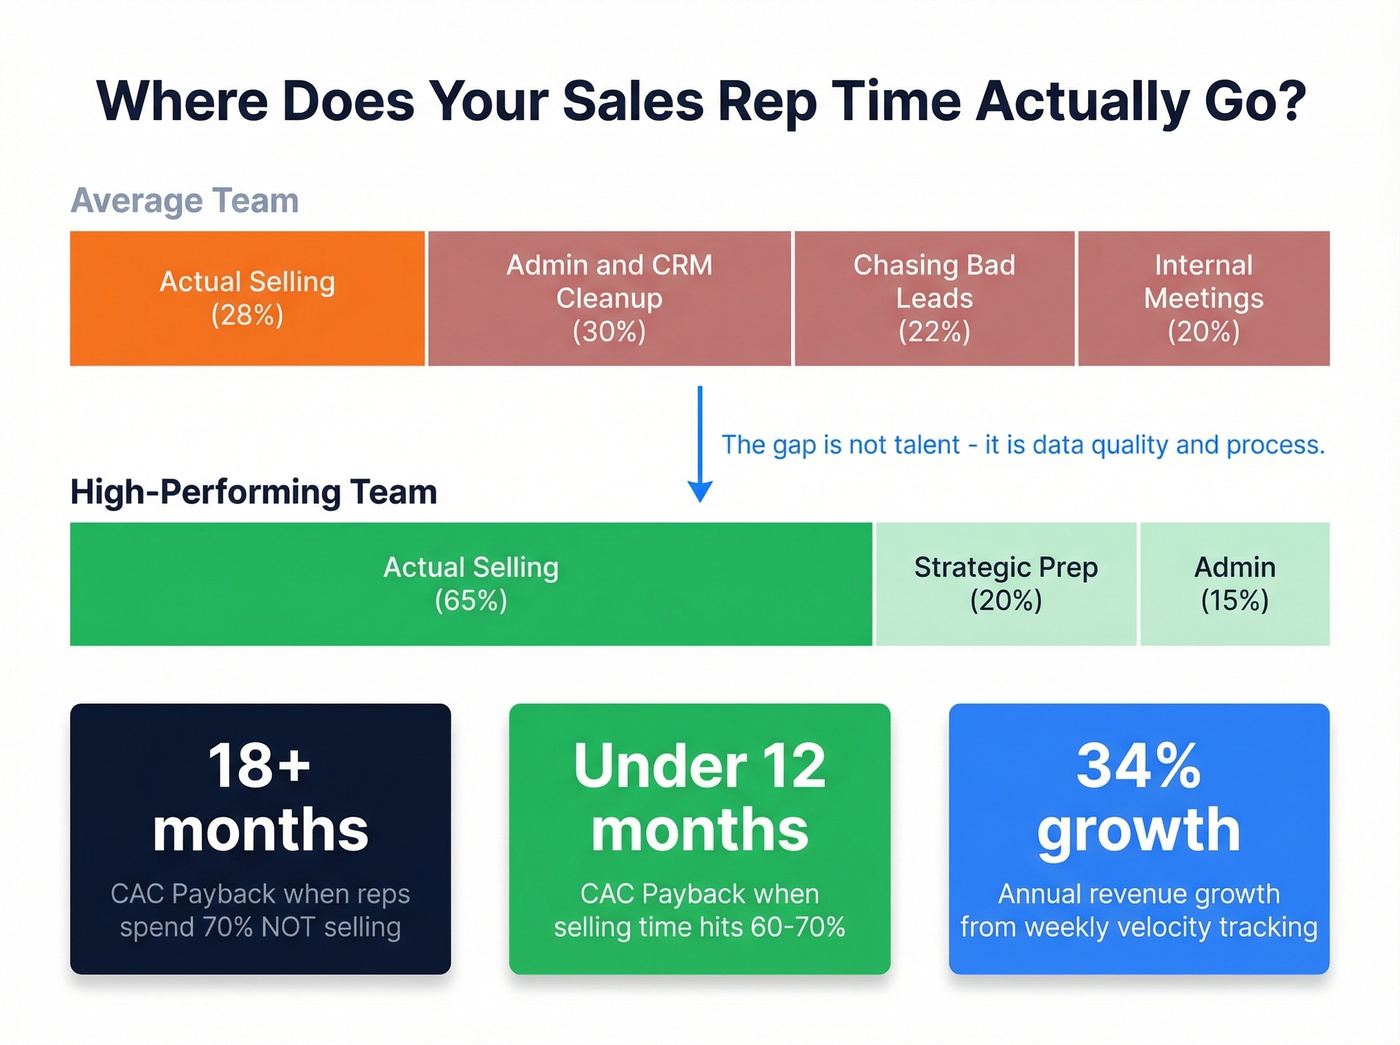
We've seen teams that track this weekly achieve 34% annual revenue growth versus 11% for those reviewing it less frequently. If you only add one metric to your weekly review, make it this one.
Efficiency
Here's where most teams fool themselves. The numbers look fine in aggregate, but the underlying efficiency is terrible.
| Signal | 🟢 Healthy | 🔴 Red Flag |
|---|---|---|
| CAC Payback | Under 12 months | Over 18 months |
| LTV:CAC | 3:1 to 5:1 | Below 3:1 (overspending) or above 5:1 (under-investing) |
| Quota Attainment | 55-65% (Enterprise), 50-60% (Mid-Market) | Below 45% at any segment |
| Selling Time | 60-70% of rep hours | Under 30% (the industry average) |
CAC payback is the metric your CFO cares about most. The heuristic that works: keep CAC below one-third of first-year ACV.
Sales capacity utilization is the hidden killer. Typical reps spend 28-30% of their time actually selling - the rest gets eaten by admin, bad data cleanup, and chasing prospects who were never real. High-performing teams push selling time to 60-70%. We've watched CAC payback stretch past 18 months at companies where reps spend more time cleaning CRM records than making calls.
SMB quota attainment runs lower (45-55%) than mid-market despite shorter sales cycles. Higher rep turnover and thinner enablement infrastructure are the usual culprits.
Retention
Skip this if you're pre-$5M ARR - you don't have enough data for these to be meaningful yet.
NRR above 100% means your existing customers are growing. Hybrid pricing models show the highest retention at ~105% NRR. Buying committees now average 7.2 stakeholders, so multi-threading isn't optional if you want to protect expansion revenue.
GRR below 85% is a red flag. You're losing too many logos, and no amount of expansion will paper over the churn.
Three Mistakes That Kill GTM Performance
Building before validating how you'll sell. The consensus on r/SaaS is clear: teams skip the hard work of defining ICP, buying triggers, and the "why now" before they start building pipeline. Without those, you're generating leads that never convert and your CAC payback stretches to infinity.
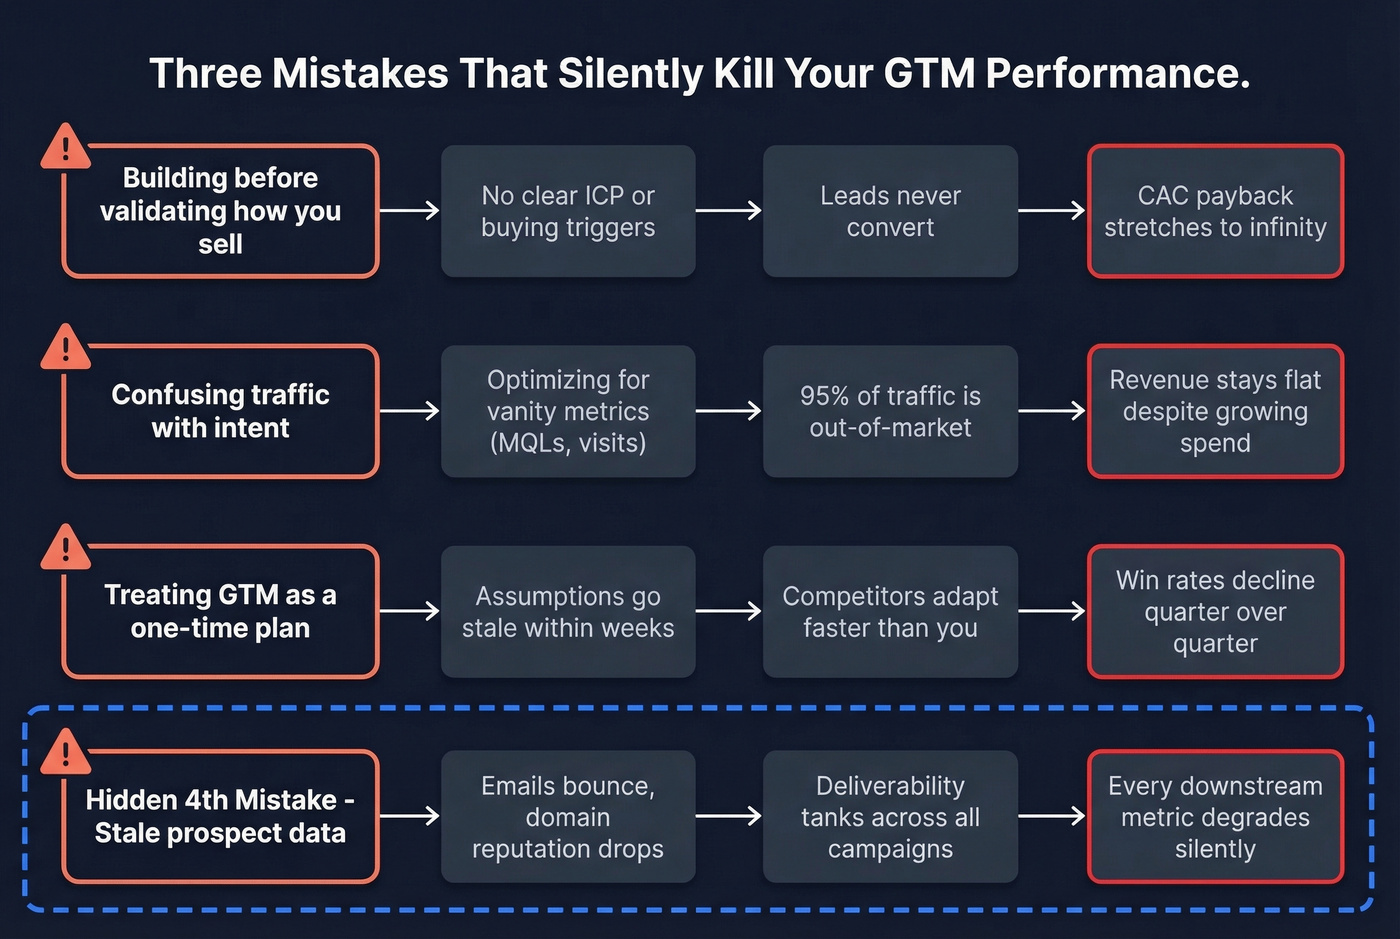
Confusing traffic with intent. Vanity metrics feel good. Website visits, MQL counts, social impressions - none of them predict revenue. The 95-5 Rule means most of that traffic is out-of-market. If you're not filtering for buying signals, you're optimizing for noise.
Treating GTM as a one-time plan. I've seen teams spend months on a go-to-market strategy, launch it, and never revisit the assumptions. Markets shift. Competitors move. Your motion needs weekly iteration, not quarterly reviews.
There's a hidden fourth mistake nobody talks about: feeding your entire revenue engine with stale or inaccurate prospect data. Bad emails bounce, domains get burned, connect rates tank, and every downstream metric - CAC, velocity, win rate - degrades silently. Most teams never trace the problem back to its source.
You just read that reps spend 70% of their time NOT selling - mostly cleaning bad data. Prospeo's 7-day refresh cycle and 98% email accuracy eliminate the stale records dragging your CAC payback past 18 months. At $0.01/email, fixing your data costs less than one wasted rep hour.
Stop bleeding pipeline velocity to bad data. Start for free.
Tag Manager: What's Actually Slowing Your Site
Let's switch to the other GTM. An empty Google Tag Manager container adds roughly 100ms to page load - minimal impact. The problem starts when you add tags.
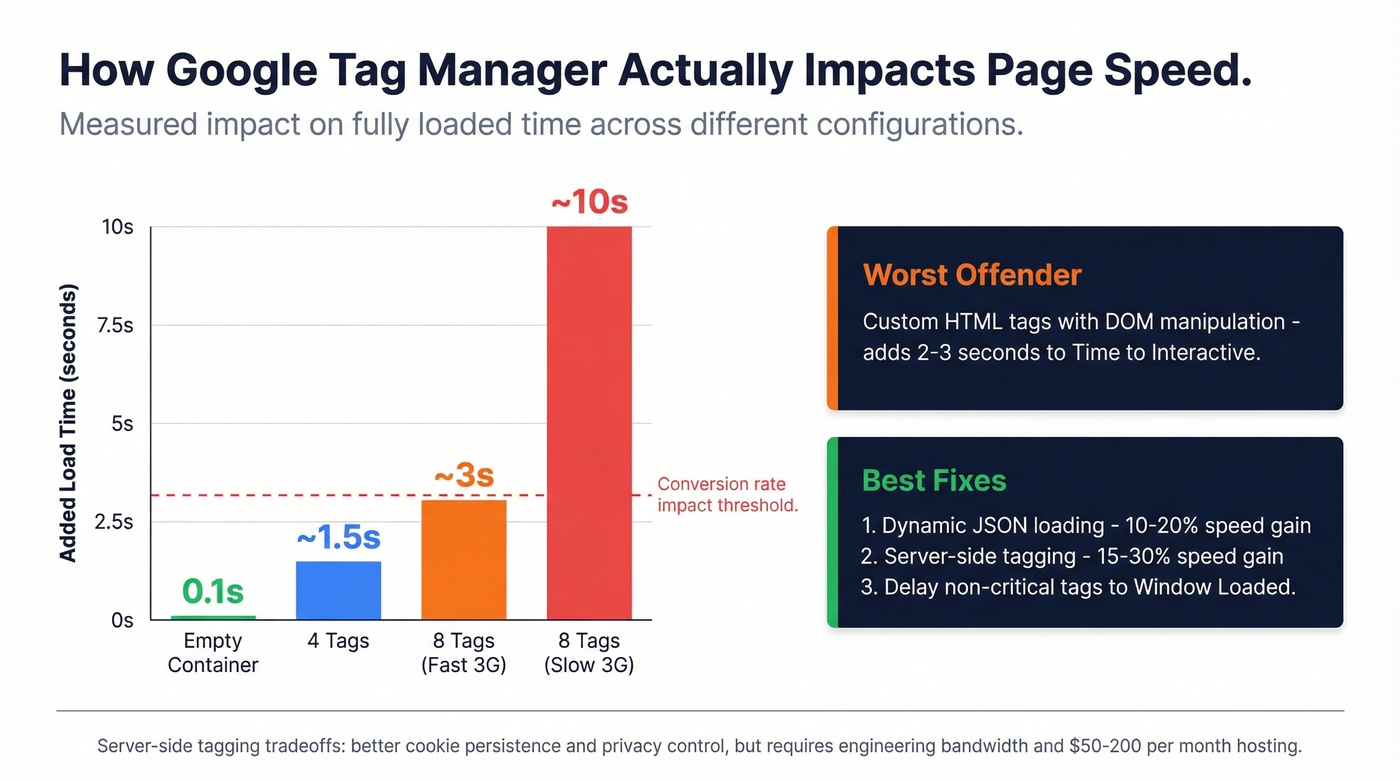
In practitioner testing, 8 tracking tags on a Fast 3G connection slowed fully loaded timing by ~3 seconds and ~10 seconds on Slow 3G. DOM manipulation via Custom HTML tags is the worst offender - one experiment added ~2-3 seconds to Lighthouse Time to Interactive. That's enough to push your CWV scores into the red and crater conversion rates.
Server-side tagging is the most impactful fix, but the tradeoffs are real. Server-set cookies persist longer if implemented properly, ad blockers lose their grip, and you control exactly what PII reaches third-party vendors. On the minus side: you're paying for hosting, wrestling with DNS configuration, and debugging in a preview environment that - as r/PPC practitioners will tell you - makes you question your sanity. The documentation is fragmented, parameter naming is inconsistent, and events sometimes route directly to Google despite identical configs.
Realistic improvement ranges: dynamic JSON-based loading delivers 10-20% page speed gains. Server-side tagging adds another 15-30%. Combined, they're meaningful - but only if you have the engineering bandwidth to maintain the setup.
Technical Optimization Checklist
- Audit unused tags - use gtmtools.com to identify tags that haven't fired in 30+ days, then remove them
- Delay non-critical tags - fire analytics and remarketing tags on
afterLoadorWindow Loadedinstead ofPage View - Minimize DOM manipulation - avoid injecting elements via Custom HTML tags; use CSS-only solutions where possible
- Evaluate server-side tagging - worth it if you run 10+ tags and have engineering support; budget $50-$200/mo for hosting
- Implement dynamic JSON loading - load GTM conditionally based on environment and consent state
- Reset dataLayer on SPA navigation - single-page apps accumulate stale dataLayer values that corrupt your analytics
- Measure with Lighthouse and WebPageTest - test with and without GTM to isolate its impact
How Data Quality Drives Both
Both meanings of GTM converge on data quality. Bad prospect data doesn't just cause bounced emails - it triggers a cascade that wrecks your entire go-to-market motion.
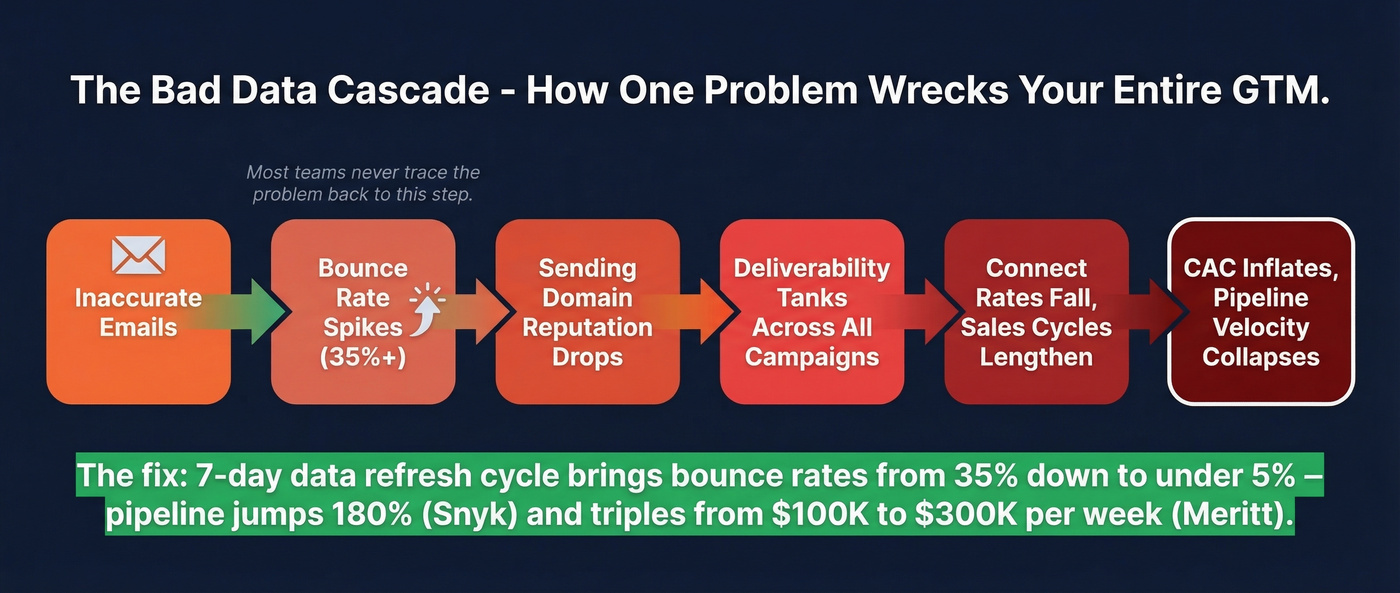
The chain works like this: inaccurate emails bounce, your sending domain reputation drops, deliverability tanks across all campaigns, connect rates fall, sales cycles lengthen, and CAC inflates. Every metric degrades. Most teams never trace the problem back to step one.

When Snyk rolled out Prospeo across 50 AEs, the results were immediate: bounce rates dropped from 35-40% to under 5%, and AE-sourced pipeline jumped 180% with over 200 new opportunities per month. Meritt had a similar experience - pipeline tripled from $100K to $300K per week, with bounces falling from 35% to under 4%. Those aren't marginal improvements. They're what happens when you feed your revenue engine with data on a 7-day refresh cycle instead of contacts that are weeks or months stale.
If you're diagnosing bounces and deliverability, start with email bounce rate benchmarks, then work backward through your email deliverability setup and list hygiene.
GTM performance comes down to execution speed. Teams using Prospeo book 26% more meetings than ZoomInfo users and 35% more than Apollo - because 98% accurate emails and 30% mobile pickup rates mean reps connect with real buyers instead of chasing bounces. That's how you push selling time from 30% to 70%.
Your sales velocity formula is only as good as your contact data.
Tools for Measuring Results
Organizations with unified RevOps tools grow 19% faster. Here's the stack that covers both sides of the equation:
| Tool | Category | Price Range | Best For |
|---|---|---|---|
| Salesforce | CRM / Pipeline | ~$25-$330/user/mo | Pipeline tracking |
| HubSpot | CRM / Marketing | Free tier; paid ~$20-$150+/user/mo | SMB full-stack |
| Prospeo | B2B Data | ~$0.01/email; free tier available | Data accuracy |
| Gong | Revenue Intel | ~$100-$160/user/mo | Call analytics |
| Clari | Forecasting | ~$25K-$100K+/yr | Revenue forecasting |
| Lighthouse | Page Speed | Free | CWV measurement |
| WebPageTest | Page Speed | Free | Tag impact testing |
| gtmtools.com | Tag Auditing | Free | Unused tag cleanup |
If you're building a tighter outbound motion, pair this with a modern sales prospecting database and a few proven sales prospecting techniques.
FAQ
What does GTM performance mean?
It refers to two distinct concepts: go-to-market performance (how effectively revenue teams drive pipeline and close deals) and Google Tag Manager performance (how your tag setup affects page speed and Core Web Vitals). This guide covers both with benchmarks and optimization tactics for 2026.
What are the most important go-to-market metrics?
Pipeline coverage, win rate, and net revenue retention. Coverage tells you if you have enough qualified opportunities - aim for 3x-5x in enterprise. Win rate reveals deal quality. NRR above 100% confirms customers stick and expand.
Does Google Tag Manager slow down websites?
An empty container adds ~100ms - negligible. The real drag comes from tags inside it, especially Custom HTML tags that manipulate the DOM. Eight tags on a Fast 3G connection can add ~3 seconds to fully loaded timing. Server-side tagging and delayed firing cut 15-30% of that overhead.
What's a good pipeline coverage ratio?
Enterprise: 3x-5x. Mid-market: 2.5x-4x. SMB: 2x-3x. Below 2x signals weak lead generation or broken qualification. Above 5x usually means a bloated pipeline full of zombie deals that inflate forecasts but never close.
How does data quality affect go-to-market results?
Bad emails bounce, which burns your sending domain, tanks deliverability, and inflates CAC across every campaign. Teams that switch to verified data with a weekly refresh cycle routinely see bounce rates drop from 30-40% to under 5%, with pipeline increases of 100%+ as a direct result.