How to Actually Improve Your Conversion Rate: Benchmarks, Tactics, and the "Best Practices" That Backfire
Your CEO forwarded a Shopify article saying average conversion rate is 2.5%. Yours is 0.8%. Now there's a Slack thread about it.
The problem: that 2.5% number is meaningless without context. It blends ecommerce checkout rates with B2B demo requests, paid traffic with organic, mobile with desktop. Conversion rate is simply conversions divided by total visitors, but which conversions and which visitors changes everything. Here's how to improve conversion rate using real benchmarks, the tactics that actually move the number, and the "best practices" that quietly make things worse.
The Short Version
- Know your actual benchmark - B2B SaaS websites average 1.1%, legal services hit 7.4%. A generic "2-3%" tells you nothing.
- Fix page speed first. It's the only lever that lifts every conversion on your site simultaneously.
- Stop shortening forms blindly. Multi-step forms have outperformed single-step by up to 743%.
Real Benchmarks Across Industries
The answer depends entirely on what you're measuring and where the traffic comes from. A B2B SaaS company converting website visitors into demo requests operates in a completely different universe than a legal services firm converting Google Ads clicks into consultation bookings.
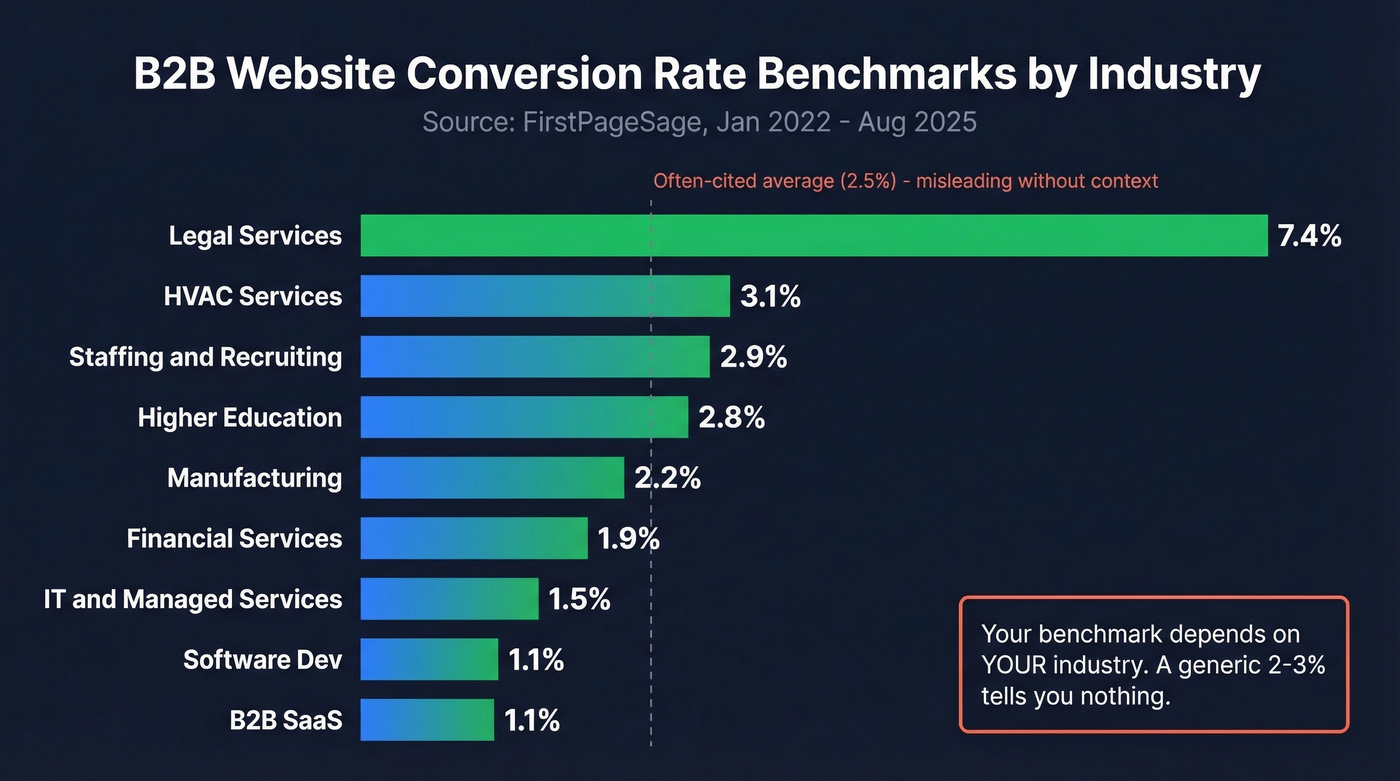
Here are B2B website conversion benchmarks from FirstPageSage, based on client data from Jan 2022 through Aug 2025:
| Industry | Website CVR |
|---|---|
| B2B SaaS | 1.1% |
| Software Dev | 1.1% |
| IT & Managed Services | 1.5% |
| Financial Services | 1.9% |
| Manufacturing | 2.2% |
| Higher Education | 2.8% |
| Staffing & Recruiting | 2.9% |
| HVAC Services | 3.1% |
| Legal Services | 7.4% |
If you're a B2B SaaS company at 1.1%, you're average. At 0.5%, you have a real problem. At 2%, you're outperforming most peers. Context matters more than the number itself.
Here's a quick way to see the impact: if you spend $10K/month on ads at $5 CPC, improving CVR from 3% to 4% drops your cost per lead from $167 to $125 - saving $2,500/month on the same spend. If you want a deeper baseline for lead-stage performance, compare against average B2B lead conversion rate too.
Ads vs. Website Benchmarks
This is the most common benchmarking mistake: mixing up ads conversion rates with website conversion rates. They're fundamentally different numbers.
Google Ads averages 7.52% conversion rate across industries, with massive variation - Animals & Pets hits 13.07%, while Finance & Insurance sits at 2.55%. Average cost per lead: $70.11. Facebook lead ads average 7.72%, with Restaurants & Food at 18.25% and Furniture at just 3.77%.
These numbers are click-to-conversion within the ad platform. They aren't comparable to your website's visitor-to-lead rate. If someone tells you "our conversion rate is 8%," your first question should be: conversion rate of what?
The 52% Gap Nobody Segments
Desktop conversion rates are 52% higher than mobile, per Microsoft Advertising data. Users are 19% more likely to click an ad and 20% more likely to add an item to cart on desktop. Meanwhile, 59.3% of global web traffic comes from mobile devices.
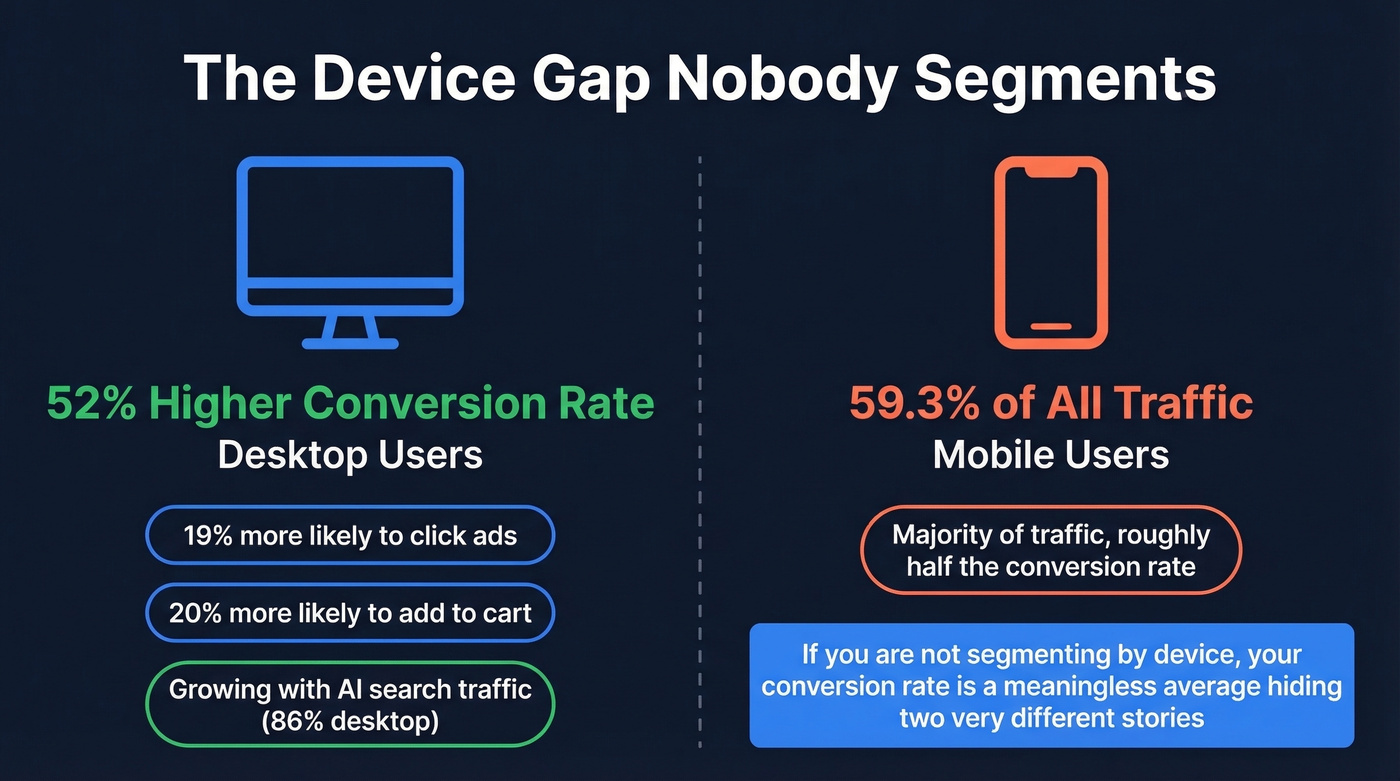
Think about what that means. The majority of your traffic converts at roughly half the rate of the minority. And with 86% of traffic from AI search sources coming from desktop, this gap will likely widen as AI-driven discovery grows. If you aren't segmenting by device, your "conversion rate" is a meaningless average hiding two very different stories.
Using Benchmarks Without Misleading Yourself
A blended industry average is useless if your branded campaigns convert at 15-25%, competitor campaigns at 8-12%, and discovery campaigns at 2-4%. The diagnostic framework from ppc.io gets this right: segment branded vs. discovery traffic, compare CPA to your target CPA, and track month-over-month trend. A 1.5% conversion rate climbing 10% month-over-month is healthier than a 3% rate that's been flat for a year. To keep the analysis consistent, map each segment to the right funnel metrics instead of one blended KPI.
Diagnose Before You Optimize
Before you touch a single CTA button or rewrite a headline, do three things:
Segment by traffic source, device, and page. Your homepage, pricing page, and blog posts have wildly different conversion profiles. Treating them as one number guarantees you'll optimize the wrong thing.
Identify the actual funnel drop-off point. Is the problem that visitors don't reach your form, or that they reach it and abandon? These require completely different fixes. Set up proper funnel visualization in your analytics.
Compare to external benchmarks only after segmenting. Your organic mobile traffic to blog posts should be compared to other content-driven mobile benchmarks, not to your competitor's paid desktop landing page.
Beyond analytics, talk to your customers. Run a 3-question exit survey on high-traffic pages, review session recordings for rage clicks and confusion loops, and interview 5-10 recent converters about what nearly made them leave. Quantitative data tells you where people drop off. Qualitative research tells you why.
Here's the thing: optimize for revenue per visitor, not conversion rate. CVR can go up while revenue goes down - you just made it easier to convert low-intent visitors who never buy. A 50% increase in form submissions that produces zero additional pipeline is a vanity win. If your average deal size is under $10K, you probably don't need sophisticated CRO tooling at all - you need better targeting upstream. If you’re tying CRO to pipeline, align it with sales conversion rate and downstream stage movement.
You just read that optimizing for revenue per visitor beats raw conversion rate. The same logic applies to outbound: sending 10,000 emails with 79% accuracy wastes budget and burns your domain. Prospeo's 98% email accuracy and 7-day data refresh mean every touchpoint reaches a real person - so your pipeline conversion rate improves at every stage.
Stop optimizing landing pages while your contact data tanks deliverability.
8 Tactics to Boost Conversion Rates
These are ordered by impact, not alphabetically. Start at the top.
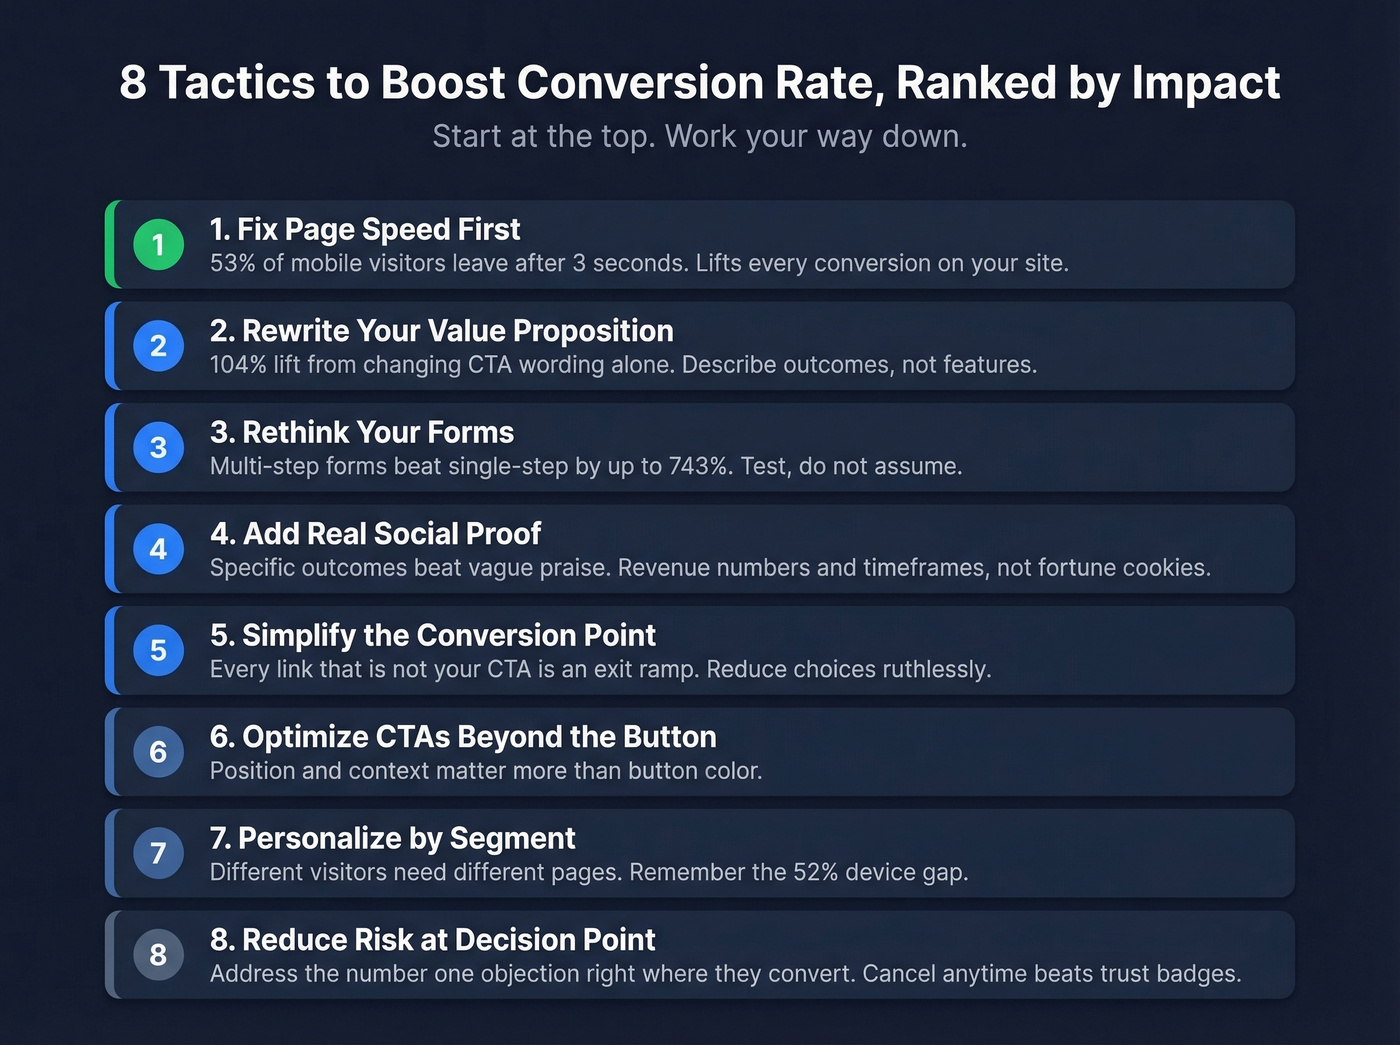
1. Fix Page Speed First
Google's own data shows 53% of mobile visitors abandon a page that takes more than 3 seconds to load. Deloitte research shows that a 0.1-second speed improvement drove 8% more conversions and 10% more customer spending for retail sites. Core Web Vitals thresholds - LCP of 2.5s or less, INP of 200ms or less, CLS of 0.1 or less - are the baseline. Only 53.5% of sites pass all three. No copy change, no design tweak, no A/B test touches as many conversions as making your site faster.
2. Rewrite Your Value Proposition
Travel company Going changed their CTA wording and saw a 104% month-over-month increase in homepage conversion rate. Most value propositions describe what you do, not why the visitor should care. "AI-powered sales enablement platform" tells me nothing about the outcome. "Book 3x more meetings without hiring" tells me everything. If you need a tighter messaging framework, borrow from classic AIDA sales funnel thinking.
3. Rethink Your Forms
Expedia had one extra field in their checkout form. They removed it. Profit increased by $12 million.
But before you start deleting fields, consider this: multi-step forms outperformed single-step by up to 743% in Venture Harbour's testing. Shorter isn't automatically better - sometimes breaking a long form into digestible steps reduces perceived effort more than removing fields does. The direction matters less than the testing.
4. Add Real Social Proof
What doesn't work: "Great product, would recommend."
What does: "We went from $100K to $300K in weekly pipeline within 60 days." Testimonials with specific outcomes increase conversion rates by 34%, per Northwestern research cited by Unbounce. Revenue numbers, timeframes, and named companies beat vague praise every single time. If your testimonials page reads like a collection of fortune cookies, rewrite it.
5. Simplify the Conversion Point
Unbounce's analysis of 20,000+ lead gen landing pages found conversion rate has an inverse relationship with the number of on-page links. Every link that isn't your CTA is an exit ramp. At the conversion point, reduce choices ruthlessly - navigation menus, footer links, sidebar CTAs to other pages all bleed conversions.
6. Optimize CTAs Beyond the Button
Position, copy, and context all matter more than button color. Don't default to above-the-fold placement - test CTA placement after your strongest proof point or benefit statement. Scrolling is normal behavior now, and sometimes you need to deliver value before asking for the conversion.
7. Personalize by Segment
A returning visitor and a first-time visitor need different pages. A mobile user and a desktop user need different layouts - remember that 52% conversion gap. Traffic-source-specific landing pages consistently outperform one-size-fits-all approaches. If you're sending Google Ads traffic and organic blog traffic to the same page, you're leaving conversions on the table. For B2B, this gets even sharper when you apply intent based segmentation to route visitors to the right offer.
8. Reduce Risk at the Decision Point
Ask yourself: what's the #1 objection a visitor has right before they convert? In B2B, it's almost always fear of getting locked into a bad vendor contract. Risk reversal is the most underused conversion lever in B2B. We've seen teams add a simple "cancel anytime, no contracts" line next to a demo CTA and lift demo request conversion by 15-20%. Guarantees, free trials, money-back promises - address the fear directly at the point of conversion.
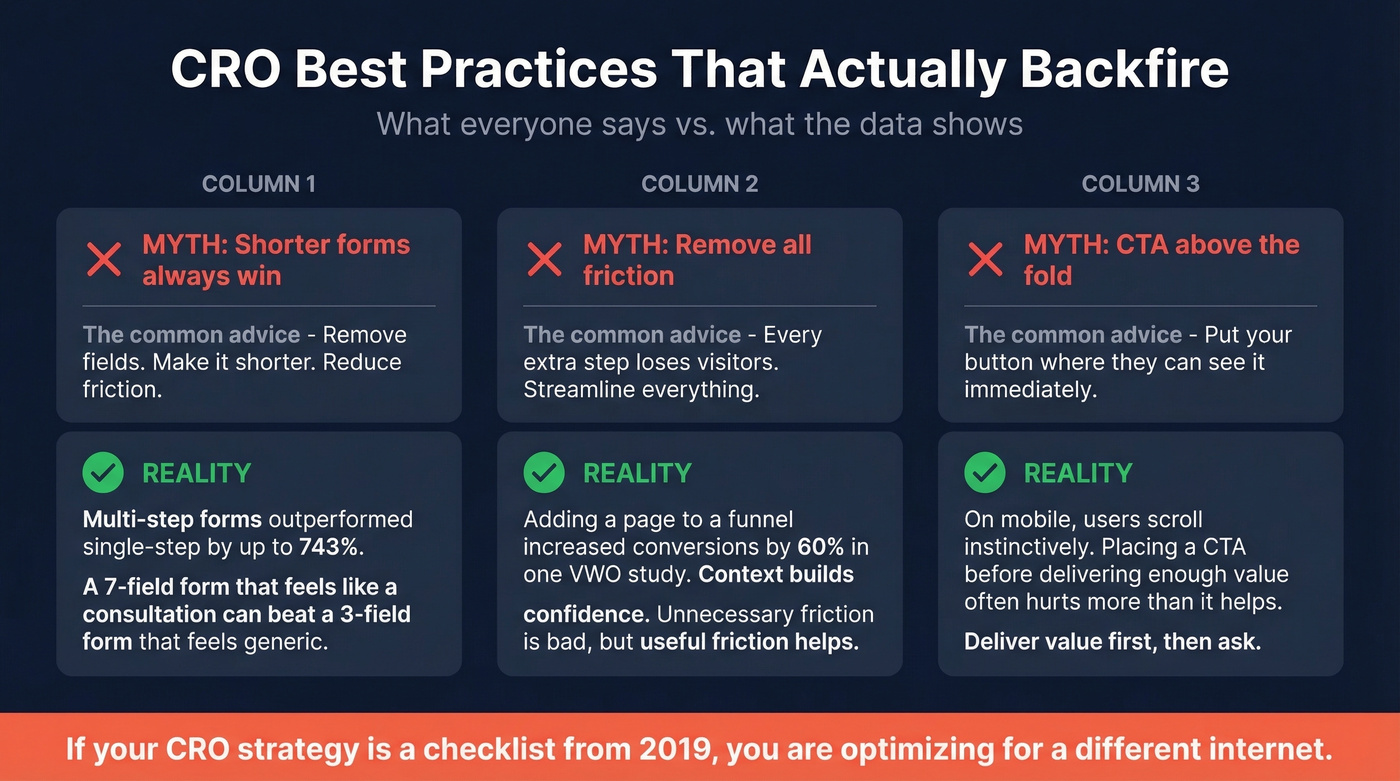
"Best Practices" That Backfire
The "reduce friction" mantra has become cargo cult CRO. Teams blindly remove form fields, eliminate steps, and strip pages down to nothing - then wonder why conversions didn't improve.
"Shorter forms always win." They don't. Venture Harbour's 743% lift from multi-step forms is the most dramatic counterexample, but the pattern is consistent. Sometimes adding qualification questions increases conversion because it makes the process feel more personalized. A 3-field form that feels generic can underperform a 7-field form that feels like a consultation.
"Remove all friction." A VWO case study showed that adding a page to a funnel increased conversions by 60%. The extra step provided context that made visitors more confident in converting. Friction isn't inherently bad - unnecessary friction is bad. There's a real difference between removing a redundant confirmation screen and removing the page that explains what happens after they submit.
"CTA above the fold." This made sense when desktop was dominant and scrolling felt like work. On mobile, users scroll instinctively. Placing a CTA before you've delivered enough value to justify the ask often hurts more than it helps.
Let's be honest: if your CRO strategy is "follow the checklist from a 2019 blog post," you're implementing tactics that were tested on a different audience, a different device mix, and a different competitive environment entirely.
Improving Conversion Rate in B2B Outbound
For B2B teams, conversion rate isn't just a website metric - it's a pipeline metric. Improving sales conversions in outbound looks nothing like landing page optimization.
The consensus on r/b2bmarketing is practical: skip links and attachments in your first cold email - offer to send collateral after a positive reply. Propose specific meeting times instead of sending a calendar link. Counterintuitive, but it consistently outperforms.
For timing and follow-up, use signal-based targeting - job changes, funding rounds, hiring surges - to reach prospects when they're most likely to act. Follow up with closed-lost deals every few months with an objection-based check-in. These small moves compound and can lift the pipeline metrics sales teams depend on without any changes to messaging or positioning. If you want ready-to-use language, start from proven sales follow-up templates.
None of those tactics matter if a third of your emails bounce. Bad data is the silent conversion killer in outbound. If your bounce rate is 30%+, you're burning sender reputation, missing a third of potential conversations, and skewing every metric downstream. In our experience, data quality fixes often produce bigger lifts than messaging rewrites. Meritt, a Prospeo customer, saw pipeline triple from $100K to $300K per week after cleaning up their contact data - bounce rate dropped from 35% to under 4%, and connect rates tripled to 20-25%. That wasn't a messaging fix. It was a data quality fix that unlocked the messaging they already had. If you’re troubleshooting this, use an email bounce rate benchmark and remediation checklist, then lock in the basics of email deliverability.
Fixing page speed and rewriting CTAs won't help if your sales team is reaching the wrong people. Prospeo's 30+ search filters - including buyer intent signals across 15,000 topics - let you target prospects already in-market. Teams using Prospeo book 35% more meetings than Apollo users. That's a conversion rate lift no A/B test can match.
Target in-market buyers instead of guessing who's ready to convert.
The CRO Tool Stack for 2026
Google Optimize is dead - sunset September 2023. CXL and Shopify were still recommending it well after, which is a good reminder to check publication dates on "definitive" CRO guides.
The current tool stack worth considering:
| Tool | Category | Starting Price |
|---|---|---|
| Google Analytics 4 (GA4) | Analytics | Free |
| Crazy Egg | Heatmaps/Testing | $29/mo |
| Hotjar | Heatmaps/Surveys | $99/mo |
| Heatmap.com | Ecommerce Heatmaps | Free plan available |
| VWO | A/B Testing | ~$99/mo entry |
| AB Tasty | A/B Testing | ~$43K/yr enterprise |
The enterprise A/B testing pricing is genuinely shocking. Both VWO and AB Tasty have been quoted at ~$43,000/year for what users describe as "basic" A/B testing needs. That's real money for a tool you might use for 3-4 tests per quarter.
Budget recommendation: Start with Crazy Egg at $29/mo plus Google Analytics. Add VWO or a comparable testing platform when you have enough traffic for valid tests - in many common scenarios, that means roughly 13,000 visitors per variation for a meaningful result at 95% confidence. Skip the enterprise tools entirely if you're running fewer than 10 tests per year.
FAQ
What's a good conversion rate for my industry?
B2B SaaS websites average 1.1%, legal services hit 7.4%, and Google Ads average 7.52% across all industries. Compare to your specific vertical and traffic channel, not a generic "2-3%" benchmark that blends incompatible data. Segment by device too - desktop converts 52% higher than mobile.
How long should I run an A/B test?
Run until you reach 95% statistical confidence. For a 3% baseline and a 1-point minimum detectable effect, you need roughly 13,000 visitors per variation. If you get 5,000 visits per month, most "results" after a week are noise. Calling a winner early is the most common CRO mistake we see.
Does data quality affect outbound conversion rates?
Dramatically. If 35% of your emails bounce, you're destroying sender reputation and missing a third of potential conversations. Cleaning up contact data before touching your messaging is almost always the higher-ROI move.
Should I optimize for conversion rate or revenue per visitor?
Revenue per visitor. Conversion rate can climb while revenue drops - you've just made it easier for low-intent visitors to convert without buying. A 50% lift in form fills that adds zero pipeline is a vanity metric. Tie CRO efforts to downstream revenue, not top-of-funnel percentages.