ICP Scoring: How to Build a Model Your Sales Team Will Actually Trust
A RevOps lead posts on r/revops: "ICP, TAM, and scoring always feel broken." Half the accounts in the CRM didn't fit the ICP. The TAM lived in a spreadsheet nobody updated. And the scoring model? Either it's basic rules in HubSpot that nobody trusts, or it's a six-figure 6sense contract that nobody understands.
Meanwhile, 79% of marketing-generated leads never convert to sales. ICP scoring won't fix everything, but it will stop your team from burning prime selling hours on the wrong accounts. Here's how to build one that works - with a copy-paste rubric, routing SLAs, and the benchmarks to prove ROI.
The Short Version
Start with a 100-point rubric covering firmographics, technographics, and intent signals. Steal the template below.
Fix your data before you score it. Up to 21% of prospect data is inaccurate. Scoring dirty data just produces organized garbage.
You don't need a six-figure tool. A spreadsheet plus clean data beats a black-box AI running on stale CRM records. Every time.
What Is ICP Scoring?
ICP scoring assigns a numeric grade to companies - not individual contacts - based on how closely they match your ideal customer profile. It's the account-level cousin of lead scoring, and the distinction matters more than most teams realize.
Lead scoring ranks individual people by engagement and fit. Account-level scoring ranks entire organizations by firmographic, technographic, and intent alignment. With average B2B deals involving 6-10 stakeholders, lead-only scoring misses the forest for the trees. One champion scores high while the account itself is a terrible fit. Scoring at the account level catches that before your SDR wastes a quarter chasing it.
The 100-Point ICP Scoring Rubric
This is the centerpiece. A 100-point scale is intuitive - everyone understands percentages - and it forces you to make tradeoffs about what actually matters. You can't give everything 20 points. You have to decide.
Sample Point Allocations
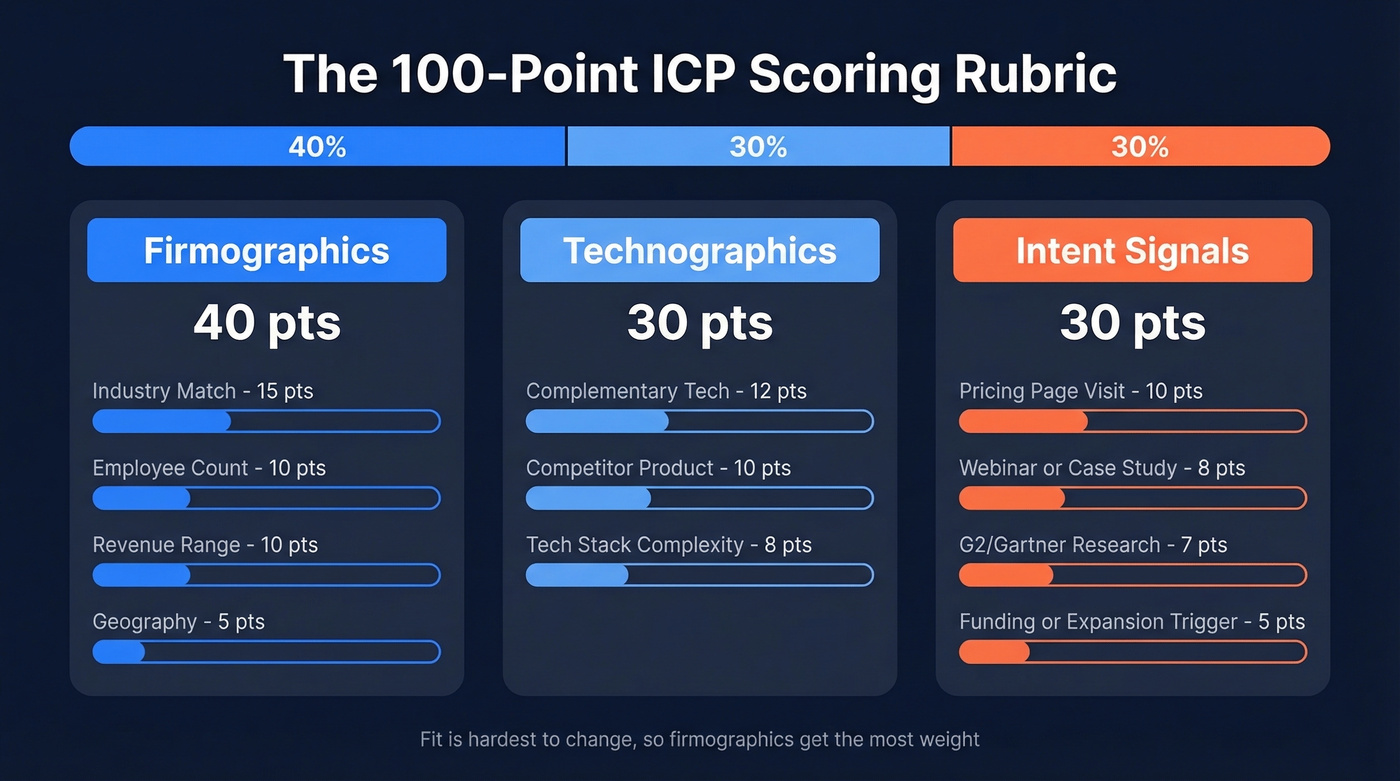
This rubric is built for a mid-market B2B SaaS company. Adjust the specific criteria, but keep the category weights close to these ratios.
| Category | Signal | Points |
|---|---|---|
| Firmographics (40 pts) | Industry match | 15 |
| Employee count (sweet spot) | 10 | |
| Revenue range | 10 | |
| Geography | 5 | |
| Technographics (30 pts) | Uses complementary tech | 12 |
| Uses competitor product | 10 | |
| Tech stack complexity | 8 | |
| Intent (30 pts) | Pricing page visit | 10 |
| Webinar / case study | 8 | |
| G2/Gartner research | 7 | |
| Funding / expansion trigger | 5 |
Firmographics get the most weight because fit is the hardest thing to change. A company in the wrong industry with the wrong headcount won't close no matter how many intent signals they throw off. Technographics and intent split the remaining 60 points evenly - tech stack tells you they can buy, intent tells you they might buy soon.
One nuance we've learned the hard way: don't score "employee count 50-500" as a single bucket. A 75-person startup and a 400-person scale-up have completely different buying motions, budget authority, and procurement cycles. Narrow your ranges or you'll blur the signal into noise.
Tier Thresholds and Outcomes
| Tier | Score Range | Expected Outcome |
|---|---|---|
| A | 80-100 | 1.5-2x win rate vs Tier B |
| B | 50-79 | Baseline conversion rates |
| C | 0-49 | Lowest conversion rates |
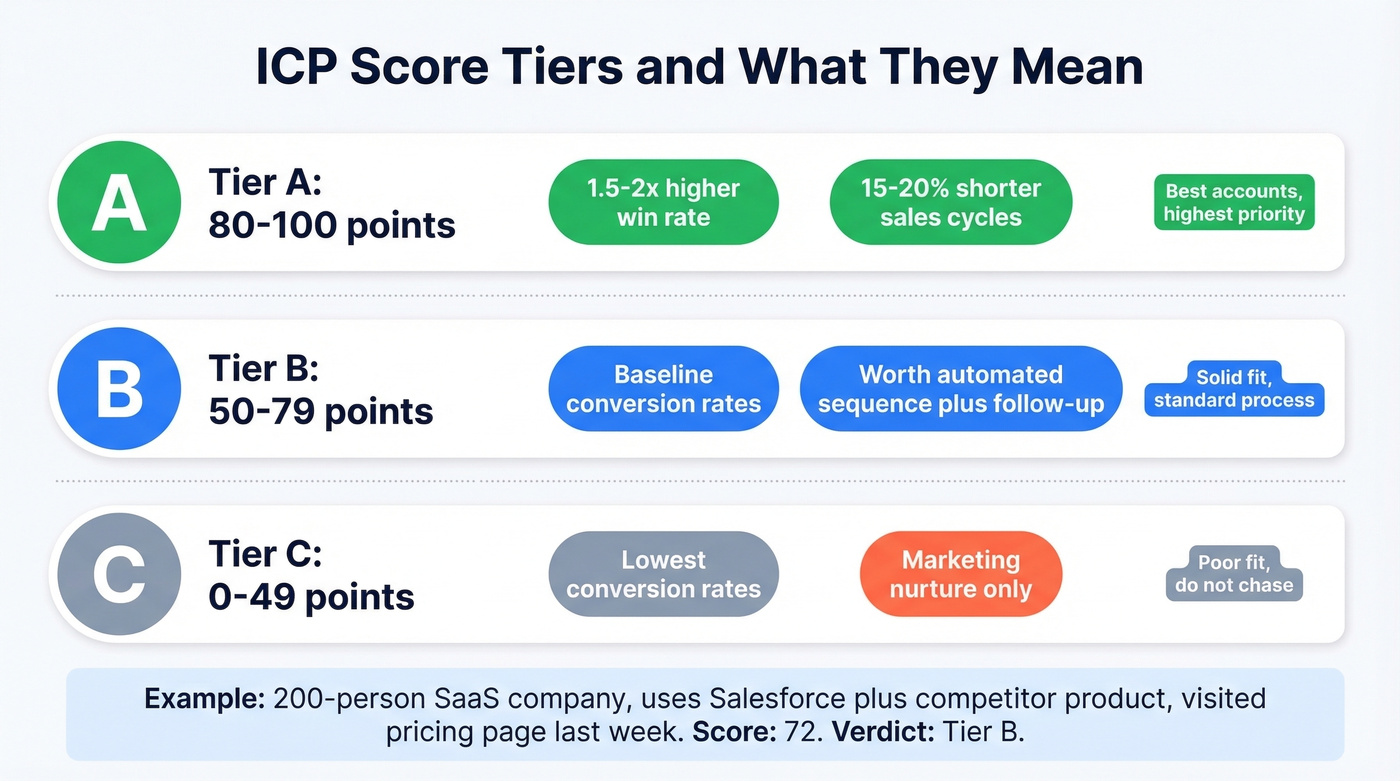
Top teams see Tier A win rates running 1.5-2x higher than Tier B, with 15-20% shorter sales cycles. You're not just sorting accounts - you're predicting where your reps' time will actually convert.
Let's walk through a quick example. A 200-person SaaS company gets 10 pts for employee count, 15 for industry, 10 for revenue, 5 for geography - that's 40 firmographic. They use Salesforce and a competitor's product, so 12 + 10 = 22 technographic. They visited your pricing page last week: 10 intent. Total: 72. Solid Tier B - worth an automated sequence and a follow-up call, but not a drop-everything SDR sprint.
How to Build Your Scoring Model
Once you've validated the basic rubric against 3-6 months of pipeline data, two approaches stand out for adding sophistication.
The 6-Dimension Weighted Model
Understory's framework expands the rubric into six predictive dimensions: firmographic fit (30%), technographic overlap (20%), intent signals (15%), engagement behavior (15%), buying triggers (10%), and economic outcome like ACV/LTV potential (10%).
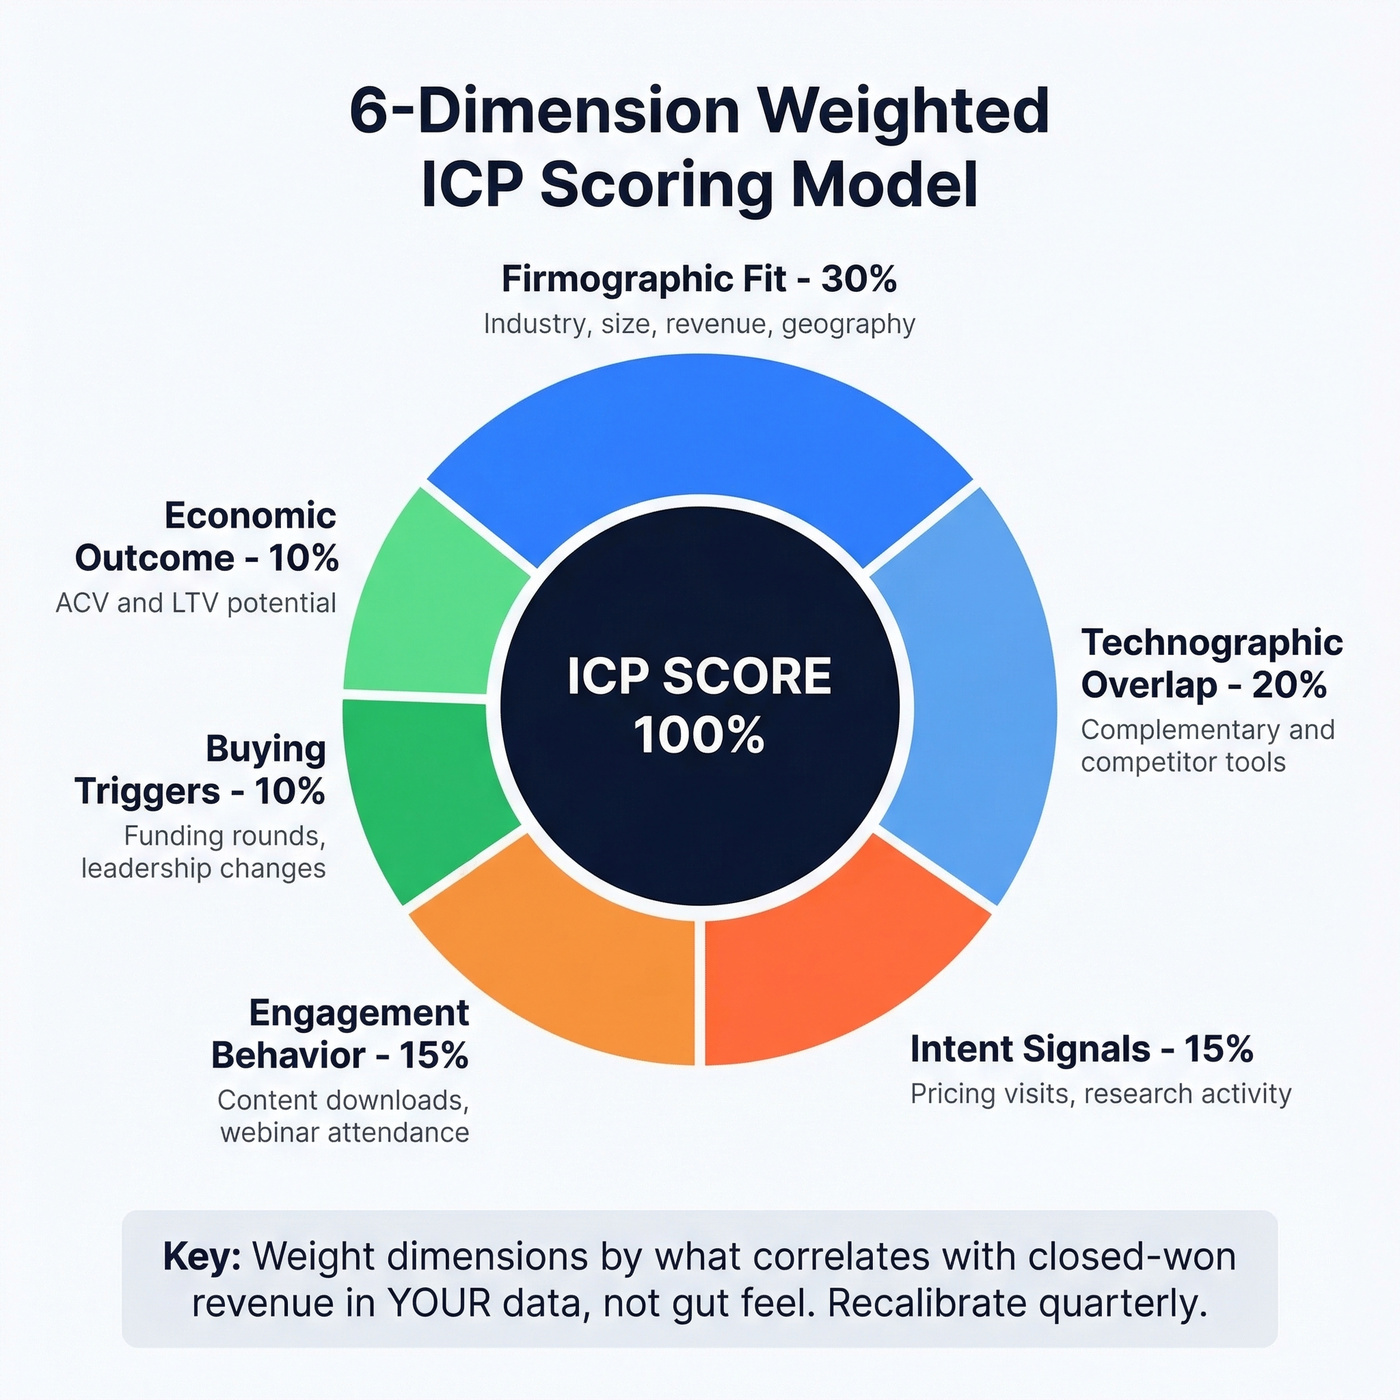
The key move is evidence-based calibration. Pull 12 months of closed-won and closed-lost data, compute win rates by dimension strength, and weight the dimensions that correlate most strongly with revenue. If technographic overlap predicts wins better than intent in your data, bump it up. Don't guess - let your pipeline tell you. This is what separates a data-driven model from one built on gut feel.
Bipolar Scoring (-5 to +5)
The GTMonday framework scores each attribute on a -5 to +5 scale, deliberately skipping 2s and 4s to force clarity. You either feel strongly about a signal or you don't.
Negative scores are the real innovation here. A -5 means "this attribute correlates with higher churn." A -3 means "consumes more resources than average." A -1 means "uncertainty - not enough data." This is how you build anti-ICP logic into your model.
Here's the thing: I've seen teams ignore negative signals for months, then wonder why their Tier A accounts churn at the same rate as Tier C. If a company matches your firmographic profile but operates in a segment with historically terrible retention, that needs to show up as a penalty. Not get swept under the rug.
You just read it: 21% of prospect data is inaccurate. Scoring dirty data produces organized garbage. Prospeo's 5-step verification delivers 98% email accuracy and refreshes every 7 days - not the 6-week industry average. Your ICP rubric deserves data that won't sabotage it.
Fix the data layer before you score a single account.
Routing Playbook by Tier
Scoring without routing is just an intellectual exercise. Here's the operational playbook that turns tiers into action.
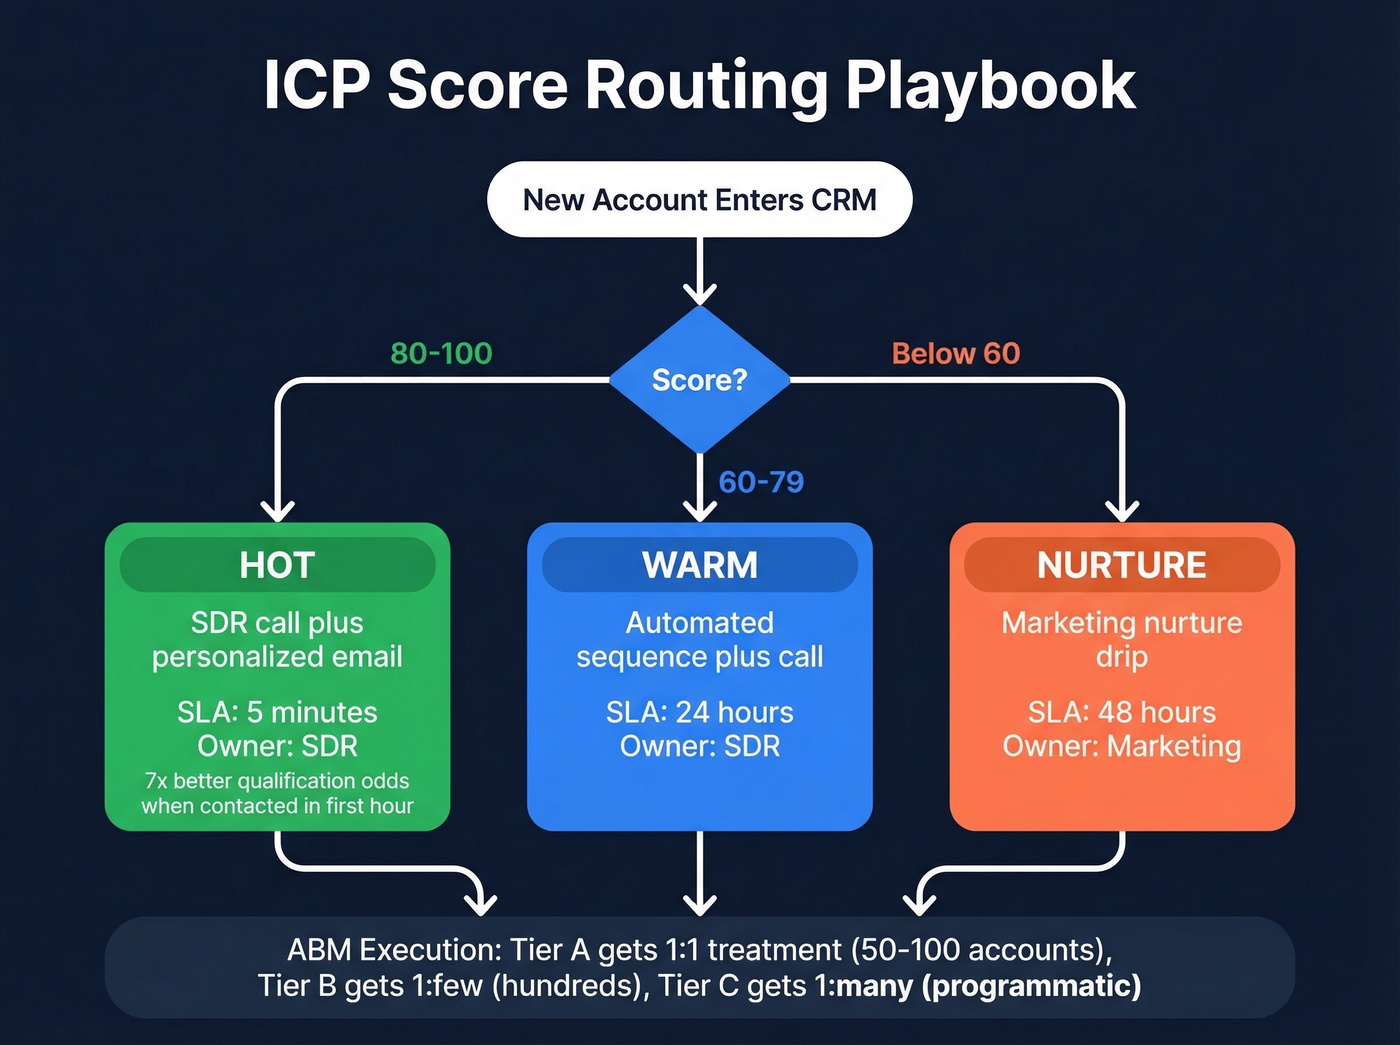
| Score | Classification | Action | SLA | Owner |
|---|---|---|---|---|
| 80-100 | Hot | SDR call + personalized email | 5 minutes | SDR |
| 60-79 | Warm | Automated sequence + call | 24 hours | SDR |
| <60 | Nurture | Marketing nurture drip | 48 hours | Marketing |
Responding within the first hour boosts qualification odds by roughly 7x. That's why top teams compress Tier A SLAs to 5 minutes. Every minute your best-fit accounts sit uncontacted is money left on the table.
Mapping Tiers to ABM Execution
Score tiers translate directly into ABM resource allocation. Tier A accounts get 1:1 treatment - personalized outreach, custom content, dedicated reps. Limit this to 50-100 accounts so quality stays high. Tier B gets 1:few treatment - clustered by industry or use case, with semi-personalized campaigns across a few hundred accounts. Tier C goes into 1:many programmatic campaigns at scale.
This mapping prevents the most common ABM mistake: spreading personalization so thin it stops being personal.
Automating the Pipeline
The scoring workflow should run on autopilot: enrichment pulls fresh firmographic and technographic data, the model assigns tiers, scores sync to your CRM, and routing rules fire based on thresholds. Tools like Zapier, Make, or Clay can stitch this together without engineering resources. The goal is zero manual steps between "new account enters CRM" and "rep gets notified" - a real-time system that grades accounts the moment they appear, not a weekly spreadsheet exercise someone forgets to run.
Fix Your Data Before You Score
Most scoring models don't fail because of bad logic. They fail because of bad data.
With roughly one in five accounts scored on wrong firmographics, outdated tech stack info, or stale intent signals, you're not building a scoring model - you're building organized garbage with a nice tier label on top. Before you assign a single point, you need three things: verified emails so your outreach actually lands, current firmographics so industry and headcount scores reflect reality, and fresh technographics so you're not scoring a company on a tool they ditched six months ago.
There's a bounce-rate dimension most teams overlook. If your bounce rate is high, your engagement and intent signals get distorted because a chunk of your outreach never arrives. High bounces corrupt the feedback loop that scoring depends on.
We run our account lists through Prospeo's enrichment before scoring. With 98% email accuracy and a 7-day data refresh cycle versus the 6-week industry average, it ensures the model operates on reality rather than stale CRM records. At roughly $0.01 per email, cleaning your data costs less than one bad meeting booked on a wrong number.
If you want to sanity-check your vendor options, start with a shortlist of data enrichment services and compare them on refresh rate, coverage, and verification methodology.

Apply a 30-day score decay rule - any signal older than 30 days loses 50% of its value. Recalibrate the entire model quarterly. Pull closed-won and closed-lost data, compare win rates by tier, and adjust weights. A scoring model that doesn't evolve slowly becomes fiction.
Your 100-point rubric needs firmographics, technographics, and intent signals - Prospeo delivers all three. Filter 300M+ profiles by 30+ attributes including tech stack, headcount growth, funding, and Bombora intent data across 15,000 topics. Build your scoring model on signals that actually predict pipeline.
Stop guessing at ICP fit. Filter on the signals that close deals.
Tools Compared for 2026
| Tool | Best For | Scoring Approach | Starting Price |
|---|---|---|---|
| Prospeo | Data quality layer | Enrichment + verification | Free; ~$0.01/email |
| Keyplay | Dedicated account scoring | A-D grading, signals | ~$12k/yr (Growth) |
| HubSpot | CRM-native scoring | Manual + predictive | $890/mo (Pro) |
| 6sense | Enterprise ABM | AI/black-box | ~$60k-$300k/yr |
| Salesforce Einstein | SF-native orgs | ML-based | $165/user/mo + Einstein from $50/user/mo |
| RollWorks | ABM account grading | A-F grading | ~$15k-$25k/yr |
| MadKudu | Mid-market/enterprise | Custom models | Custom pricing |
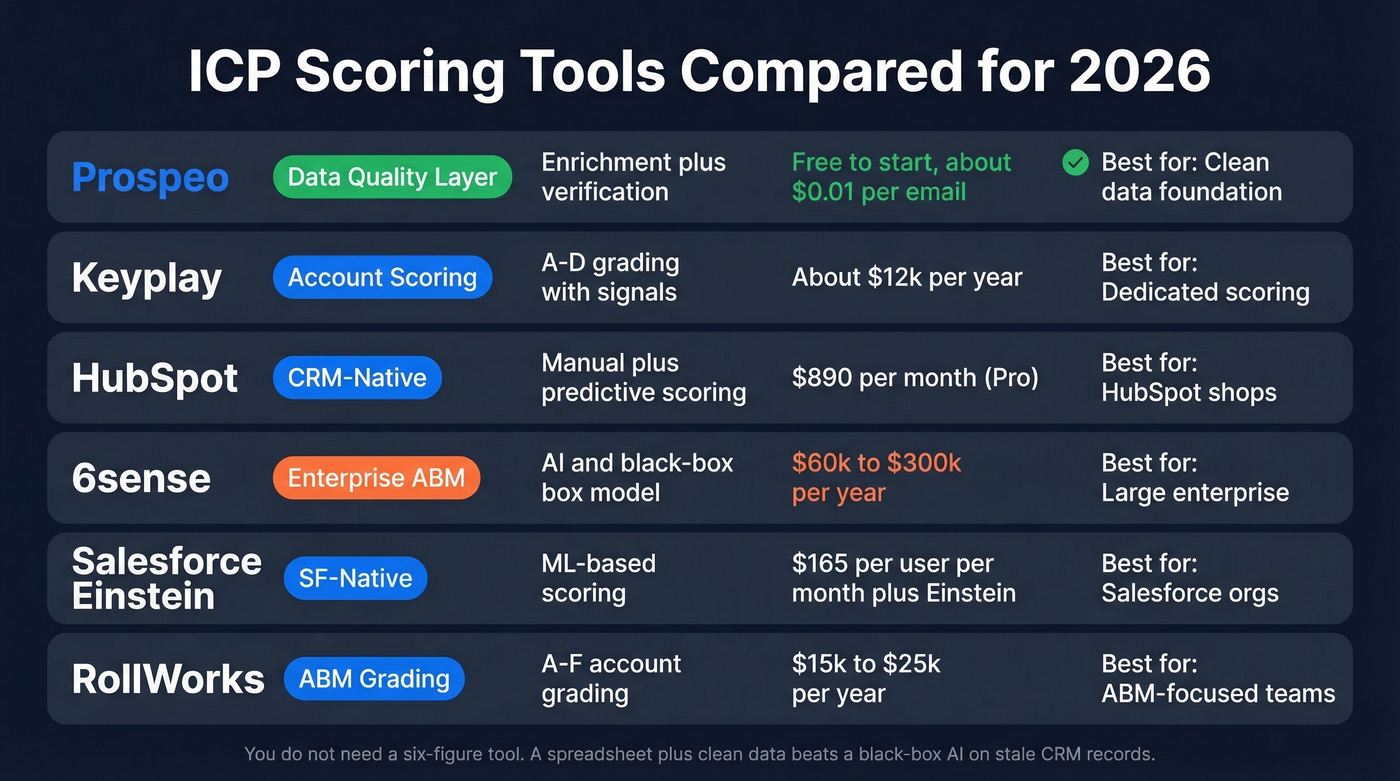
Hot take: if your average deal size is under $25k, you probably don't need any tool on this list beyond a spreadsheet and clean data. The rubric does the thinking. The tool just automates the plumbing.
If you're still building your outbound stack, it helps to compare SDR tools based on routing, sequencing, and CRM sync.
Keyplay
Keyplay is the dedicated scoring tool that mid-market teams keep gravitating toward. It lets you define scoring signals (cap at 15-30 for clarity), assigns A-D grades, and integrates with your CRM. The free preview lets you test 25 accounts before committing. One standout feature is company similarity scoring - Keyplay identifies accounts that resemble your best customers based on shared attributes, surfacing lookalike prospects you'd otherwise miss.
Growth plans run ~$12k/year; Scale is custom. Keyplay wins over a DIY spreadsheet by automating signal collection and keeping scores fresh without manual updates. It falls short compared to 6sense on intent data and multi-touch attribution - but for most teams under 500 employees, that's a feature, not a bug. Skip Keyplay if you're pre-Series A and still figuring out your ICP; you'll outgrow whatever you configure in the first six months.
HubSpot
If you're already on HubSpot, scoring lives inside your CRM - no integration headaches. Professional ($890/mo for 3 seats) gives you manual scoring with custom properties. Enterprise ($3,600/mo, 10-seat minimum) unlocks predictive scoring.
The consensus on r/hubspot is that even with the newer scoring tools, building models still feels like starting from zero. HubSpot scoring is adequate - genuinely - but only if you do the framework work upfront. Without a documented rubric and sales alignment on what "qualified" means, you'll end up with tribal knowledge that breaks when someone leaves.
6sense
6sense is overkill for 90% of teams reading this. At $60k-$300k/year, it's an enterprise ABM platform that happens to include scoring, not a scoring tool. If your average deal size is under $50k, 6sense costs more than it saves. The black-box AI concern is real too - when sales asks "why is this account Tier A?" and the answer is "the model says so," trust erodes fast. Explainability isn't optional.
Salesforce Einstein
For orgs already paying Salesforce Sales Cloud Enterprise ($165/user/mo), Einstein adds ML-based scoring starting at $50/user/mo. Native integration means scores live right where reps work. The tradeoff: you're locked into the Salesforce ecosystem, and the model's explainability is limited compared to a manual rubric you built yourself.
RollWorks & MadKudu
RollWorks offers A-F account grading bundled into its ABM packages, typically starting around $15k-$25k/year. Solid if you're already running RollWorks for advertising. MadKudu builds custom scoring models for mid-market and enterprise with quote-based pricing. Neither is worth evaluating unless you've already outgrown a spreadsheet-based model and need tighter integration with your ad spend or product-led growth signals.
If you're trying to tighten the handoff between tiers and pipeline stages, a clean lead status setup prevents routing chaos.
Mistakes That Kill Your Model
Six ways teams sabotage their own scoring:
- Scoring on dirty data. If one in five records is wrong, your tiers are fiction. Clean first, score second.
- Overcomplicating with 50+ signals. More signals doesn't mean more accuracy. It means more noise and less explainability. Cap at 15-30.
- No sales-marketing alignment on "qualified." If sales and marketing disagree on what a Tier A account looks like, the model is dead on arrival. Align before you build.
- Static models that never get recalibrated. Markets shift. Your ICP shifts. Recalibrate quarterly against closed-won/closed-lost data.
- Ignoring negative signals. Anti-ICP attributes - high churn segment, wrong buying motion, budget mismatch - need to subtract points. A model with only positive signals will over-score bad accounts every time. (If churn is a recurring surprise, build a simple churn analysis loop into your scoring reviews.)
- No backtesting. If you haven't validated your tiers against actual pipeline outcomes, you're guessing. Pull 6-12 months of data and check whether Tier A actually wins more than Tier B.
Benchmarks - What Good Looks Like
How do you know your scoring model is working? Track these numbers.
| Metric | Average | Top Performers |
|---|---|---|
| MQL-to-SQL conversion | 18-22% | 25-35% |
| Lead scoring adoption | 44% of companies | - |
| Lead scoring ROI lift | 77% higher lead gen ROI | - |
| Tier A vs Tier B win rate | 1.5-2x higher | - |
| Tier A cycle time | 15-20% shorter | - |
Channel-specific MQL-to-SQL rates add useful context: SEO-sourced leads convert at 51%, email at 46%, webinars at 30%, PPC at 26%, and events at 24%. If your Tier A accounts from paid channels are converting below 26%, the scoring model is misaligned - or the data feeding it is stale.
Even a 5% boost in conversion rates can drive 12-18% revenue increases. You're not generating more leads. You're making the ones you have count.
To keep the model honest, track a few funnel metrics alongside win rate (speed-to-lead, stage conversion, and drop-off by tier).
FAQ
What's the difference between ICP scoring and lead scoring?
ICP scoring ranks companies against your ideal customer profile using firmographics, technographics, and intent signals. Lead scoring ranks individual contacts by engagement and demographic fit. With 6-10 stakeholders in the average B2B deal, account-level scoring catches buying signals that individual lead scoring misses - like multiple contacts from the same company researching your category at the same time.
How often should I recalibrate my model?
Quarterly at minimum. Pull 12 months of closed-won and closed-lost data, compare win rates by tier, and adjust weights for dimensions that correlate most strongly with revenue. Apply a 30-day score decay rule to prevent stale signals from inflating scores.
Can I build an ICP scoring model without a dedicated tool?
Absolutely - start with the 100-point rubric in a spreadsheet and validate it against 3-6 months of pipeline data. Pair it with a data enrichment tool like Prospeo for verified emails and fresh firmographics to ensure reliable inputs before investing in scoring software. A clean spreadsheet beats a sophisticated tool running on garbage data.
What is an ICP fit score?
An ICP fit score measures how closely a company matches your defined ideal customer profile across firmographic, technographic, and behavioral dimensions. Unlike a generic lead score that blends individual engagement with demographic data, it's purely account-level - telling you whether the company itself is the right type of customer, regardless of how active any single contact has been.