KPIs for Relationship Selling: 7 Metrics That Matter in 2026
You're three months into an enterprise deal with one contact. That contact leaves the company. Deal dead.
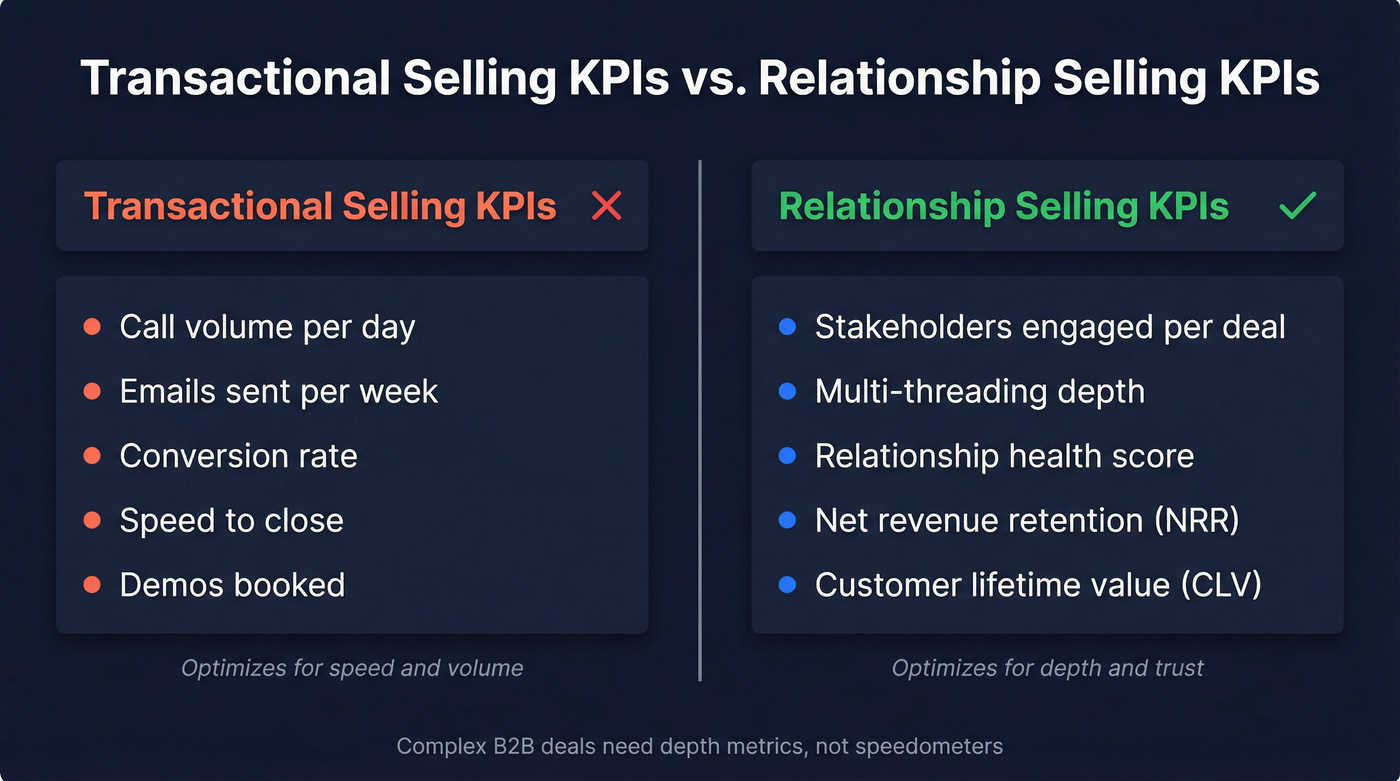
This is what happens when you measure relationship selling with transactional KPIs - you optimize for speed and volume while the actual deal hinges on depth and trust. Choosing the right KPIs for relationship selling changes what your reps prioritize and, ultimately, whether complex deals close.
Why Relationship Selling Needs Different Metrics
Transactional selling rewards velocity. More calls, faster closes, higher conversion rates. That works when you're selling a $500/year subscription with a single buyer. But relationship selling operates on a fundamentally different axis - recurring revenue, multi-stakeholder decisions, and trust built over months.
The typical B2B buying group involves 6-10 stakeholders. Six to ten people who all need to feel confident before a deal closes. Tracking call volume in that environment doesn't just miss the point - it actively incentivizes the wrong behavior. A rep who makes 50 shallow calls looks better on a dashboard than one who spent three hours mapping the buying committee and building genuine rapport with four decision-makers. Only one of those reps is closing the deal.
Most sales KPI guides list 20+ metrics and treat that as a feature. For relationship sellers, that's noise. You need 5-7 depth metrics that measure what actually moves complex deals forward.
What You Need (Quick Version)
Five metrics that matter most for relationship-driven sales:
- Stakeholders engaged per deal - target 3+ active contacts across different roles
- Multi-threading depth - 3+ threads per account, first engagement within 14 days
- Relationship health score - composite of freshness, frequency, response quality, and breadth (target 4.0+ on a 1-5 rubric)
- Net revenue retention (NRR) - target 104%+ for B2B SaaS
- Customer lifetime value (CLV) - CLV-to-CAC ratio of 3:1 or higher
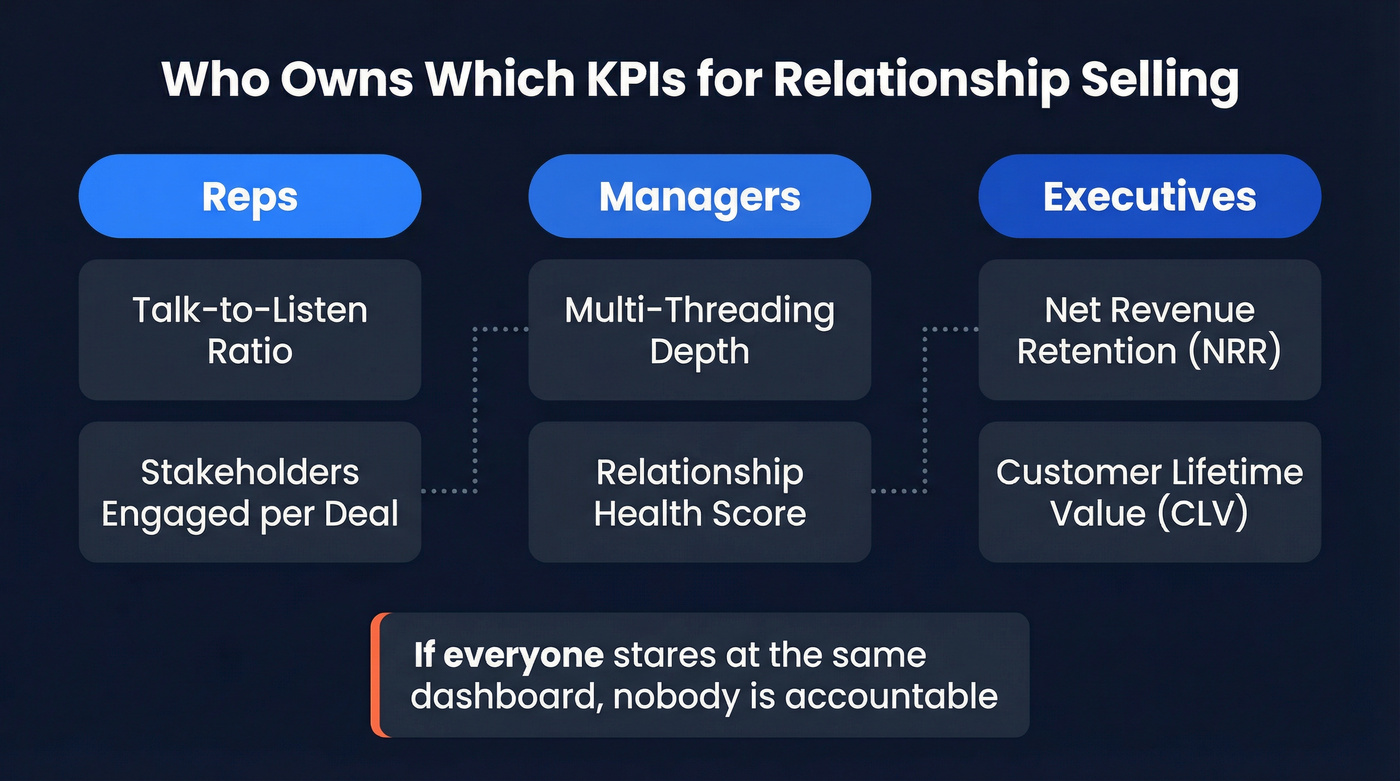
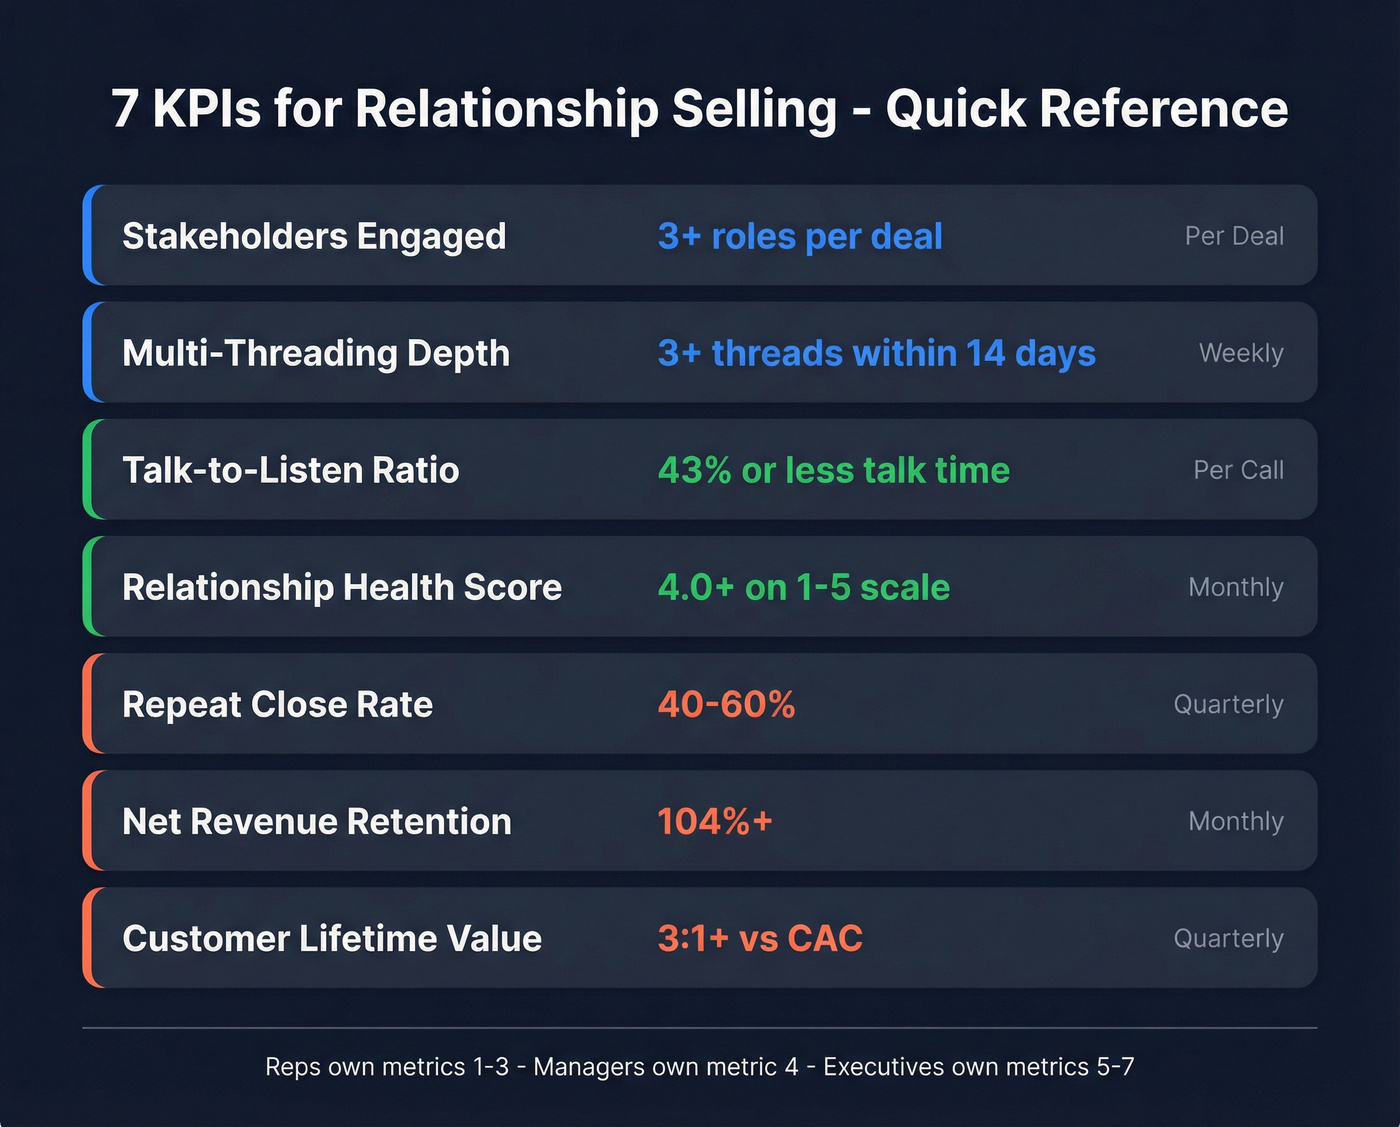
Who owns what: Reps own talk-to-listen ratio and stakeholder engagement. Managers track multi-threading depth and relationship health. Executives watch NRR and CLV. If everyone's staring at the same dashboard, nobody's accountable.
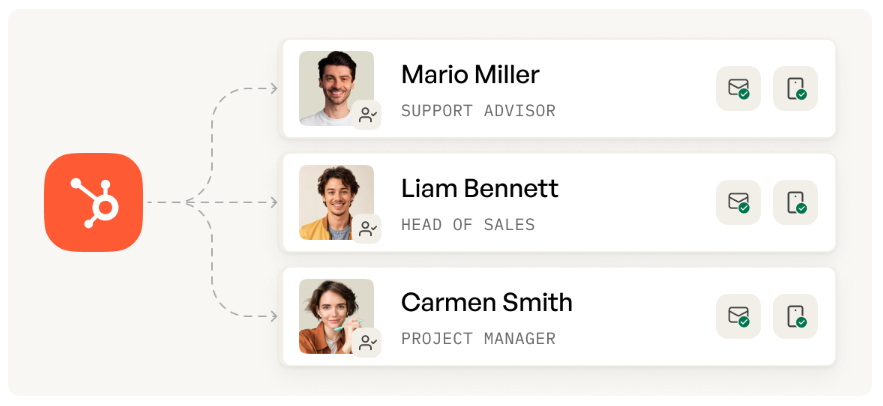
Multi-threading requires verified contact data for every stakeholder in the buying committee. Prospeo gives you 300M+ profiles with 98% email accuracy and 125M+ verified mobiles - refreshed every 7 days so you never reach out to someone who left the company last quarter.
Map the entire buying committee with contacts you can actually reach.
What to Stop Tracking
The consensus among relationship sellers on r/sales is blunt: "calls/emails/(or even walk-ins) are meaningless metrics to track." That's not a fringe opinion. It's the lived experience of people who sell on trust.
Activity volume metrics were designed for transactional motions where more at-bats equals more revenue. In relationship selling, 50 shallow calls produce less pipeline than 5 deep conversations where you understand what each stakeholder cares about personally. When you track activity volume for relationship sellers, you're measuring the speedometer on a boat that needs a depth finder.
Stop tracking raw call counts. Stop tracking emails sent. Start tracking whether your reps actually know who the economic buyer, the technical evaluator, and the end user are - and whether they've built real connections with each.
7 Metrics That Actually Work
1. Stakeholders Engaged per Deal
Use this if you're selling into accounts with 6+ decision-makers and your reps tend to single-thread deals through one champion. Skip this if your average deal involves a single buyer with full authority - rare in B2B, but it happens.
The target: 3+ active contacts across different roles within each deal, spanning the buying committee from executive sponsor to end user. If you're past discovery with only one thread, you're exposed. This metric also doubles as a reliable indicator for business relationship management, since it quantifies how broadly your team is investing in each account's decision-making network.
As an operational benchmark, Tier 1 accounts over $1M ARR warrant dedicated 1:1 coverage with 3+ hours per quarter of executive sponsorship. Tier 2 runs 1:5 CSM-to-account ratios. Below $250K, you're in tech-touch territory at 1:50+. Match your stakeholder investment to the account's value.
You can't multi-thread if you don't have verified contact data for each stakeholder. Prospeo covers 300M+ professional profiles with 98% email accuracy and a 7-day refresh cycle, so you're not reaching out to someone who left the company two months ago.
2. Multi-Threading Depth
Multi-threading means building relationships with multiple stakeholders in one account simultaneously. The minimum bar: 3+ active threads per account, with 2+ roles represented per meeting, and first multi-threaded engagement within 14 days of deal creation.
Teams that multi-thread consistently see win rates increase by 8-15 percentage points and sales cycles shorten by 15-30%. On a 90-day enterprise cycle, that's about 2-4 weeks recovered. The tradeoff is real though: expect 3-5 hours per week per account to maintain quality threads, which is why this metric pairs with stakeholder engagement. You need to be strategic about which accounts get the investment. Track threads per account, meeting depth by role, and time-to-first-multithread weekly.
If you’re building this motion, align it with account-based selling so reps invest in the right accounts.
3. Talk-to-Listen Ratio
This is a coaching metric, not a dashboard metric. But in our experience, it's one of the strongest proxies for relationship quality.
Top-closing B2B reps speak only 43% of the time, compared to 65% for average performers. That 22-point gap is the difference between a conversation and a monologue. Relationship selling lives in the listening - understanding what stakeholders care about, what keeps them up at night, what their internal politics look like. If your reps are talking more than they're listening, they're pitching, not building trust.
If you want to coach this systematically, pair it with a tighter discovery process and consistent sales communication.
4. Relationship Health Score
No universal formula exists, but you can build a simple weighted model that works. Dynamics 365 relationship analytics surfaces a health score and trend based on interaction patterns, which you can adapt into a DIY rubric.
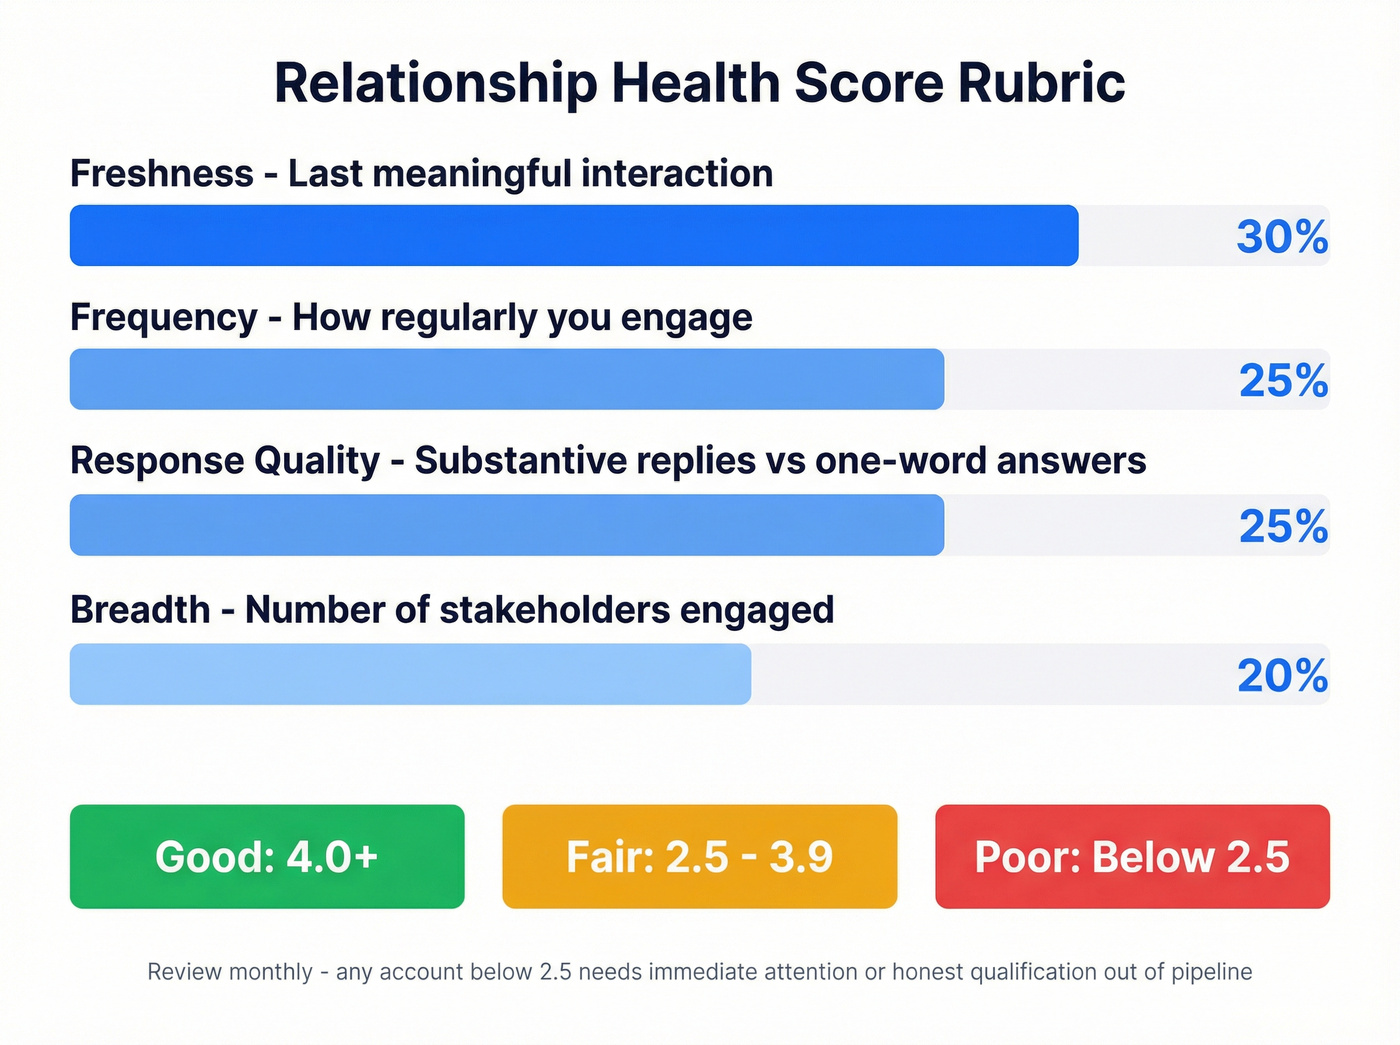
Score each dimension 1-5, then weight:
- Freshness (30%) - when was the last meaningful interaction? This is the single fastest signal of a dying relationship.
- Frequency (25%) - how regularly are you engaging?
- Response quality (25%) - are they replying substantively, or one-word answers?
- Breadth (20%) - how many stakeholders are you engaging?
Good is 4.0+, Fair is 2.5-3.9, Poor is below 2.5. Review monthly. Any account below 2.5 needs immediate attention or honest qualification out of the pipeline. Here's the thing: your health score is only as good as the data feeding it. If contacts have bounced emails or outdated phone numbers, the score becomes unreliable fast. Verify your contact data before trusting any relationship health metric.
If you’re operationalizing this, it helps to standardize pipeline health definitions so teams don’t argue about what “good” means.

5. Repeat Customer Close Rate
The average close rate across B2B sits around 20%. For repeat customers who already trust you, you should be closing 40-60%. If you're not hitting that range, your post-sale relationships are weaker than you think.
One stat that stings: nearly 7 out of 10 sellers don't follow up within 24 hours after pricing a customer who doesn't immediately buy. In relationship selling, that follow-up isn't a sales tactic - it's a signal that you care about the relationship beyond the transaction. We've seen teams boost repeat close rates by 15+ points just by instituting a mandatory same-day follow-up rule. Track repeat customer close rate separately from new business. The gap between the two tells you how much your relationships are actually worth.
To tighten this up, use a consistent sales follow-up workflow and measure follow-up email reply rate by segment.
6. Net Revenue Retention (NRR)
NRR = (Starting MRR + Expansion - Contraction - Churn) / Starting MRR x 100.
Let's be honest: NRR is the clearest signal of whether your company will still be healthy in five years. Everything else is a leading indicator. If NRR is below 100%, you're leaking faster than you're growing. For bootstrapped B2B SaaS companies in the $3M-$20M ARR range, the median NRR is 104% and the 90th percentile hits 118%. Gross revenue retention - which strips out expansion - runs median 92%, 90th percentile 98%.
A team with 118% NRR has built relationships that compound. A team at 95% is slowly dying regardless of how many new logos they sign.
If you need to diagnose the “why,” start with a structured churn analysis.
7. Customer Lifetime Value (CLV)
For subscription businesses: CLV = ARPA x Gross Margin % / Monthly Churn Rate.
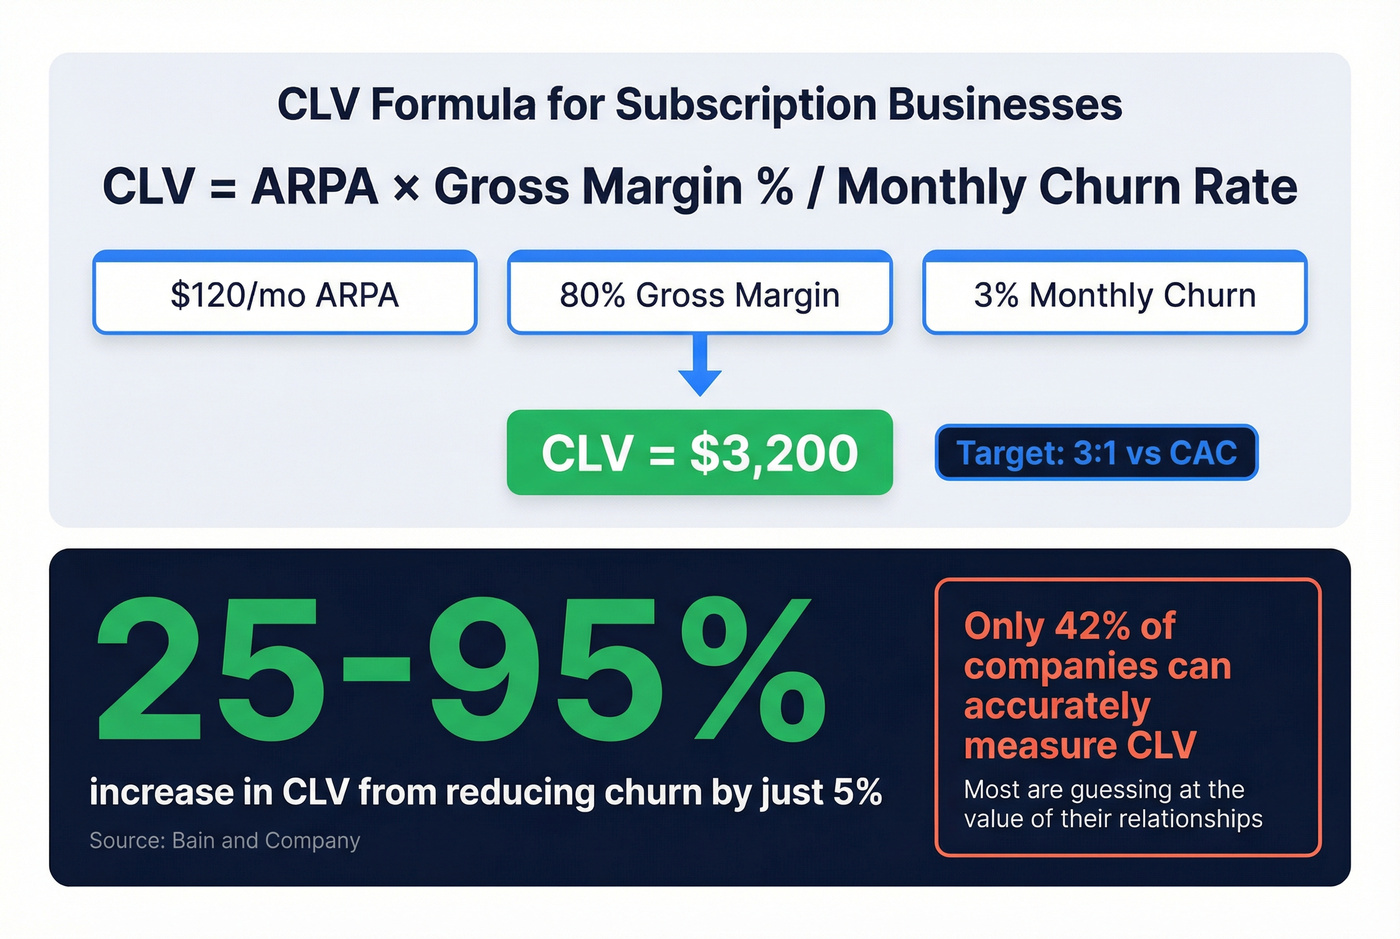
Worked example: $120/month ARPA, 80% gross margin, 3% monthly churn = CLV of roughly $3,200. That number should be at least 3:1 against your CAC. If it's not, you're either acquiring too expensively or churning too fast - both are relationship problems at their core.
The Bain & Company finding that reducing churn by just 5% increases CLV by 25-95% is the single best argument for investing in relationship selling. Only 42% of companies can accurately measure CLV, which means most are guessing at the value of their relationships. Don't be one of them.
To keep CLV honest, make sure you’re also tracking cost to acquire customer the same way across teams.
Quick-Reference KPI Table
| Metric | Definition | Target | Frequency |
|---|---|---|---|
| Stakeholders engaged | Active contacts per deal | 3+ roles | Per deal |
| Multi-threading depth | Threads per account | 3+, within 14 days | Weekly |
| Talk-to-listen ratio | Rep talk time % | 43% or less | Per call |
| Relationship health | Weighted composite (1-5) | 4.0+ | Monthly |
| Repeat close rate | Repeat wins / repeat opps | 40-60% | Quarterly |
| NRR | See formula above | 104%+ | Monthly |
| CLV | ARPA x Margin / Churn | 3:1+ vs CAC | Quarterly |
Your relationship health score is only as reliable as the data behind it. Stale emails and wrong numbers create false signals that tank your pipeline. Prospeo's 7-day refresh cycle and 5-step verification keep every contact current - so your KPIs measure real relationships, not dead connections.
Stop tracking relationships built on outdated data.
FAQ
How many KPIs should I track for relationship selling?
Five to seven, maximum. Focus on stakeholder depth, relationship health, and retention metrics like NRR and CLV. More than that dilutes focus and pushes reps back toward gaming activity numbers instead of building genuine connections. Pick the metrics that match your sales motion and ignore the rest.
How do relationship selling KPIs differ from transactional sales KPIs?
Transactional KPIs measure speed and volume - calls made, conversion rate, time-to-close. Relationship-focused metrics measure depth and trust: stakeholders engaged, multi-threading coverage, talk-to-listen ratio, and NRR. Optimizing for volume in a relationship motion actively undermines the trust-building that closes complex deals.
How do I get accurate contact data for every stakeholder in a deal?
Use a verified B2B data platform to find emails and direct dials for each role in the buying group. With 98% email accuracy and a 7-day data refresh cycle, you're working with current records - not stale contacts that bounce and damage your domain reputation. Upload your account list, filter by role, and export verified contacts in minutes.