Lead Generation KPIs: What to Track, What to Aim For, and What Most Guides Get Wrong
79% of marketing leads never convert into sales. That's not a data problem - it's a measurement problem. Most teams track too many lead generation KPIs, track the wrong ones, or track the right ones with bad data underneath. The result is a dashboard full of green metrics and a pipeline full of nothing.
61% of marketers say generating quality leads is their top challenge. Not leads - quality leads. That's where most KPI guides fall apart: flat lists with no hierarchy, no benchmarks, and no opinion on what actually moves pipeline.
You don't need 15 metrics. You need five good ones and the discipline to act on them.
The 5 KPIs That Actually Matter
If you can only track five things, track these. Everything else is supporting context.
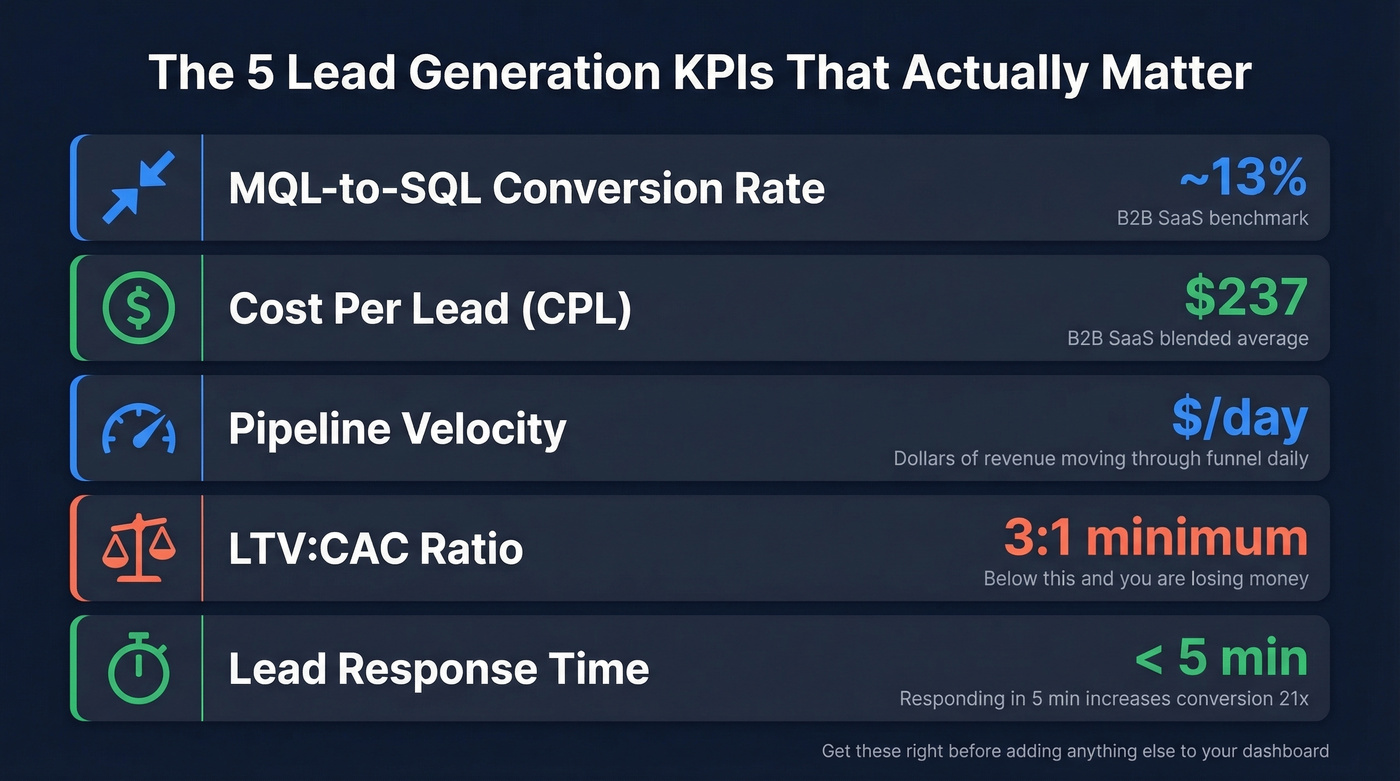
- MQL-to-SQL conversion rate - Are marketing leads turning into sales conversations? B2B SaaS benchmark: ~13%.
- Cost per lead (CPL) - What are you paying per lead, blended across channels? B2B SaaS benchmark: $237.
- Pipeline velocity - How fast does revenue move through your funnel? Measured in dollars per day.
- LTV:CAC ratio - Are customers worth more than it costs to acquire them? Minimum viable ratio: 3:1.
- Lead response time - How fast does sales follow up? The 5-minute rule: responding within 5 minutes increases conversion up to 21x.
Get these right before you add anything else to your dashboard.
Organize KPIs by Funnel Stage
Every "top 10 KPIs" article gives you a numbered list. That's lazy. Metrics exist at different points in your funnel, and lumping them together obscures what's actually broken.
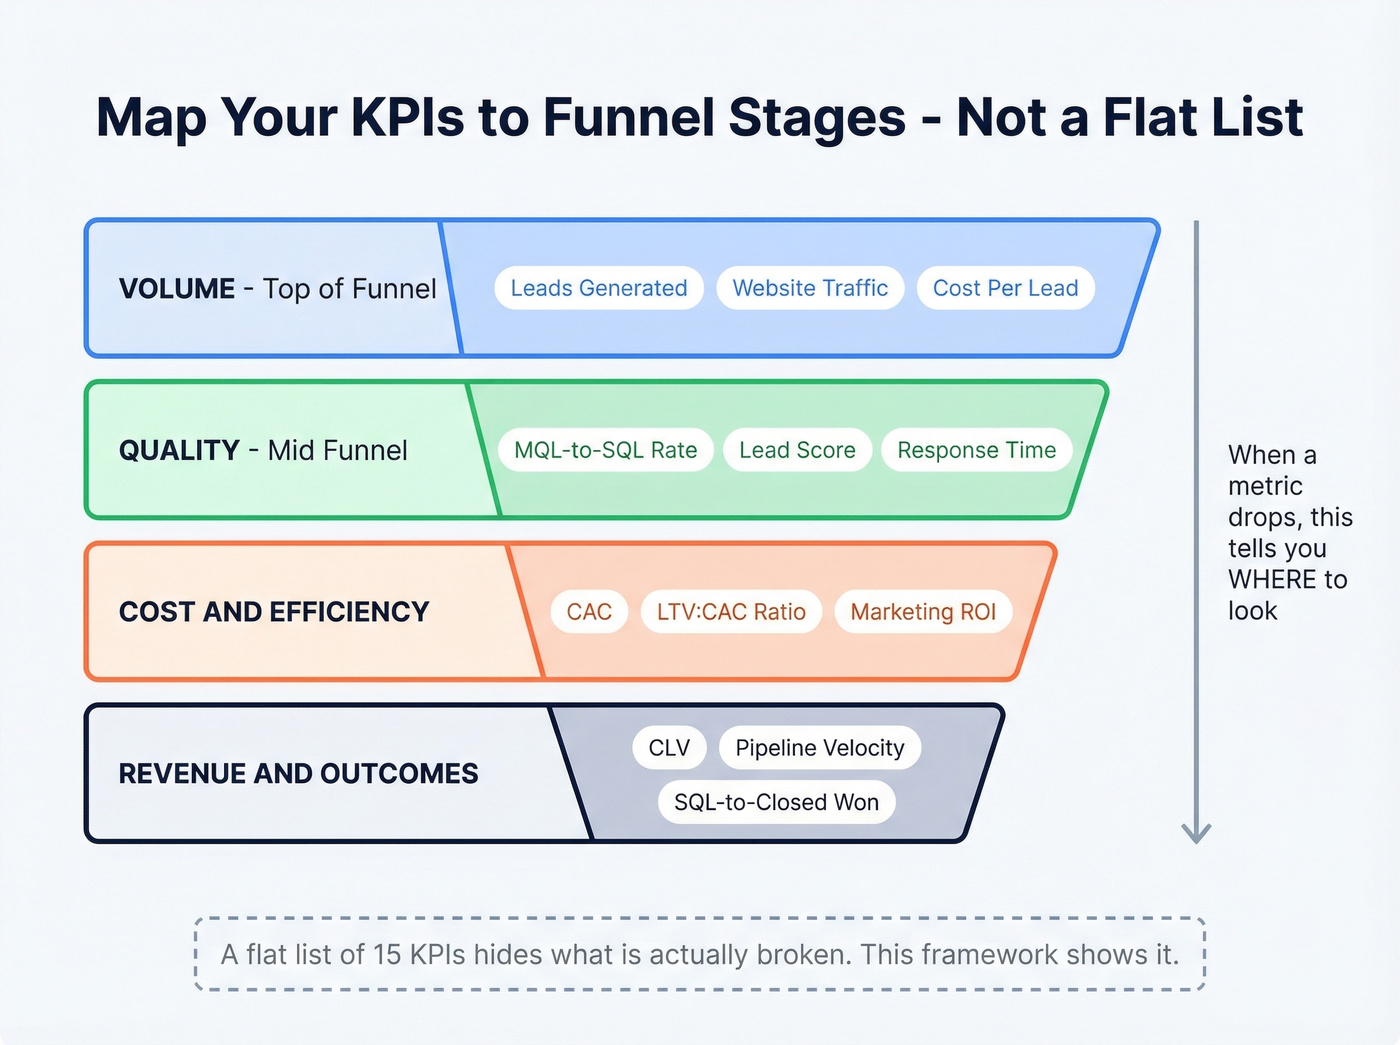
Here's a better framework - four categories mapped to where they live:
- Volume at the top of funnel - Are you generating enough raw leads?
- Quality at mid-funnel - Are those leads converting into real opportunities?
- Cost & Efficiency - Are you spending wisely to acquire them?
- Revenue & Outcomes - Is all of this turning into money?
When a metric drops, this framework tells you where to look. A flat list doesn't.
Volume KPIs - Top of Funnel
Leads Generated
Total leads generated is the metric everyone starts with and the one most likely to mislead you. Raw volume is a vanity metric unless it's paired with quality indicators downstream. Generating 10,000 leads means nothing if your MQL-to-SQL rate is 3%. Track it, but don't optimize for it in isolation.
Website Traffic & Sessions
Same story. Traffic matters only in context of what it converts. A page getting 50,000 visits and converting at 0.2% is worse than a page getting 2,000 visits at 8%. Always tie traffic metrics to conversion rate - sessions alone tell you almost nothing about pipeline health.
Cost Per Lead
CPL is where volume metrics start getting useful. The formula is simple: total campaign spend divided by total leads generated. The average B2B CPL across all channels is $84, but that number hides enormous variation by industry and channel, which is why a single average is dangerous to benchmark against.
Here's what CPL actually looks like across industries:
| Industry | Paid CPL | Organic CPL | Blended |
|---|---|---|---|
| B2B SaaS | $310 | $164 | $237 |
| Cybersecurity | $411 | $404 | $406 |
| Financial Services | $761 | $555 | $653 |
| IT & Managed Services | $617 | $385 | $503 |
| eCommerce | $98 | $83 | $91 |
| Manufacturing | $691 | $415 | $553 |
The spread by channel is just as dramatic. SEO averages $31 per lead, email marketing runs about $53, Google Ads hits $70.11, and LinkedIn pushes $110+. If you're running LinkedIn ads into a market where your blended CPL should be under $100, you've got a channel allocation problem, not a lead gen problem.
Quality KPIs - Mid-Funnel
This is where most teams lose the thread. Volume looks fine, but nothing converts. Quality metrics tell you why.
MQL-to-SQL Conversion Rate
MQL-to-SQL is the single most revealing metric in your lead generation KPIs stack. It answers one question: do marketing and sales agree on what a qualified lead looks like? If this number is below 10%, you've got a misalignment problem - and 41% of B2B marketers report exactly that difficulty.
A recurring frustration on r/sales and r/LeadGeneration is marketing teams celebrating lead volume while sales reps complain about junk in their queue. That disconnect shows up directly in this metric. Here are industry benchmarks to calibrate against:
| Industry | MQL-to-SQL Rate |
|---|---|
| B2B SaaS | 13% |
| Cybersecurity | 15% |
| Financial Services | 13% |
| Fintech | 11% |
| eCommerce | 23% |
| Business Insurance | 26% |
| HVAC | 26% |
If you're in B2B SaaS and your MQL-to-SQL rate is 6%, don't blame sales for not closing. Your lead quality is the problem.
Lead Scoring Framework
A scoring model turns subjective "lead quality" into something measurable. Here's a practical rubric we've seen work well across dozens of B2B teams:
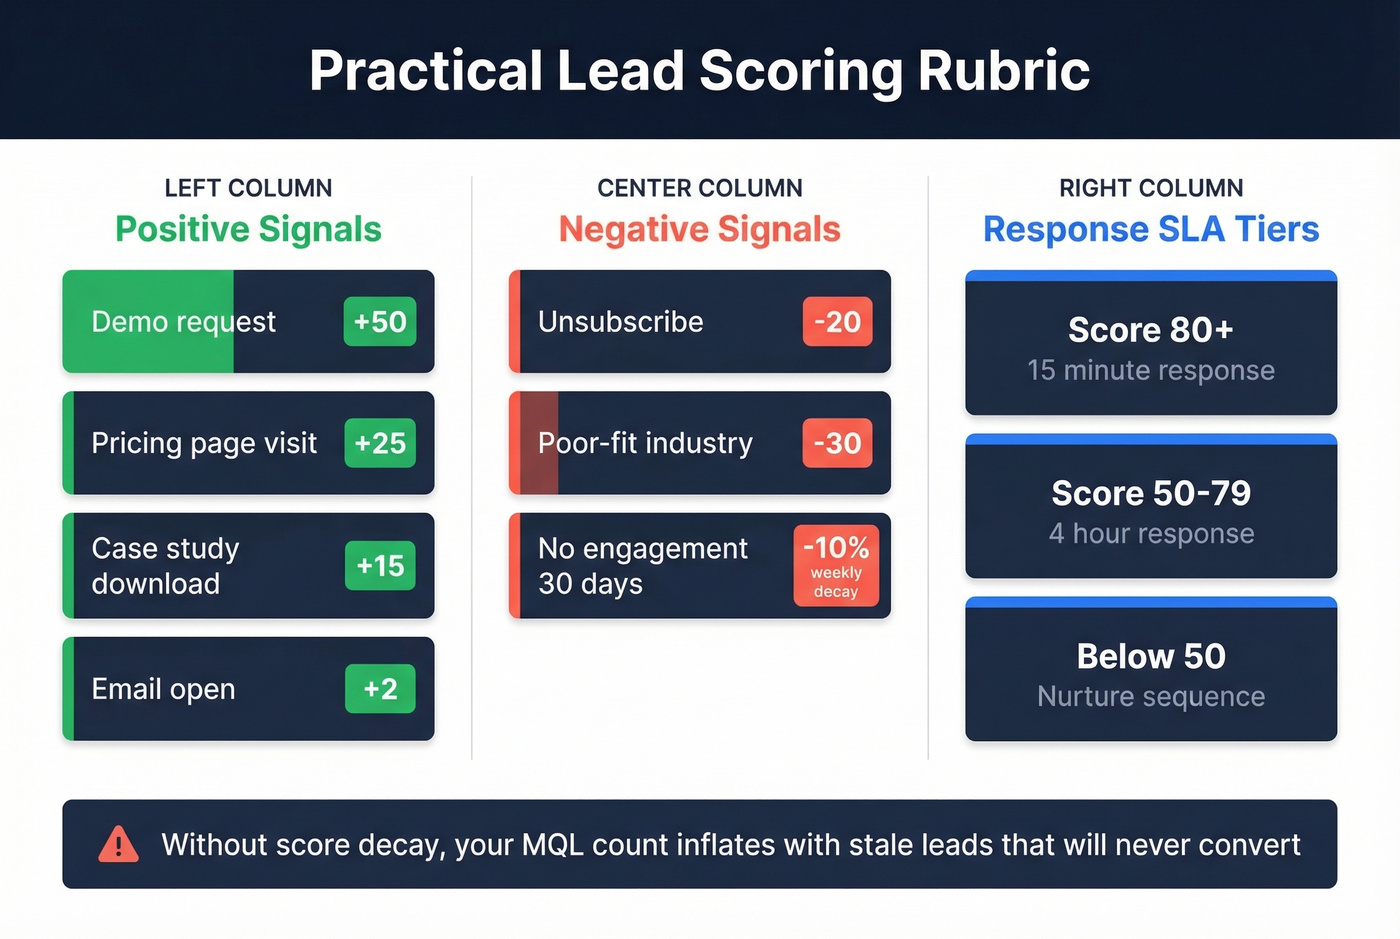
Positive signals:
- Demo request: +50
- Pricing page visit: +25
- Case study download: +15
- Email open: +2
Negative signals:
- Unsubscribe: -20
- Poor-fit industry: -30
- No engagement in 30 days: score decays by 10% weekly
The decay mechanic is critical. A lead who downloaded a whitepaper six months ago isn't the same as one who visited your pricing page yesterday. Without decay, your MQL count inflates with stale leads that'll never convert. For a deeper dive on building these models, MarTech.org's lead scoring guide is worth bookmarking.
Here's the thing: your scoring model is only as good as your data. If your bounce rate is 35%, your MQL count is fiction - you're scoring contacts who don't exist at valid addresses. Verify contact data before you score it. Prospeo's 98% email accuracy and 7-day refresh cycle ensures the leads entering your funnel are real people at real companies, not dead addresses inflating volume metrics.
Lead Response Time
Speed kills - in a good way. Responding within 5 minutes increases conversion up to 21x compared to waiting 30 minutes. Cognism's internal target is under 3 minutes, with a goal of 70% of inbound requests resulting in an outcome.
Build SLA tiers based on lead score:
| Lead Score | Response SLA |
|---|---|
| 80+ | 15 minutes |
| 50-79 | 4 hours |
| Below 50 | Nurture sequence |
If your average response time is measured in hours, you're leaving pipeline on the table every single day.
Your MQL-to-SQL rate tanks when 35% of leads bounce. Prospeo's 98% email accuracy and 7-day data refresh cycle mean every lead entering your scoring model is a real person at a verified address - not a dead contact inflating your funnel metrics.
Stop measuring KPIs built on bad data. Start with verified contacts.
Cost & Efficiency KPIs
Customer Acquisition Cost
CAC = total sales and marketing spend divided by new customers acquired. If you spent $200,000 last quarter across sales salaries, ad spend, tools, and content - and closed 40 new customers - your CAC is $5,000.
Simple formula, but most teams get it wrong by excluding costs. Sales salaries, tool subscriptions, content production, agency fees - all of it goes in the numerator. In our experience, teams undercount spend by 20-30% on average, which makes them think they're more efficient than they are. If your CAC calculation doesn't make you slightly uncomfortable, you're probably leaving something out.
If you want a deeper breakdown, see our guide to CAC.
LTV:CAC Ratio
The 3:1 rule is the floor. If your customer lifetime value is $15,000 and your CAC is $5,000, you're at 3:1 - viable but not comfortable. Below 3:1 means you're spending more to acquire customers than they're worth over their lifetime. Above 5:1 and you're probably underinvesting in growth.
Businesses using AI for lead generation report 50% more sales-ready leads and up to 60% lower CAC. That's a meaningful efficiency lever if your ratio is tight.
Marketing ROI
Marketing ROI = (revenue attributed to marketing minus marketing cost) divided by marketing cost, times 100. If marketing spent $100,000 and influenced $400,000 in closed revenue, that's a 300% ROI. Track this monthly, but don't obsess over attribution models - directional accuracy matters more than decimal precision.
Revenue & Outcome KPIs
Customer Lifetime Value
CLV = average purchase value times average purchase frequency times average customer lifespan. For a SaaS company with $500/mo contracts and 24-month average retention, that's $12,000 CLV. This number anchors your entire CAC calculation - get it wrong and every efficiency metric downstream is unreliable.
Pipeline Velocity
Pipeline velocity is the most underrated metric in any lead generation KPIs framework. It measures how fast revenue moves through your funnel, in dollars per day.
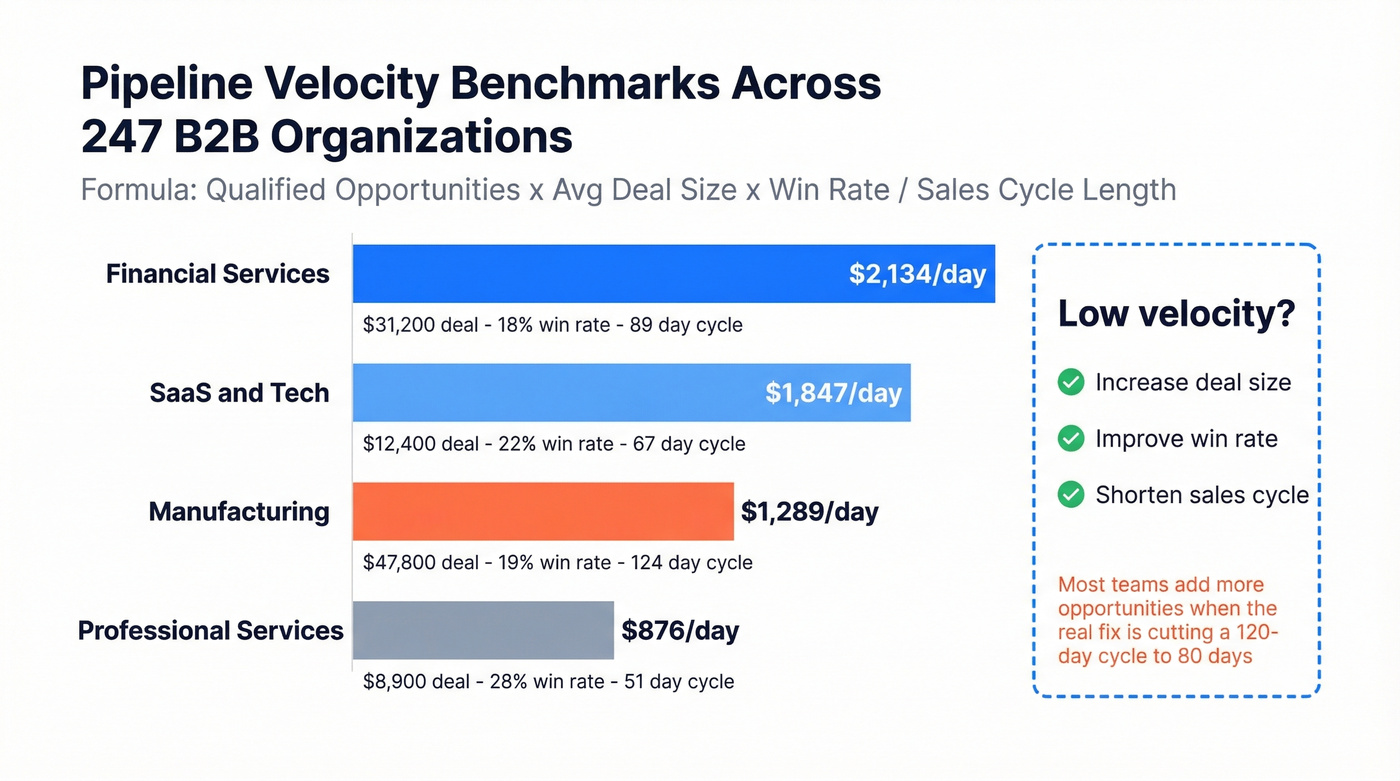
Formula: Qualified Opportunities x Average Deal Size x Win Rate / Sales Cycle Length
Here are benchmarks across 247 B2B organizations:
| Segment | Avg Deal | Win Rate | Cycle | Velocity |
|---|---|---|---|---|
| SaaS & Tech | $12,400 | 22% | 67 days | $1,847/day |
| Financial Services | $31,200 | 18% | 89 days | $2,134/day |
| Manufacturing | $47,800 | 19% | 124 days | $1,289/day |
| Professional Services | $8,900 | 28% | 51 days | $876/day |
The power of this metric is that it shows you exactly which lever to pull. Low velocity? Either increase deal size, improve win rate, or shorten your sales cycle. Most teams focus on generating more opportunities when the real problem is a 120-day sales cycle that should be 80.
If your average deal size sits below five figures, pipeline velocity matters more than almost any other metric on this list. At low ACVs, you can't afford long sales cycles or low win rates - the math just doesn't work.
SQL-to-Closed Won Rate
For bottom-of-funnel calibration, Financial Services closes at 16% and Fintech at 14% from SQL to closed-won. If you're significantly below your industry benchmark here, the problem is usually in your sales process, not your lead gen.
Teams that track pipeline metrics weekly see 34% revenue growth and 87% forecast accuracy, compared to 11% growth and 52% accuracy for teams that review ad-hoc. Weekly cadence isn't optional.
Outbound-Specific KPIs
Outbound plays by different rules. SEO leads close at 14.6% versus 1.7% for outbound, which means outbound needs its own metric set with different baseline expectations.
Track these:
- Response rate - the percentage of prospects who reply to your outreach. This is your primary signal of message-market fit.
- Meeting booking rate - replies that convert to scheduled calls. If response rate is healthy but bookings are low, your qualification or CTA is off.
- Show rate - expect 30-60% depending on segment and how well you confirm. Below 30% means your meetings aren't perceived as valuable enough to keep.
- Opportunity-to-closed-won rate - the ultimate outbound efficiency metric.
Skip these (or deprioritize):
Open rates on cold email are unreliable due to privacy features and bot opens. Track them directionally, but don't optimize around them. Raw send volume is a vanity metric too - sending 10,000 emails that bounce at 15% is worse than sending 2,000 that land at 98%.
If you're tightening outbound performance, use proven sales prospecting techniques and keep an eye on email deliverability so your KPIs reflect reality.
Lead drop-off and churn through each stage matter more than any single top-of-funnel metric. Map where prospects fall out and you'll find your real bottleneck.
Build Your KPI Dashboard
Your dashboard should answer five questions at a glance: Are we generating enough MQLs? Which campaigns produce the most qualified leads? Where do leads come from? Where do they leak out of the funnel? Are trends improving or declining?
Cap your dashboard at 10-12 KPIs. More than that creates analysis paralysis. Fewer than five and you're flying blind. We've found that teams tracking more than 12 metrics end up effectively tracking none - the dashboard becomes wallpaper that nobody reads.
Tool options by budget:
Looker Studio and Google Sheets are both free and perfectly adequate for teams under 20 people. For a practical build, pull your CRM data into Google Sheets using a connector like Coefficient, create column charts for leads per month and gauge charts for won/lost/open deals, then move everything to a dedicated dashboard tab. You can have a functional KPI dashboard in about an hour.
HubSpot's free CRM works well if you're already in their ecosystem, and their Marketing Hub at around $800/mo adds full reporting. Power BI at roughly $10/user/mo is strong for teams on Microsoft infrastructure. Tableau at around $70/user/mo is the enterprise option for complex data environments.
Automate your data refresh. Manual entry is how dashboards die. Set alerts for sudden drops - a 20% CPL spike or a halved MQL-to-SQL rate should trigger investigation, not wait for the next quarterly review.
If forecasting is a priority, consider dedicated sales forecasting solutions once your core metrics are stable.
5 Mistakes That Waste Your Budget
1. Optimizing for volume over quality. 10,000 leads with an 8% MQL-to-SQL rate isn't a lead gen success - it's a lead quality failure. Volume without conversion is just expensive noise.
2. Measuring vanity metrics. Pageviews, PDF downloads, and social impressions feel good in a slide deck. They tell you nothing about pipeline. Tie every metric to a revenue outcome or drop it.
3. Slow follow-up. Conversion drops dramatically after one hour. After 24 hours, the opportunity is effectively gone. If your average lead response time is measured in days, you're burning money on lead gen that sales never touches in time. If you need copy you can deploy fast, use these sales follow-up templates.
4. No segmentation. A VP of Engineering and a marketing coordinator shouldn't get the same score, the same sequence, or the same follow-up SLA. Segment by role, industry, and channel - or your averages will hide the signal. Start with an ideal customer profile and refine from there.
5. Bad data corrupting every metric downstream. This one drives us crazy. Keep bounce under 5% or your CPL and CAC are lying to you - you're paying for leads that don't exist. Run your list through a verification tool like Prospeo before you trust any conversion metric. Teams like Snyk cut their bounce rate from 35-40% to under 5% after switching, and their AE-sourced pipeline jumped 180%.
Paying $237 per B2B SaaS lead? Your CPL explodes when you're acquiring contacts that never convert because the data is stale. Prospeo delivers verified emails at $0.01 each with a 92% enrichment match rate - so every dollar you spend on acquisition actually reaches a real buyer.
Cut your cost per lead by starting with data that actually connects.
FAQ
What are lead generation KPIs?
Lead generation KPIs are measurable indicators that show whether your lead gen efforts produce pipeline and revenue - not just activity. The most diagnostic metric for most B2B teams is MQL-to-SQL conversion rate, which reveals whether marketing and sales agree on lead quality. If yours is below 10%, fix alignment before optimizing anything else.
How often should I review lead gen KPIs?
Weekly. Teams tracking pipeline metrics weekly see 34% revenue growth and 87% forecast accuracy, compared to 11% growth and 52% accuracy for ad-hoc reviews. Set a standing 30-minute weekly review and protect it like a customer call.
How do I make sure my KPI data is accurate?
Keep email bounce rate under 5% so every downstream metric - CPL, CAC, conversion rates - reflects real, reachable contacts. Clean your contact data with a verification tool before measuring anything else. That single step changes everything about the reliability of your dashboard.
What's a good MQL-to-SQL rate for B2B SaaS?
The 2026 benchmark for B2B SaaS is approximately 13%. Below 10% signals a lead quality or sales-marketing alignment problem. Above 20% is strong - but also check that your MQL definition isn't too restrictive, which can artificially inflate the ratio while starving pipeline volume.