How to Calculate Lead Generation ROI (And What Good Actually Looks Like)
Your CMO says CPL is down. Your CFO says revenue is flat. Somewhere between those two dashboards, money is disappearing - and nobody can explain who owns the number. The average cost per lead across all industries is $198.44, but that number is meaningless if you can't trace it to closed-deal revenue.
Here's what you need to fix that: the real formula (not ROAS mislabeled as ROI, a mistake more teams make than you'd think), what "good" actually looks like in 2026, and the fastest fix most teams overlook. If a third of your emails bounce, your CPL is fiction and your return calculation is built on sand.
You'll need four inputs before you start: a revenue window, a full cost basis, an attribution rule, and your conversion rates at each funnel stage (see funnel stage tracking).
The Real ROI Formula (ROI vs. ROAS)
The formula is simple. Applying it honestly is the hard part.
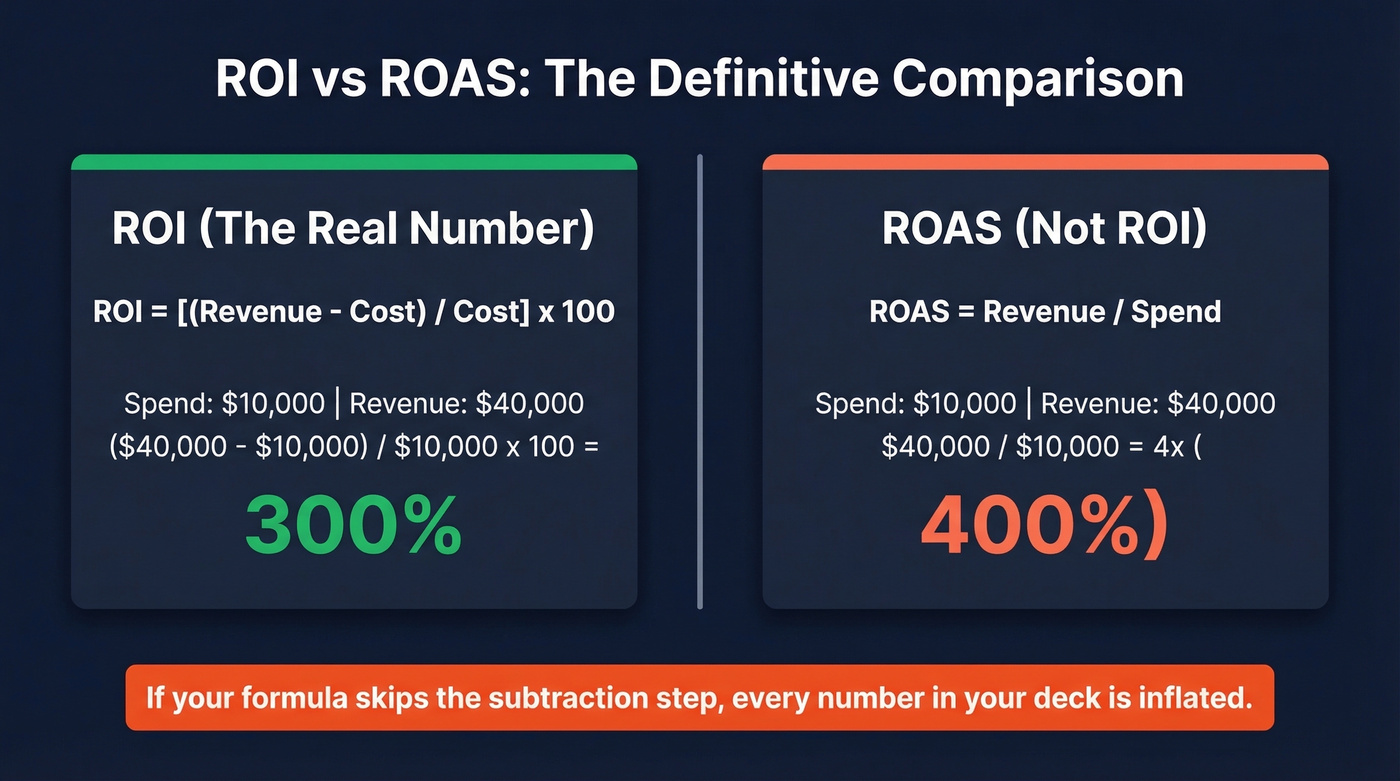
ROI (%) = [(Revenue - Cost) / Cost] x 100
Worked example: you spend $10,000 on a cold email campaign. It generates $40,000 in closed revenue. Your ROI is [($40,000 - $10,000) / $10,000] x 100 = 300%.
One critical distinction: this isn't revenue / spend. That's ROAS (return on ad spend). ROAS for this same campaign would be 4x or 400% - a completely different number that makes your results look better than they are. One widely-circulated LinkedIn ads ROI walkthrough divides revenue by spend without subtracting costs and calls it ROI. It's not. If your reporting tool skips the subtraction step, every number in your deck is inflated.
ROI Doesn't Care About CPL
CPL tells you what a lead costs. ROI tells you what a customer costs - and whether that cost is worth it. The bridge between those two numbers is where most teams lose the plot, especially when tracking leads to closed-won deals across a multi-touch funnel (use a consistent lead generation workflow to avoid leaks).
Here's a realistic funnel walkthrough:
| Stage | Metric | Value |
|---|---|---|
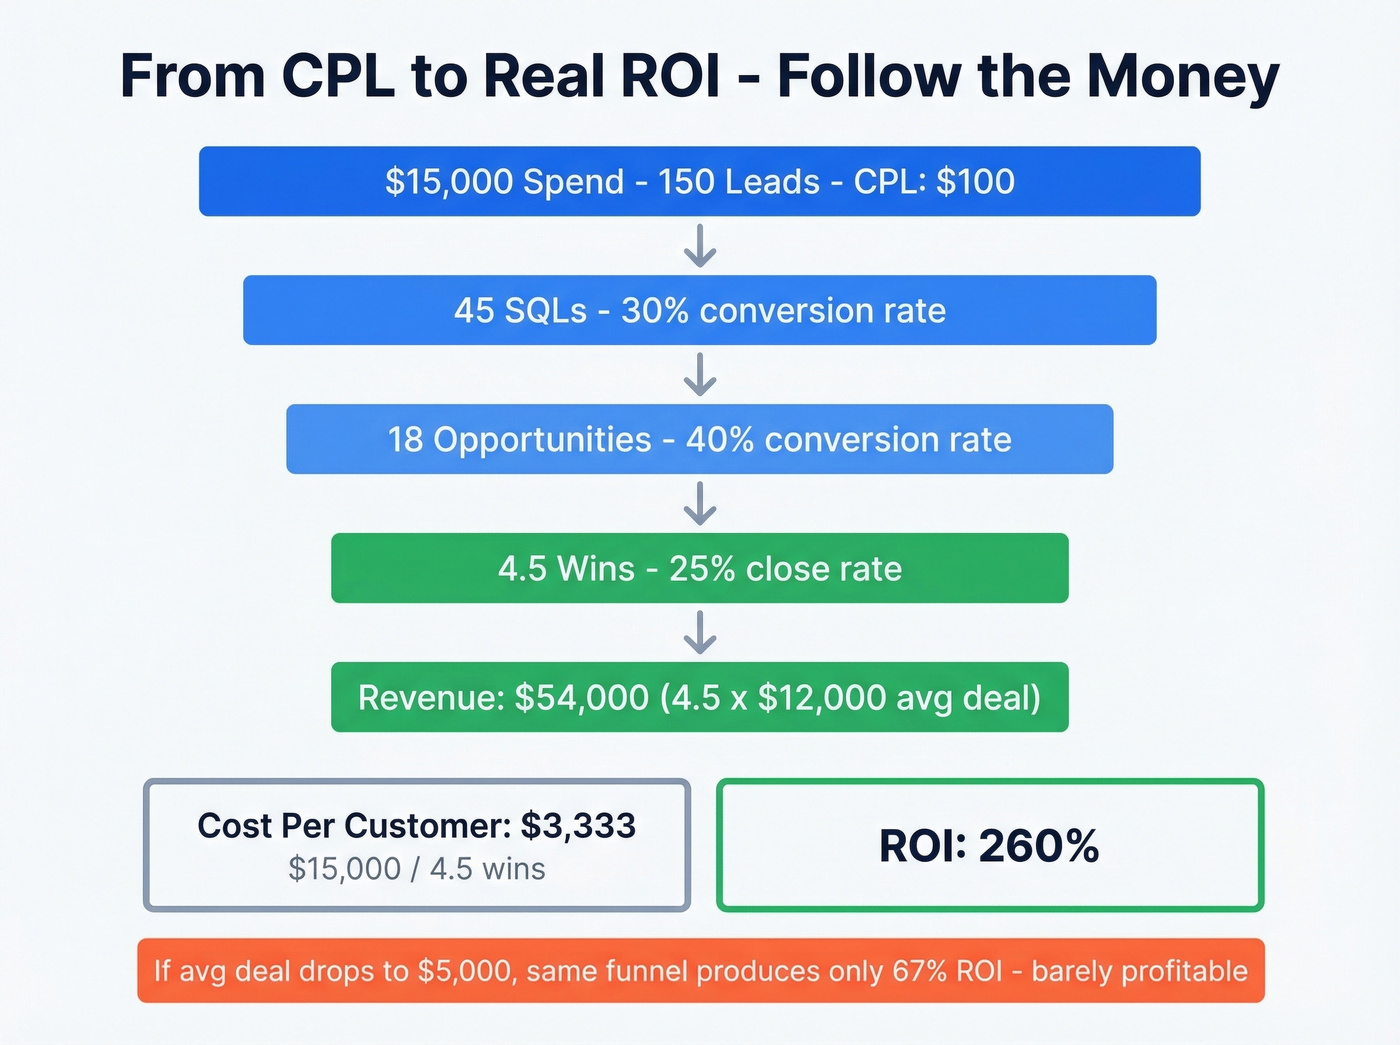
| Spend | Campaign budget | $15,000 |
| Leads generated | 150 | |
| CPL | $100 | |
| Lead to SQL rate | ~30% | 45 SQLs |
| SQL to Opportunity | ~40% | 18 opps |
| Opportunity to Close | ~25% | 4.5 wins |
| Avg. deal size | $12,000 | |
| Revenue | $54,000 | |
| ROI | 260% |
That $100 CPL looks cheap. But your cost per customer is $3,333 ($15,000 / 4.5 wins). If your average deal is $5,000 instead of $12,000, the same funnel produces 67% ROI - barely profitable. CPL is a vanity metric. Cost per customer is the number that matters (and it should ladder into your CAC model).
Why Timeframe Changes Everything
In Hinge's analysis, a Google Ads campaign shows ~25% ROI in year one but 2,000%+ when measured on lifetime value. That's not a rounding error. It's the difference between killing a profitable channel and doubling down on it.
The classic heuristic: your allowable customer acquisition cost should be roughly 10% of customer lifetime value. If your average customer is worth $4,800 over their lifetime, you can afford to spend $480 acquiring them. Some high-growth companies push that to 15-20%, but 10% is the safe floor.
Report both numbers to stakeholders - this-year ROI for budget conversations, lifetime ROI for strategy conversations. They tell different stories, and both matter.
2026 B2B Benchmarks by Channel and Industry
The benchmark sources below include a CPL-by-industry dataset collected January 2022 through June 2025 (updated May 2025), and an ROI-by-channel dataset covering Q1 2020 through Q4 2025 (posted February 2025).
CPL by Industry
These numbers come from First Page Sage's dataset spanning January 2022 through June 2025 - one of the most transparent CPL benchmark studies available.
| Industry | Blended CPL | Paid CPL | Organic CPL |
|---|---|---|---|
| B2B SaaS | $237 | $310 | $164 |
| Financial Services | $653 | $761 | $555 |
| Healthcare | $361 | $401 | $320 |
| Legal Services | $649 | $784 | $516 |
| IT & Managed Services | $503 | $617 | $385 |
| eCommerce | $91 | $98 | $83 |
The gap between paid and organic CPL is striking. In B2B SaaS, organic leads cost roughly half what paid leads cost. That delta compounds fast at scale.
CPL by Channel
Industry averages only tell part of the story. Channel-level CPL ranges paint a sharper picture:
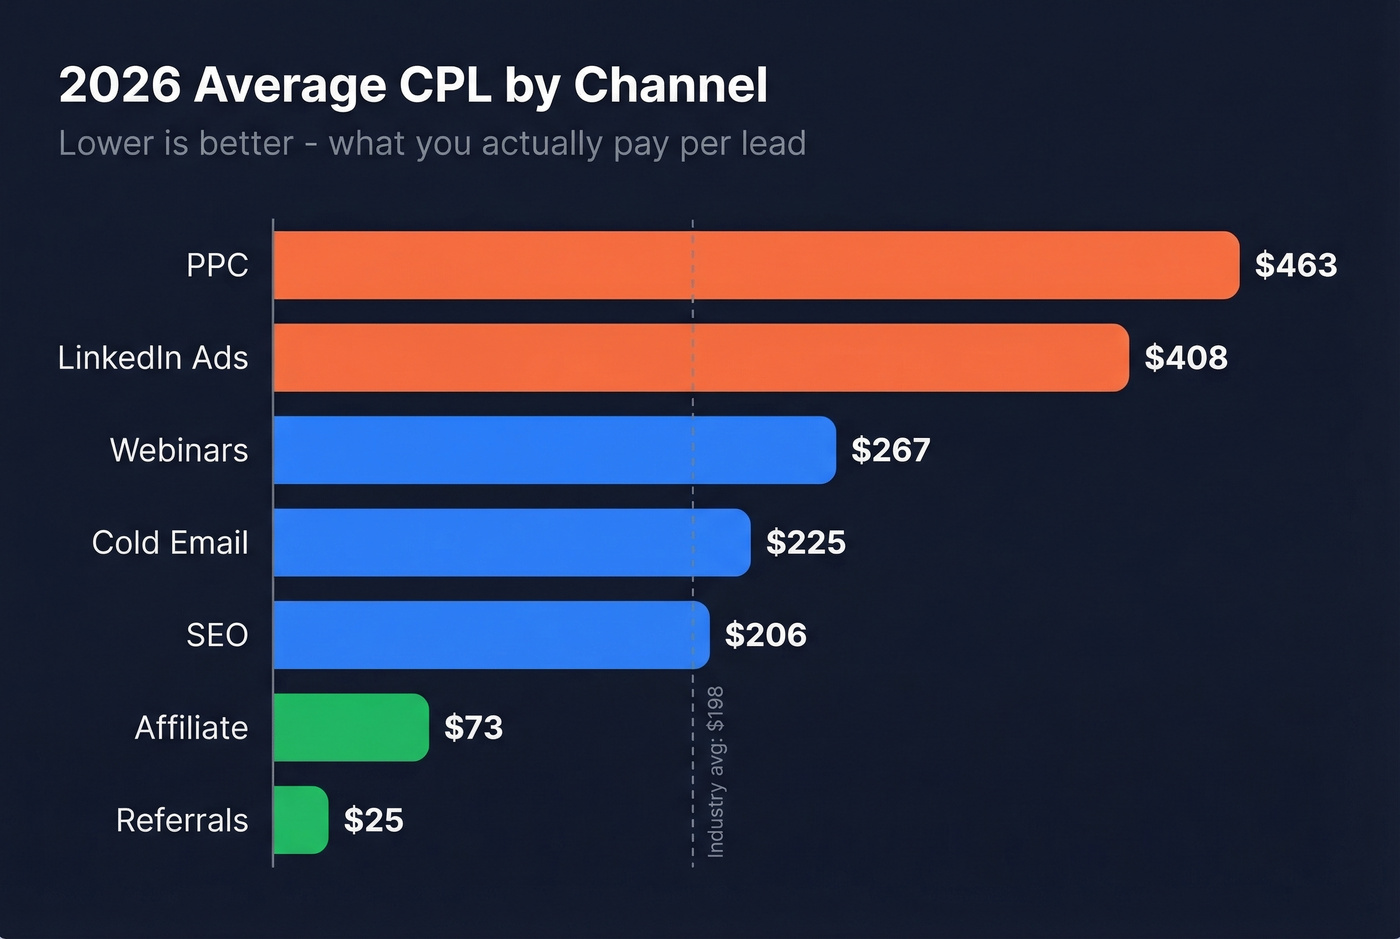
- PPC: $175-$751 per lead (avg ~$463)
- Paid LinkedIn ads: $15-$800+ per lead (avg ~$408)
- Webinars: $33-$500 per lead (avg ~$267)
- Cold email: $150-$300 per lead (avg ~$225) (see cold email marketing benchmarks)
- SEO: $14-$397 per lead (avg ~$206)
- Affiliate marketing: $54-$92 per lead (avg ~$73)
- Referrals: ~$25 per lead
ROI by Channel
First Page Sage uses a hybrid attribution model - 60% credit to first touch, 40% split across remaining channels - across campaigns averaging 2.7 years.
| Channel | B2B ROI |
|---|---|
| SEO | 748% |
| Webinars | 430% |
| Email Marketing | 261% |
| LinkedIn Paid | 229% |
| SEM/PPC | 36% |
SEO is the highest-ROI B2B lead gen channel, and it's not close. The catch: it needs 4-6 months to show meaningful returns, which is why impatient teams default to paid and then wonder why their blended returns are mediocre.
Let's be honest about PPC at 36% ROI: it isn't terrible if you need pipeline this quarter. But if PPC is your primary channel and you're not investing in SEO alongside it, you're paying permanent rent on leads that could cost a fraction of the price in 12 months. Most B2B teams with deal sizes under $10K don't need expensive paid channels - they need better organic infrastructure and cleaner data (start with lead generation metrics that tie to revenue).
One r/sales thread captures this well: a B2B marketer shared that a single event generated $30M ROI from just 1,200 registrations. Stakeholders obsess over lead volume, but intent-rich leads from the right channel will crush a high-volume, low-intent campaign every time.
A 35% bounce rate doesn't just waste emails - it inflates your CPL and destroys your ROI calculation. Prospeo's 5-step verification delivers 98% email accuracy, cutting bounce rates below 4%. At $0.01 per email, your cost per customer drops and your real ROI climbs.
Stop calculating ROI on leads that never land in an inbox.
Mistakes That Wreck Your Numbers
Calling ROAS "ROI"
If your formula doesn't subtract costs in the numerator, you're calculating ROAS. It makes results look better than they are, and every downstream decision built on that number is wrong. We've audited client dashboards where the "ROI" metric was actually ROAS - and the real return was 40% lower than what leadership had been seeing for months.
Last-Click Attribution Bias
Last-click gives 100% credit to whatever the prospect touched before converting. That overvalues closing channels (demo pages, retargeting ads) and undervalues the awareness and nurture touches that actually created the opportunity. This is especially damaging when you're trying to measure demand generation ROI, where top-of-funnel programs create pipeline that only converts months later (compare common attribution models before you commit).
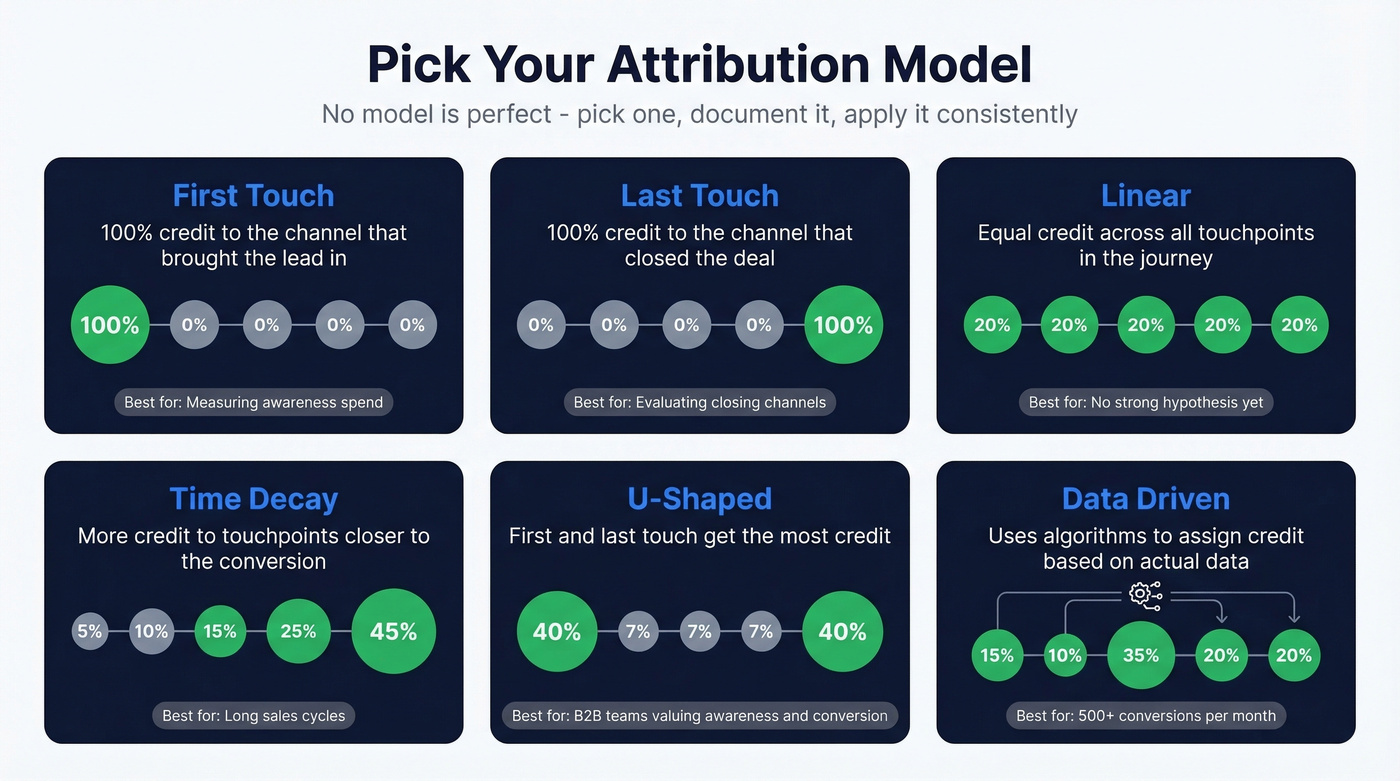
Here's a quick menu of attribution models:
- First-touch - 100% credit to the channel that brought the lead in. Best for measuring awareness spend.
- Last-touch - 100% credit to the final interaction before conversion. Best for evaluating closing channels.
- Linear - Equal credit across every touchpoint. Best when you have no strong hypothesis about what's working.
- Time-decay - More credit to recent touches, less to early ones. Best for long sales cycles where recency matters.
- U-shaped (position-based) - 40% to first touch, 40% to lead conversion, 20% split across the middle. Best for B2B teams that value both awareness and conversion.
- Data-driven - Algorithmic, based on your actual conversion data. Best if you have enough volume (500+ conversions/month) to train the model.
No model is perfect. Pick one, document it, and apply it consistently. Switching models mid-quarter is how you get numbers that contradict themselves.
Hard rule for lead source governance: Set lead source at first conversion and never overwrite it. If you need to track the most recent channel, create a second field - "most recent touch source." We've seen teams corrupt years of attribution data by letting automation overwrite original source fields. Once that data is gone, you can't reconstruct it (a clean RevOps process prevents this).
Ignoring Sales Costs in the Denominator
Your lead gen spend isn't just media budget. It includes SDR salaries, tools, content production, and agency fees. If you're only counting ad spend, your ROI looks great and your P&L looks terrible (audit your stack with an SDR tools checklist).
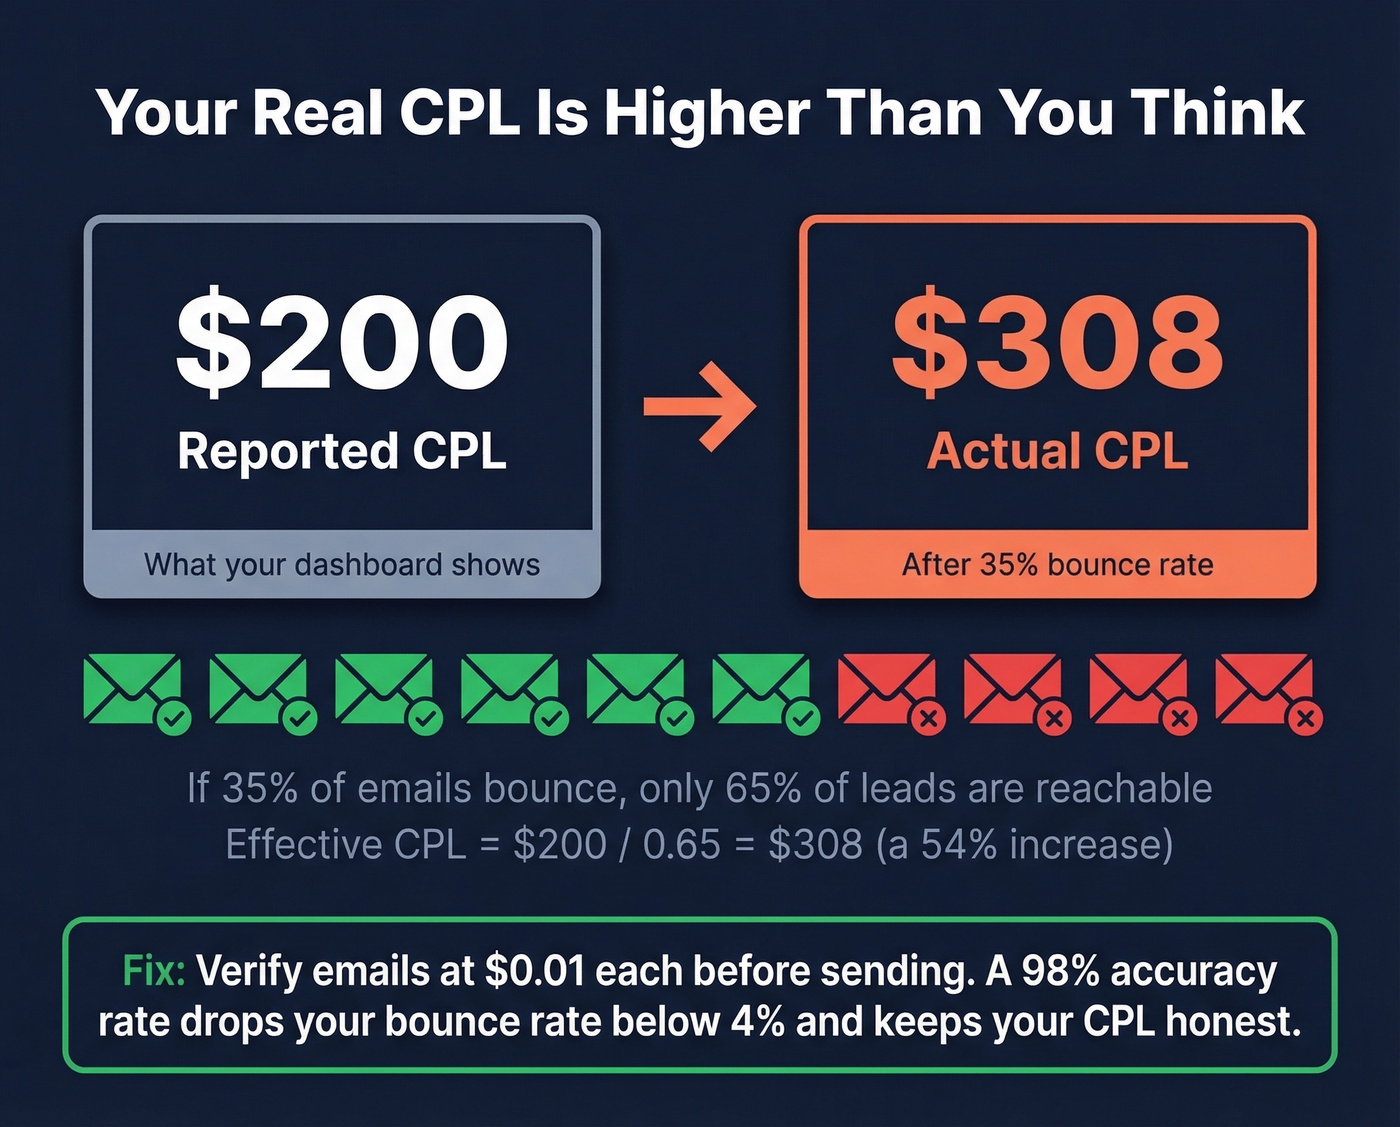
Bad Data Inflating CPL Silently
Here's the thing: if 35% of your emails bounce, only 65% of your leads are reachable - so your effective CPL is CPL / 0.65, a 54% increase. A $200 CPL becomes $308 in reality. One bounced contact wastes 2-5 minutes of SDR time plus sequencing costs. Verifying emails at $0.01 each is cheaper than the labor you burn on dead addresses (see email bounce rate benchmarks and fixes).
No Incrementality Testing
Attribution models estimate credit. Incrementality testing - holdout groups, geo-split tests - measures whether your spend actually caused conversions or just captured demand that would have converted anyway. If you've never run a holdout test on your top channel, you don't actually know its ROI. Skip this if your monthly lead volume is under 200; you won't have enough statistical power for meaningful results.
Ignoring Privacy and Tracking Gaps
Consent banners, cross-device journeys, and browser privacy changes mean your attribution data has blind spots. Assume a meaningful chunk of touchpoints are invisible to your analytics, and account for that when you present ROI to leadership.
How to Improve Lead Generation ROI
Your ROI Measurement Checklist
Before optimizing anything, make sure you're measuring correctly. Use this as a CRM audit checklist:
- Full cost basis documented - ad spend + SDR salaries + tools + content production + agency fees
- Revenue definition agreed - closed-won only, or include pipeline weighted by stage probability?
- Time window set - 90-day, 12-month, and LTV views, reported separately
- Attribution model chosen and documented - one model, applied consistently, reviewed quarterly
- Lead source governance enforced - source locked at first conversion, second field for most recent touch
- Refresh cadence - recalculate ROI monthly for active campaigns, quarterly for channel-level strategy
Rebalance Your Channel Mix
For B2B teams with a $50K monthly lead gen budget, we'd recommend putting 60% into SEO and content, 20% into email nurture, and 20% into targeted paid. Most teams have this inverted - heavy on paid, light on organic - and their blended returns reflect it. The data is clear: organic channels deliver dramatically better returns over any 12+ month window (align this with your lead generation trends planning).
The guardrail: if you're pre-product-market-fit or need pipeline in under 60 days, temporarily flip the ratio toward paid. But keep SEO and content running in the background so you're not trapped paying permanent CPC rent once the urgency passes.
Fix Your Data Quality

This is the fastest ROI lever because it requires zero strategy change - just better inputs. Snyk's sales team was running a 35-40% bounce rate before switching their data source. After moving to Prospeo, bounces dropped under 5%, AE-sourced pipeline jumped 180%, and the team generated 200+ new opportunities per month. With 98% email accuracy and a 7-day data refresh cycle, your outreach actually reaches the people you're paying to target. When every lead in your denominator is reachable, your CPL and ROI numbers finally reflect reality.
Measure on LTV, Not First Month
If you're only reporting first-month or first-quarter returns, you're systematically undervaluing your best channels - especially SEO and content, which compound over time. Present both timeframes to leadership. The short-term number keeps the budget alive; the long-term number justifies scaling it. Tying lead generation revenue back to lifetime value is the single best way to prove that your programs are building durable pipeline, not just filling the top of the funnel.
Cold email shows $225 CPL and 261% ROI in the benchmarks above - but only when your data connects. Teams using Prospeo book 35% more meetings than Apollo users because 98% of emails actually reach real buyers. That's the difference between 67% ROI and 300%.
Clean data is the fastest ROI fix you're not making.
FAQ
What Is a Good Lead Generation ROI?
High-performing B2B teams target 300-500% ROI across their blended channel mix. Anything above 100% means your programs are profitable. Channel selection drives the range - SEO averages 748% while PPC sits around 36%, so your mix determines your ceiling.
What's the Difference Between ROI and ROAS?
ROI subtracts costs first: (Revenue - Cost) / Cost. ROAS divides revenue by spend without subtracting, producing a higher number every time. If your formula doesn't subtract costs in the numerator, you're reporting ROAS and inflating every downstream metric.
How Do You Improve ROI Without Increasing Budget?
Fix data quality first - verifying emails at $0.01 each eliminates wasted spend on unreachable contacts. Then shift budget toward higher-return channels like SEO and email. Finally, measure on customer lifetime value instead of first-month revenue to capture the full return.
How Do You Track Leads to Closed-Won Deals?
Map every lead source to its downstream pipeline stages - SQL, opportunity, and closed-won - inside your CRM. Lock the original source field at first conversion and use stage-dated timestamps so you can calculate conversion rates and revenue by channel. Without this end-to-end tracking, you're guessing at which programs actually drive revenue.