=== CURRENT ARTICLE (slug: list-external-factors-that-influence-a-sales-forecast) ===
External Factors That Influence a Sales Forecast (2026)
Your Q3 forecast looked solid - until tariffs hit, a competitor slashed pricing, and consumer confidence dipped in the same month. Suddenly the number your board approved is fiction. Four in five sales and finance leaders missed a quarterly forecast in the past year, and over half missed two or more times. The gap between top performers and everyone else? APQC benchmarks show top-tier orgs hit 1.3% error rates while bottom-tier teams land around 2.4%. On $20M in annual sales, that's a $400,000 shortfall.
Most teams treat demand and sales as the same number. They're not. If you forecast 6 units but demand is 10, you didn't miss by 4 - you lost 4 sales. External factors don't just shift demand; they constrain your ability to fulfill it. That's why you need to list external factors that influence a sales forecast and build them into your model before they blindside you.
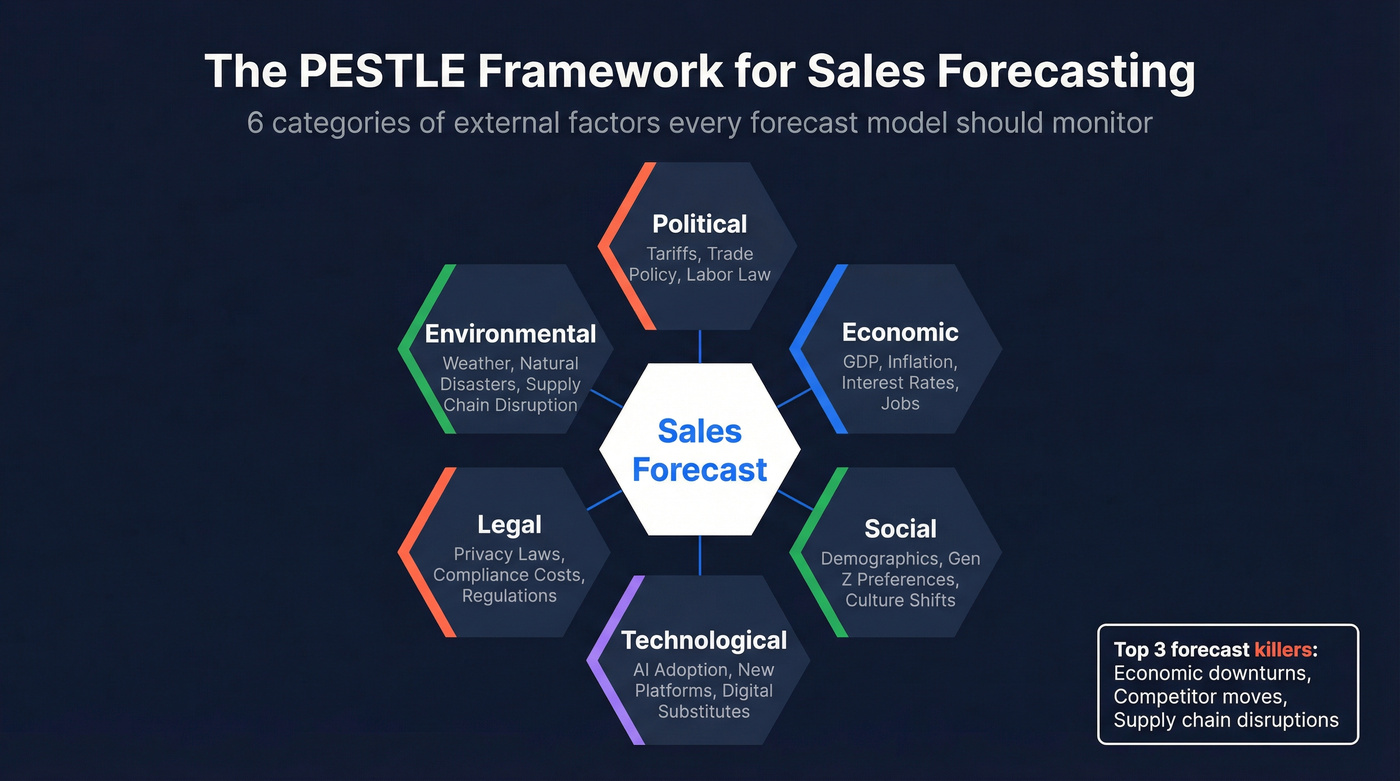
The PESTLE Framework for Sales Forecasting
Six categories cover every external factor worth tracking: Political, Economic, Social, Technological, Legal, and Environmental. The three that derail the most forecasts: economic downturns, competitor moves, and supply chain disruptions.
Here's the thing most forecasting guides won't say: the majority of external factors aren't unpredictable. They have leading indicators with 3-12 months of advance warning. The problem isn't chaos - it's that sales teams don't monitor the signals. In our experience, adding external variables to a forecast model reduces error by 5-20%, depending on category volatility and data quality.
Political Factors
Track these if you sell anything that crosses a border or relies on regulated labor. In early 2025, new US tariffs included a 10% levy on Chinese goods, with additional tariffs affecting Canada, Mexico, steel, and aluminum. If your cost structure touches any of those, your 2026 forecast assumptions have already shifted.
Don't over-index on election cycles or broad "political uncertainty" - too vague to model. Focus on concrete policy: tariff schedules, labor regulation changes, contractor classification rules, and immigration shifts that affect your workforce. These are the political inputs that actually change a number on a spreadsheet.
Economic Factors
Economic conditions are the single biggest external lever on most forecasts - and the most measurable. The Consumer Confidence Index projects consumer spending with surprising accuracy, and consumer spending drives roughly two-thirds of US GDP. When GDP contracts and unemployment rises, both B2B and B2C buyers delay purchases, shrink deal sizes, and extend sales cycles. The damage compounds quarter after quarter, and it doesn't reverse the moment indicators tick back up.
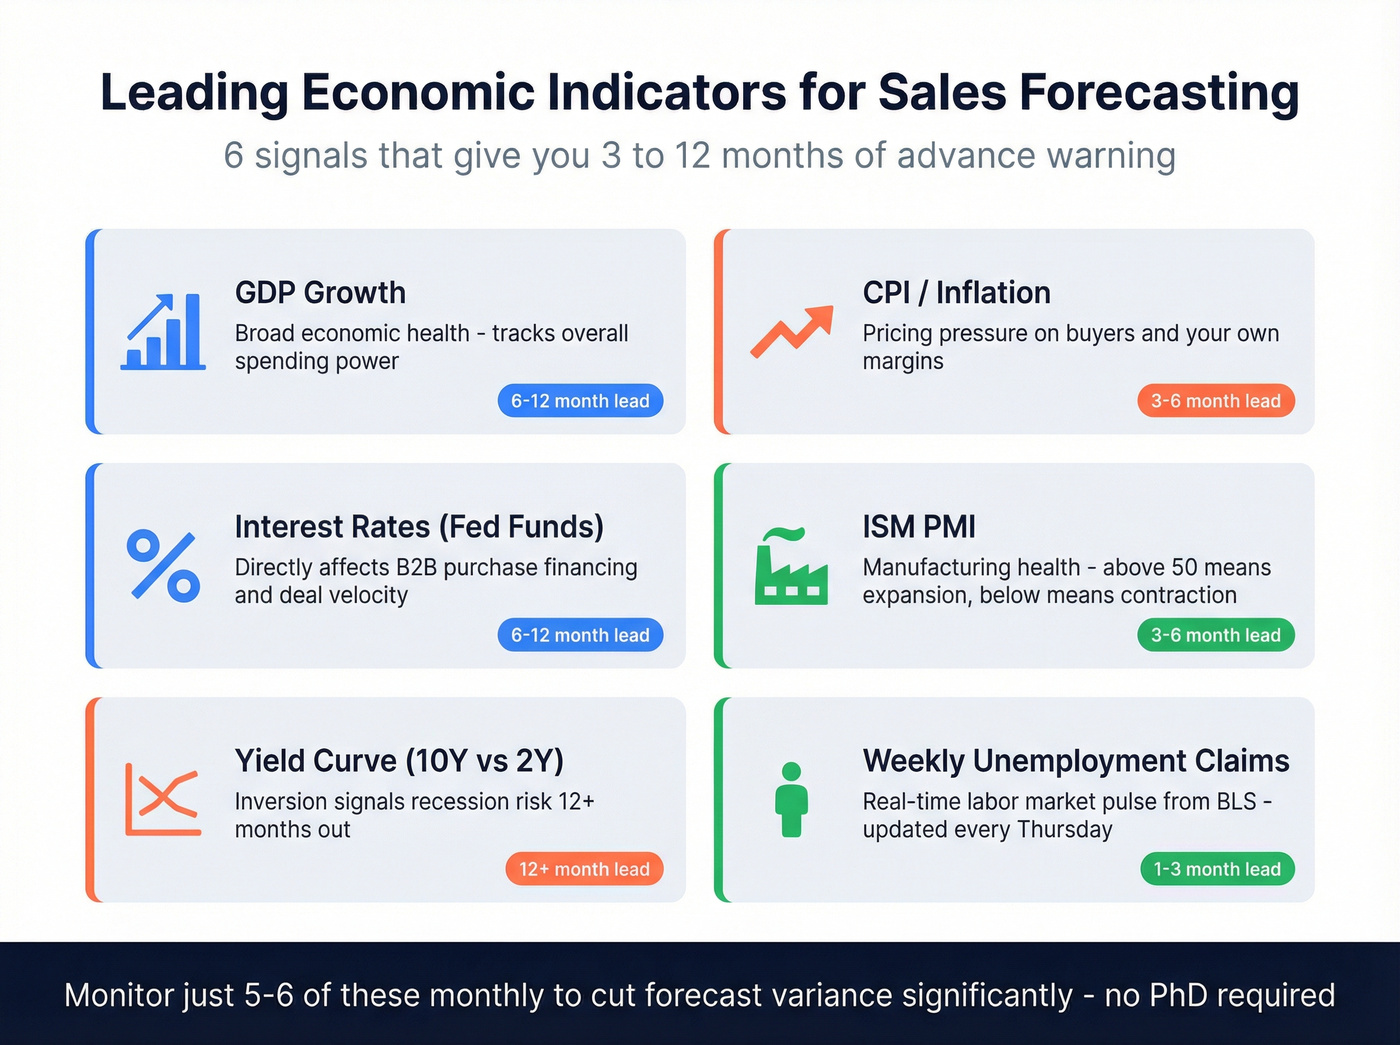
Build a dashboard around these leading indicators: GDP growth, CPI/inflation, interest rates, ISM PMI, the yield curve (specifically the 10-year vs 2-year spread), and weekly unemployment claims from the BLS. Most give you 3-12 months of advance warning. We've seen teams cut forecast variance significantly by monitoring just five or six of these monthly - no PhD in economics required.
Social Factors
Demographic shifts move slowly but hit hard. Gen Z now represents a growing share of B2B buying committees, and their preferences - transparency, purpose-driven brands, ESG commitments - are reshaping vendor selection criteria. These won't change your Q1 number, but they'll reshape your annual plan.
Track census data and generational preference surveys. If you're selling into enterprise accounts, pay attention to how decision-making authority is shifting downward in org charts. The person who signs the contract and the person who chose the vendor are increasingly different people.
Technological Factors
Skip this subsection if your product has no digital substitute and no AI-adjacent competitor. For everyone else: AI adoption is changing demand patterns faster than most forecasts account for. New platforms disrupt established channels. Technology-driven substitutes appear in categories that felt stable for years.
If your product competes with something that can be automated, your forecast needs a disruption discount. Monitor job postings for emerging skill requirements and patent filings in adjacent categories - both are early signals that a market is about to shift underneath you.
Legal Factors
Data privacy is the sleeper factor. State-level laws are trending toward GDPR-style requirements in 2026, and compliance costs are real - especially for teams running outbound at scale. One contractor reclassification ruling can blow up your cost model overnight.
Industry-specific regulations in healthcare, financial services, and education can gate entire market segments. Subscribe to legislative tracking services rather than trying to monitor this manually. It's not glamorous work, but a single missed regulation change can invalidate an entire quarter's pipeline assumptions.
Environmental Factors
Weather isn't just a retail problem. NRF and Planalytics data shows demand swings most teams ignore: air conditioner demand jumped 13% in Kansas City but fell 17% in New York City in the same season. Pool chemical sales ranged from -10% to +14% depending on the city. These aren't rounding errors.
Supply chains compound the problem. Maersk data shows 76%+ of European shippers experienced disruption throughout 2024, with roughly a quarter dealing with 20+ separate incidents. During the 2018 tariff escalation, spot rates on the China-to-US West Coast lane spiked over 70% - that kind of cost shock flows straight into your margin assumptions and makes your forecast fiction before the quarter even closes.
Let's be honest though: unless you're in retail, agriculture, or logistics, stop over-weighting weather in your model. Practitioners on r/supplychain flag this as one of the most common forecasting traps - teams spend hours modeling weather scenarios that move their number by 0.3%.
| PESTLE Category | Key Factors | Leading Indicator / Source |
|---|---|---|
| Political | Tariffs, trade policy, labor law | Gov announcements, HTS codes |
| Economic | GDP, inflation, rates, jobs | CCI, ISM PMI, yield curve |
| Social | Demographics, Gen Z, culture | Census, sentiment tracking |
| Technological | AI adoption, new platforms | Job postings, patent filings |
| Legal | Privacy laws, compliance costs | Legislative tracking, trade groups |
| Environmental | Weather, disasters, supply chain | NRF WeatherIQ, logistics data |
External factors will shift your forecast - but bad data makes it fiction from day one. Prospeo's 7-day refresh cycle means your pipeline reflects reality, not stale contacts from six weeks ago. 98% email accuracy and 30% mobile pickup rates keep your forecast grounded in deals that actually connect.
Stop forecasting on contacts that bounce. Start with data you can trust.
How to Build External Factors Into Your Forecast
1. Prioritize with a likelihood x impact matrix. Score every relevant PESTLE factor on probability and revenue impact. Look, you can't track everything - pick the 5-8 factors that would actually move your number and ignore the rest.
If you're formalizing this inside RevOps, align it with your sales operations metrics so the model stays auditable.
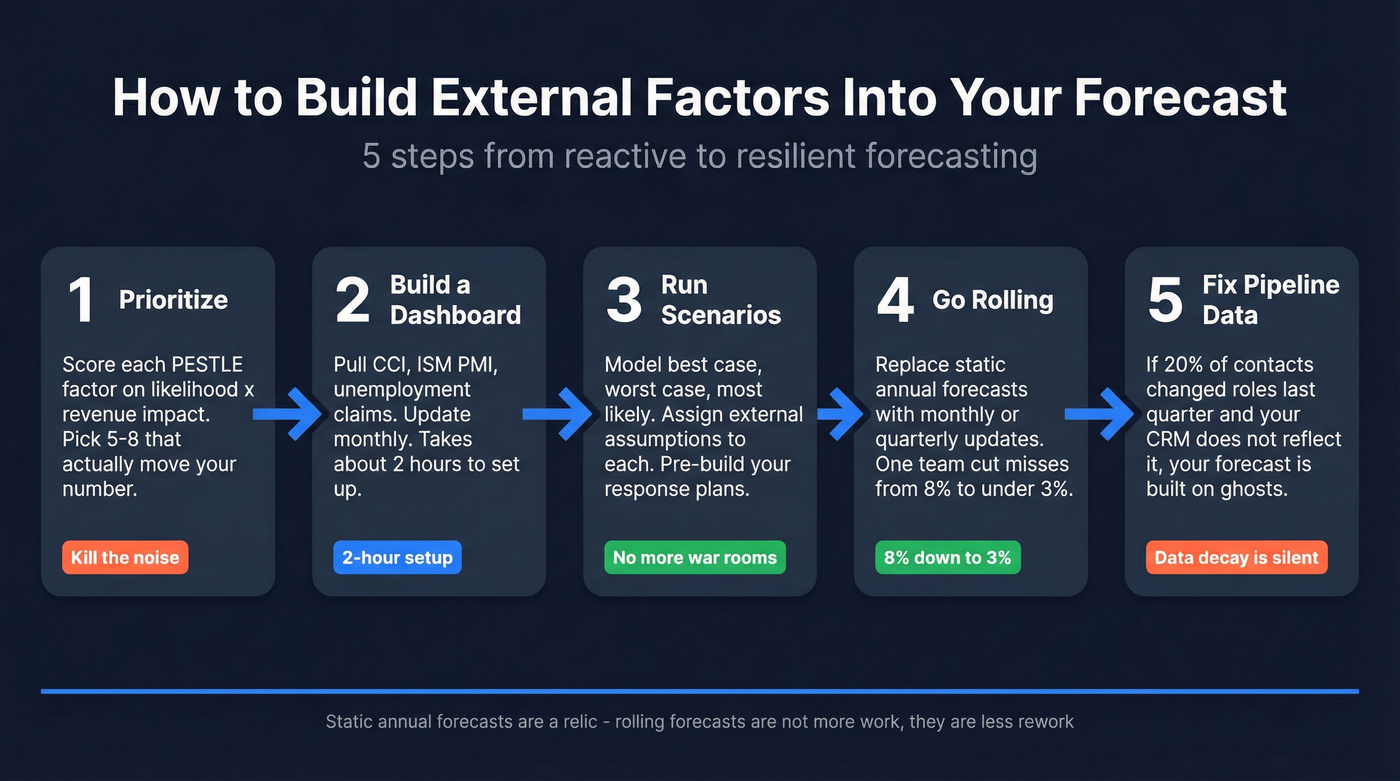
2. Build a leading-indicator dashboard. Pull CCI data from the Conference Board, ISM PMI, and weekly unemployment claims from BLS. Update monthly. This is your early warning system, and it takes about two hours to set up in any BI tool.
To keep the dashboard actionable, tie each indicator to pipeline health thresholds (e.g., when confidence drops, tighten qualification and adjust cycle-time assumptions).
3. Run scenario planning. Model best case, worst case, and most likely. Assign external-factor assumptions to each scenario. When conditions shift, you're activating a pre-built plan - not scrambling in a war room at 9 PM on a Friday.
Scenario planning works best when your team has a lightweight competitive intelligence strategy for tracking pricing moves, funding rounds, and product launches.
4. Replace annual forecasts with rolling ones. Static annual forecasts are a relic. They're obsolete the moment an external shock hits. Update monthly or quarterly, incorporating the latest indicator data and pipeline reality. One team we worked with switched from annual to rolling quarterly forecasts and cut their average miss from 8% to under 3% within two cycles.
If you're still debating definitions internally, clarify the difference between a sales forecast vs sales goal so leadership stops treating targets as predictions.
5. Fix your pipeline data. Two-thirds of sales and finance leaders say their biggest forecasting roadblock is systems that can't access historical CRM and performance data. Job changes, company restructures, and org shifts are external events that silently degrade your pipeline. If 20% of your contacts changed roles last quarter and your data doesn't reflect it, your forecast is built on ghosts. Prospeo's 7-day refresh cycle and 98% email accuracy keep pipeline data aligned with actual reachable buyers - not last quarter's org chart.
If you're evaluating vendors, start with a shortlist of data enrichment services and compare refresh cadence and verification depth.
Mistakes That Kill Forecast Accuracy
Treating the forecast as pure pipeline math. Your pipeline is an internal snapshot. It doesn't know that a recession is brewing or that your biggest competitor just raised $50M. Ignoring outside forces is the fastest way to produce a confident, wrong number.
This is also why teams that invest in data-driven selling tend to spot misses earlier: they treat external signals as first-class inputs, not commentary.
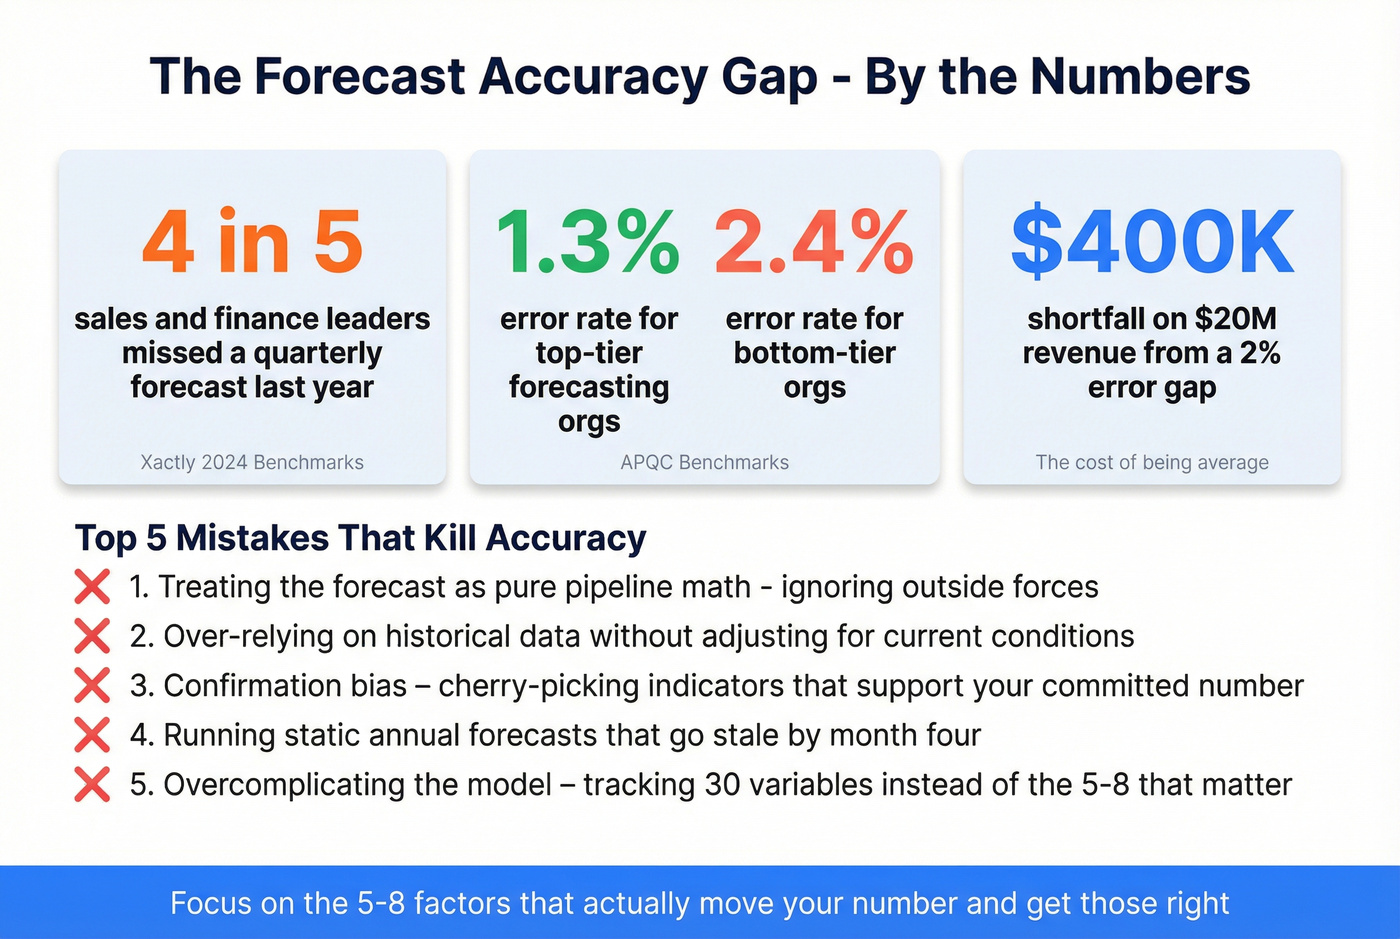
Over-relying on historical data without adjusting for current conditions. Last year's close rates don't mean much if interest rates jumped 200 basis points since then. Always ask: what's different now?
If you need a structured way to quantify "what's different," borrow from predictive analytics in sales and weight recent signals more heavily than legacy averages.
Confirmation bias. Cherry-picking indicators that support the number you already committed to. We've all done it. The antidote is assigning someone on the team to argue the bear case every quarter - make it a formal role, not an afterthought.
Running static annual forecasts. By month four, your assumptions are stale. Rolling forecasts aren't more work; they're less rework.
Overcomplicating the model. Tracking 30 variables doesn't make you sophisticated. It makes you slow. Focus on the 5-8 that actually move your number and get those right.
If your model is bloated because your pipeline is messy, fix the upstream process with sales process optimization before adding more variables.
You're building dashboards for GDP, CPI, and yield curves - but is your contact data keeping pace? When economic headwinds extend sales cycles, every outreach needs to land. Prospeo verifies 143M+ emails through a 5-step process and refreshes all records weekly, so your forecast pipeline stays accurate even when external conditions shift underneath you.
Control what you can: make every forecasted deal reachable at $0.01 per email.
FAQ
What's the Difference Between Internal and External Forecast Factors?
Internal factors are things you control - pricing, headcount, marketing spend, territory assignments. External factors are conditions you monitor and adapt to: economic shifts, competitor moves, regulation, weather, and supply chain disruptions. When you list external factors that influence a sales forecast, the goal isn't to track everything. It's to identify the handful with the highest revenue impact on your specific business and build early warning systems around them.
Which External Factor Has the Biggest Impact?
Economic conditions - specifically consumer confidence and GDP growth. Consumer spending drives roughly two-thirds of US GDP, so when confidence drops, demand follows across nearly every category. Recessions don't just reduce volume; they change buyer behavior in ways that persist well after recovery begins. Longer sales cycles, smaller deal sizes, and more stakeholders in every decision.
How Do You Keep Forecast Data Current?
Use rolling forecasts updated monthly, track leading economic indicators through a centralized dashboard, and keep pipeline data current with enrichment tools that refresh contact records on a weekly cycle rather than the typical 6-week industry lag. Stale contact data is one of the most overlooked external drags on forecast accuracy - you can't close deals with people who left the company three months ago.