Market TAM: The Practitioner's Guide to Sizing That Investors Actually Believe
Slide three of the pitch deck. The one with the giant circle labeled "$47 billion TAM" and a tiny sliver that says "our opportunity." The investor glances at it for maybe four seconds, mentally files it under "made up," and moves on.
Most market TAM numbers are stitched together from random assumptions, padded with adjacent markets, and presented with false confidence. One r/startups thread put it bluntly: founders inflate their total addressable market to look fundable while investors pretend to believe it to justify a bet. The founders who break through that cycle show their work.
The Short Version
TAM is the total revenue you'd earn if you captured 100% of your market. Calculate it bottom-up first, then sanity-check with top-down. If the two methods diverge by more than 3x, at least one input is wrong - go back and pressure-test your assumptions. A credible TAM slide shows a narrow wedge with an expansion path, not a giant number with a "we'll capture 1%" footnote.
What Is TAM?
Total Addressable Market represents the maximum annual revenue opportunity if every potential customer in your defined market bought your product. It's the ceiling - the theoretical upper bound before you layer in competition, distribution constraints, and the reality that no company captures 100% of anything.
The formula is straightforward. For B2B SaaS, substitute ACV x Total Accounts:
TAM = Total Potential Customers x Average Revenue Per Customer
The number itself isn't the point. The thinking behind it is.
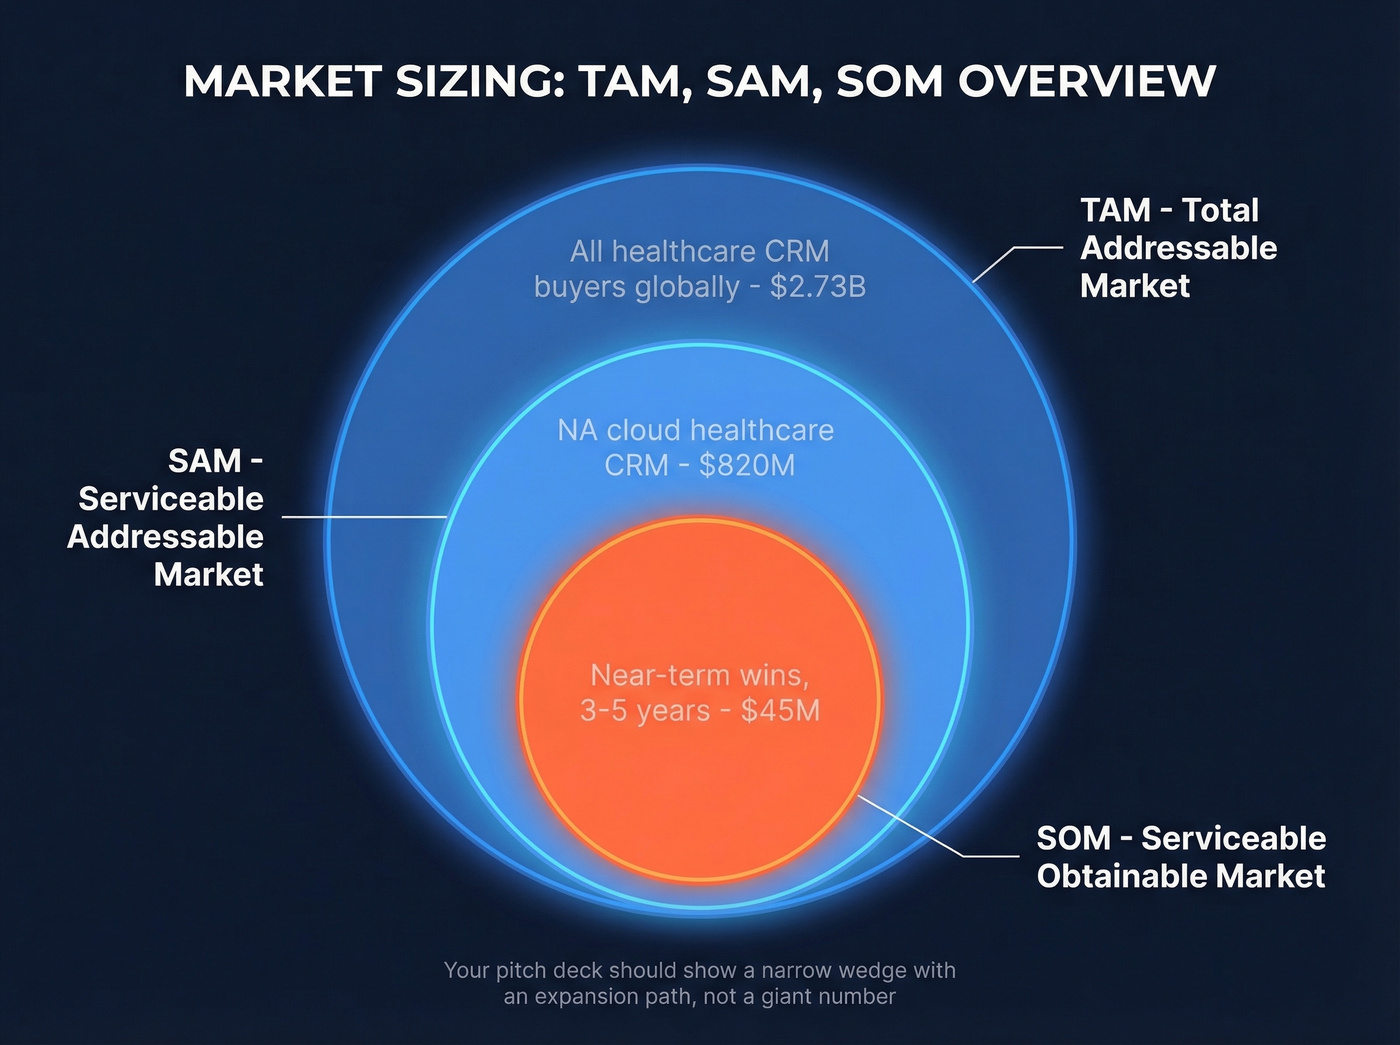
TAM, SAM, and SOM
Think of three nested circles. TAM is the outer ring - everyone who could theoretically buy. SAM (Serviceable Addressable Market) is the subset you can actually reach with your current product, pricing, and distribution. SOM (Serviceable Obtainable Market) is the slice you can realistically capture in the near term. If you need a deeper refresher on definitions, see addressable market and TAM, SAM, and SOM.
| Metric | Definition | Formula | Example |
|---|---|---|---|
| TAM | Total market demand | Customers x ACV | All healthcare CRM buyers globally |
| SAM | Reachable segment | TAM filtered by geo, fit | NA cloud healthcare CRM |
| SOM | Realistic capture | SAM x expected share | Near-term wins over 3-5 years |
Why TAM Matters (And Why It's Often Wrong)
Investors spend an average of 2 minutes and 42 seconds reviewing a cold pitch deck. Your sizing slide gets maybe 10 seconds. If the number looks inflated, you've lost credibility before you open your mouth.
Beyond fundraising, TAM drives territory planning, headcount models, pricing strategy, and channel investment. When your VP of Sales builds a quota model off a $5B figure and your finance team models off an $800M SAM, that misalignment surfaces painfully at the next board meeting. Using addressable market data consistently across departments prevents exactly this kind of disconnect.
Here's the thing: a big market doesn't equal a good opportunity. A $2B market with three entrenched incumbents and 18-month sales cycles is fundamentally different from a $2B market with fragmented point solutions and self-serve adoption. Differentiation and product-market fit matter more than TAM headlines - and the best investors know it.
A $300M niche with clear wedge strategy and 40% gross margins will attract smart capital faster than a hand-wavy $10B number. If your deal sizes hover around $8K and you're selling to SMBs, stop chasing big circles. Own your wedge.
Three Methods to Calculate TAM
No single method is definitive. The best practitioners use at least two and reconcile the results.
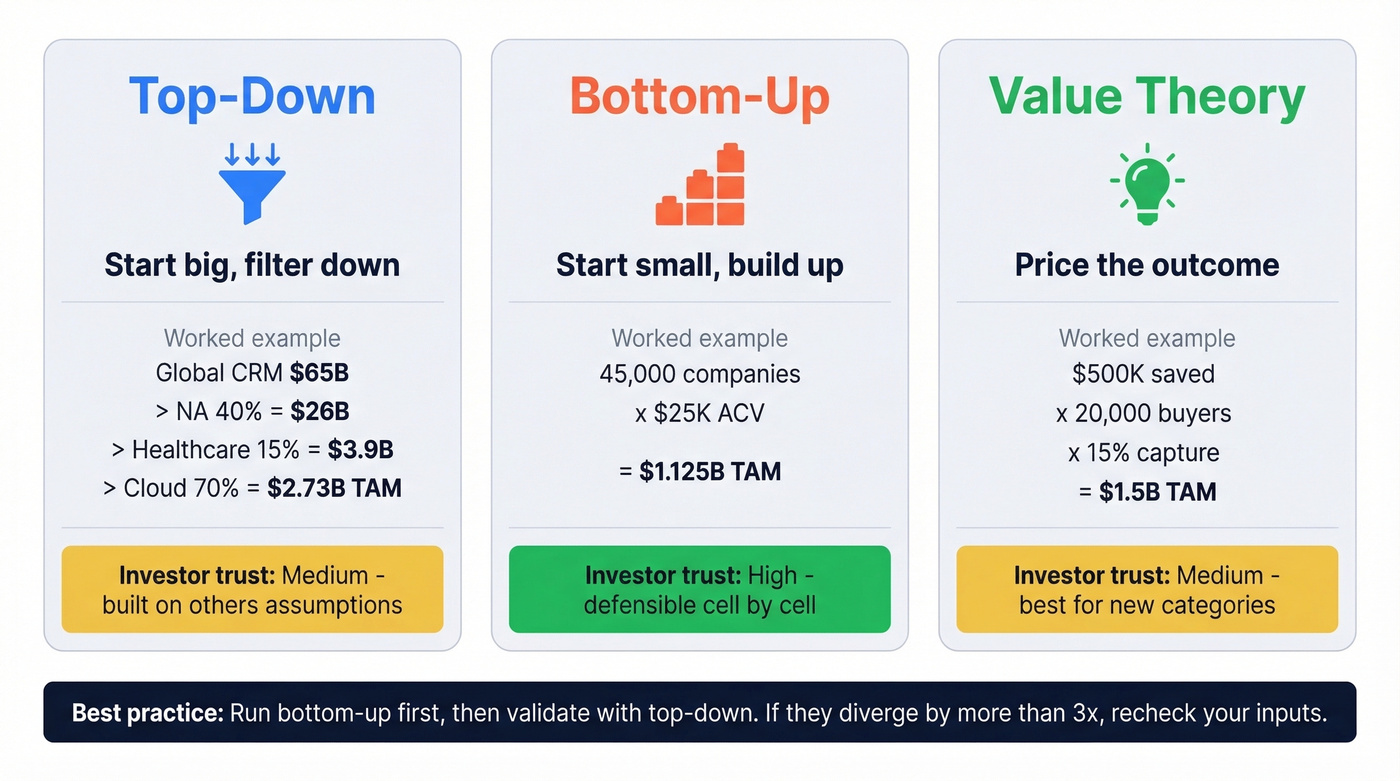
Top-Down: Start Big, Filter Down
Start with a broad industry number from a research firm, then narrow through successive filters. Here's a worked example for a healthcare CRM in North America:
- Global CRM market: $65B
- North America share (40%): $26B
- Healthcare vertical (15%): $3.9B
- Cloud-deployed only (70%): $2.73B - TAM: $2.73B
Top-down is fast and useful for sanity-checking, but it's built on someone else's assumptions. A 5-point swing on the healthcare vertical filter moves your number by $325M. Always validate with bottom-up.
Bottom-Up: Start Small, Build Up
Count the actual accounts that match your ICP, multiply by what you'd charge them. This is the method investors trust most because it forces you to prove you understand your buyer.
Worked example for a B2B SaaS product targeting mid-sized tech companies with 100-1,000 employees in North America:
- Matching companies: 45,000
- Average annual contract value: $25,000
- TAM: 45,000 x $25,000 = $1.125B
Bottom-up takes more work, but it produces a number you can defend cell by cell. We've seen founders walk investors through their account list and close rounds that "bigger TAM" decks couldn't. The specificity is the credibility.
Value Theory: Price the Outcome
When you're creating a new category where no existing market data applies, quantify the problem's cost and estimate what percentage of that value you can capture. Software companies typically capture 10-20% of the value they create.
If your product saves enterprises $500K/year and there are 20,000 potential buyers, the total value created is $10B. At a 15% capture rate, your TAM is $1.5B. This was the most honest approach for companies like Airbnb and Uber - the market didn't exist yet, so there was no spend to reference.
Which Method Wins?
Run bottom-up as your primary method. Always. Then validate with top-down. If the two numbers diverge by more than 3x, at least one input is wrong. Use value theory only when you're genuinely creating a new category.
SaaS TAM Walkthrough
Start with your ICP - not the aspirational version, but the honest one. Who's actually buying today? What company size, industry, geography, and tech stack defines your best customers? (If you need a template, use this ICP guide.)
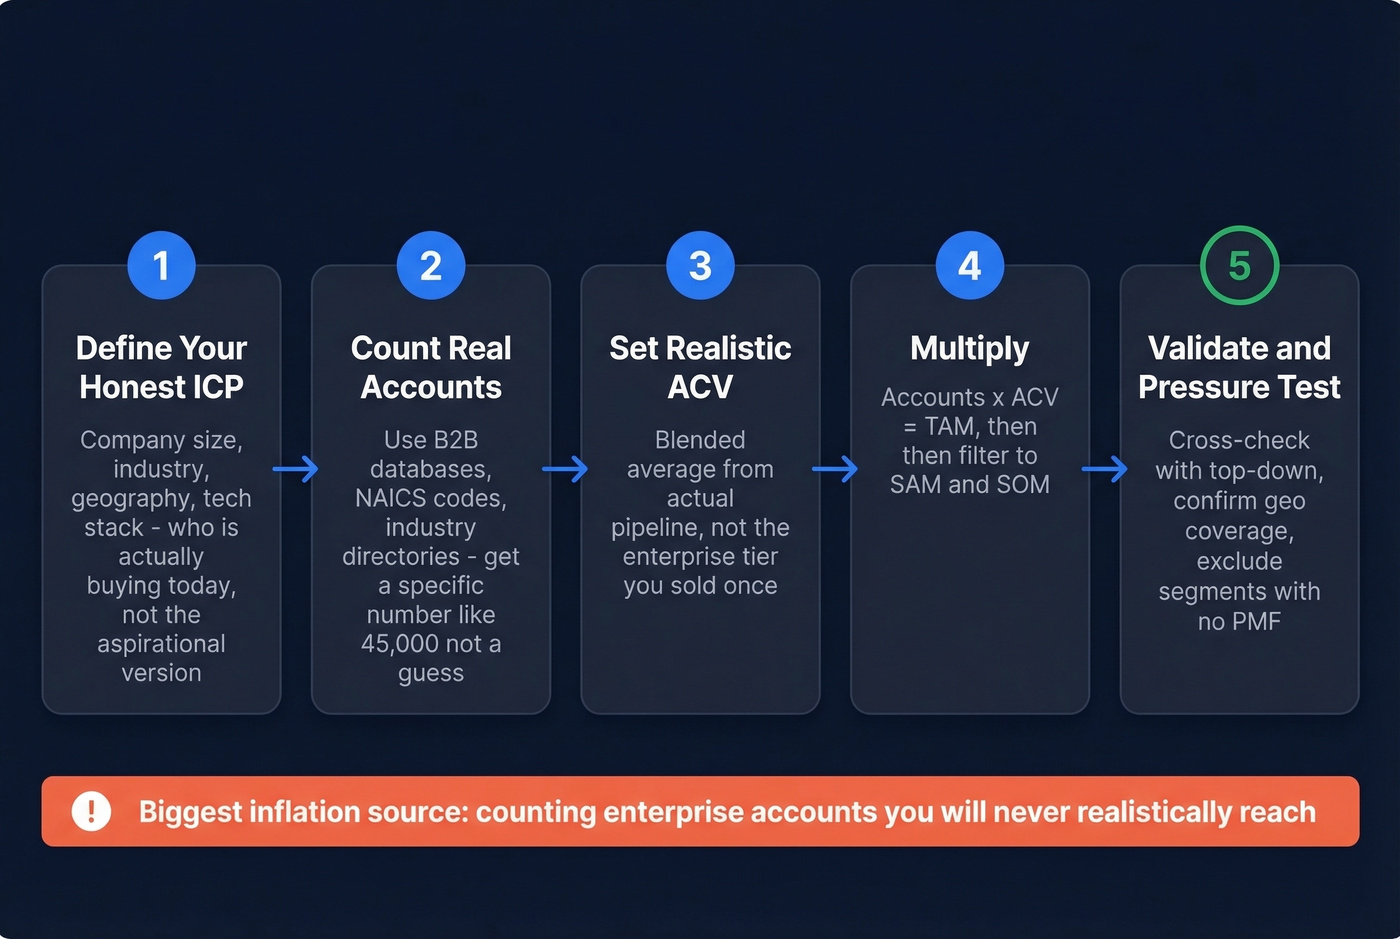
Count those companies using B2B databases, NAICS code lookups, or industry association directories. Multiply by your realistic ACV - the blended average across your actual pipeline, not the enterprise tier you've sold once. In our experience, the biggest inflation comes from founders counting enterprise accounts they'll never realistically reach.
The r/SaaS community calls this out constantly. Reframe the exercise: instead of "$10B market," think "50,000 potential companies, roughly 8,000 realistically reachable in 3 years, multiplied by realistic ACV." That's a number you can build a go-to-market strategy around, and sales planning becomes far more actionable when it's grounded in accounts you can actually name.
Before you finalize, run through these checks: Are you counting only companies in geographies where you have sales coverage? Is your ACV based on actual deals, not aspirational pricing? Have you excluded segments where you have no product-market fit today? Does your expansion path from SOM to SAM to TAM make logical sense?
Your bottom-up TAM is only as good as your account count. Prospeo's B2B database gives you 300M+ verified profiles with 30+ filters - industry, headcount, revenue, technographics, funding stage - so you can count ICP-fit companies cell by cell instead of guessing from analyst reports.
Build an investor-ready TAM from real accounts, not assumptions.
Where to Get TAM Data
TAM is created, not found - you'll synthesize data from multiple sources and make informed inferences. Before trusting any number, ask three questions: Where did this data originate? What agenda does the producer have? Why is it publicly available? Be especially wary of false consensus - multiple articles quoting the same original Gartner report doesn't make that number more accurate.
| Source | Cost | Best For | Limitations |
|---|---|---|---|
| US Census Bureau | Free | Business counts by size | A couple years of data lag |
| BLS | Free | Employment by role | No company detail |
| County Business Patterns | Free | Geo-specific data | US only |
| SEC Filings | Free | Public company financials | Public cos only |
| ITC Trade Map | Free | Import/export lists | Trade-focused |
| Crunchbase | ~$50/mo+ | Startup/VC data | Skews funded cos |
| PitchBook | ~$20K-$40K+/yr | Deep company intel | Expensive |
| IBISWorld | ~$1K-$2.5K/report | NAICS industry data | Needs translation |
| Gartner/IDC | ~$1K-$5K+/report | Market forecasts | May not match ICP |
For B2B companies doing bottom-up sizing, you'll also want a database that lets you count companies matching specific ICP criteria. Prospeo's B2B database offers 30+ search filters including industry, headcount, tech stack, and funding stage - useful for validating whether "45,000 mid-market tech companies" is a real number or a guess. If you're comparing vendors, start with B2B company data and data enrichment services.
Mistakes That Kill Credibility
Quoting a Gartner number + "we'll capture 1%." This tells investors you haven't done original research and gives zero reason to believe even 1% is achievable. Skip this move entirely.
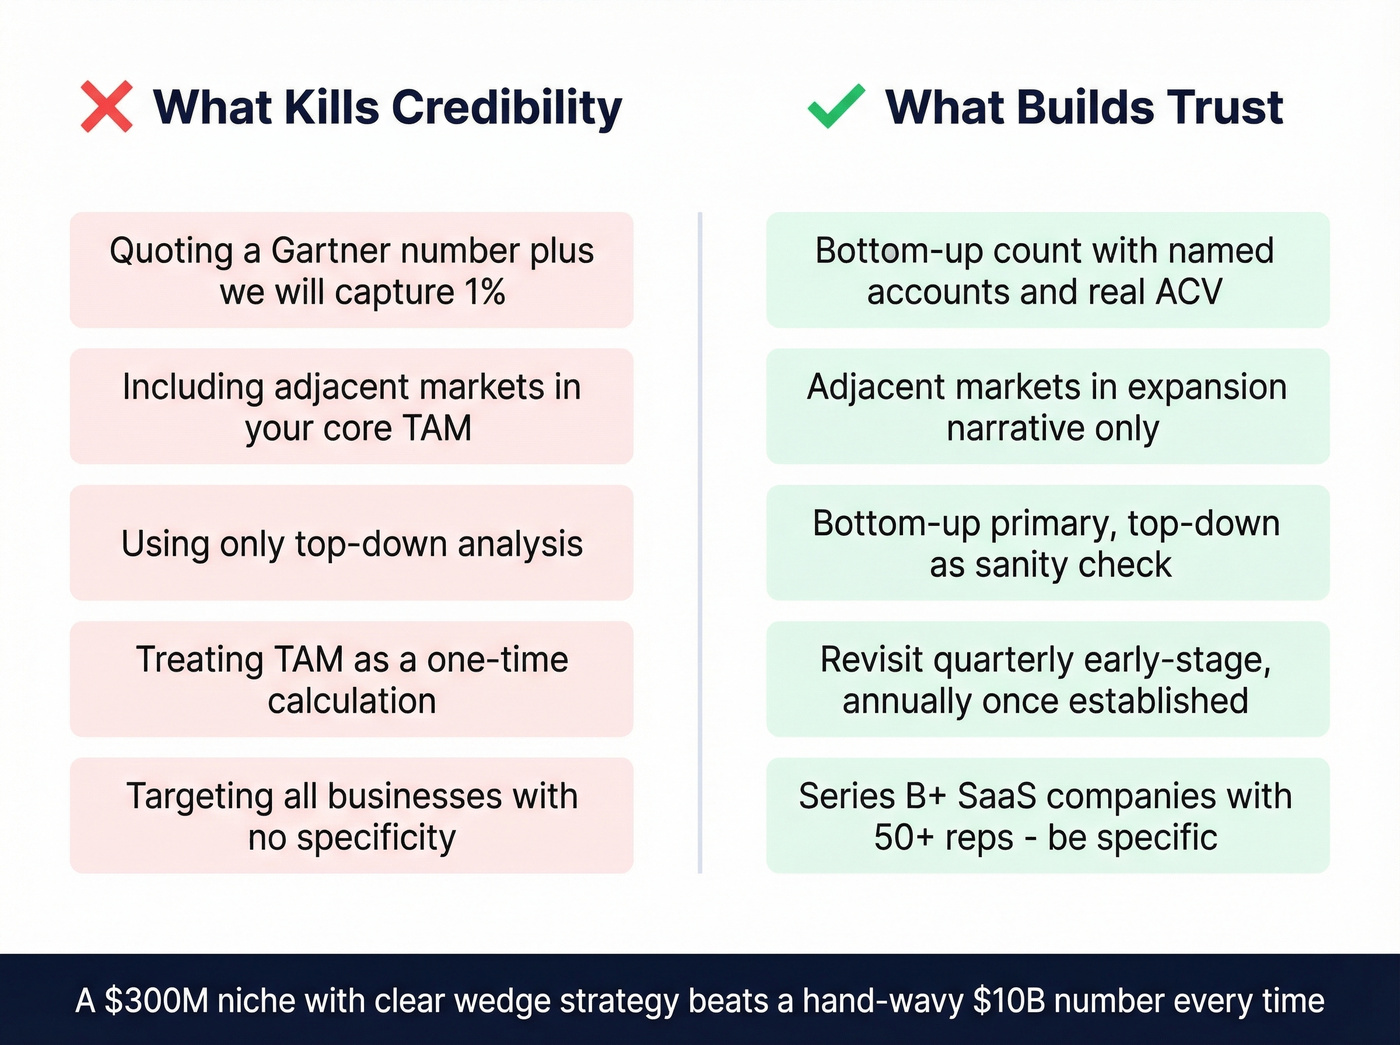
Including adjacent markets. If you sell project management software, the "global productivity market" isn't your TAM. Adjacent markets belong in your expansion narrative, not your core sizing.
Using only top-down. A top-down number alone is just a big number on a slide. Investors have seen thousands. They skip them.
Treating it as a one-time calculation. Revisit quarterly during early-stage growth, annually once established. Your addressable market shifts when ICP, pricing, or geography changes.
Ignoring specificity. The AI-driven CRM startup targeting "all businesses" has a very different TAM than one targeting "Series B+ SaaS companies with 50+ reps." Specificity is credibility.
How to Present TAM to Investors
Stop trying to make your number bigger. The most compelling sizing slides start small and show an expansion path.
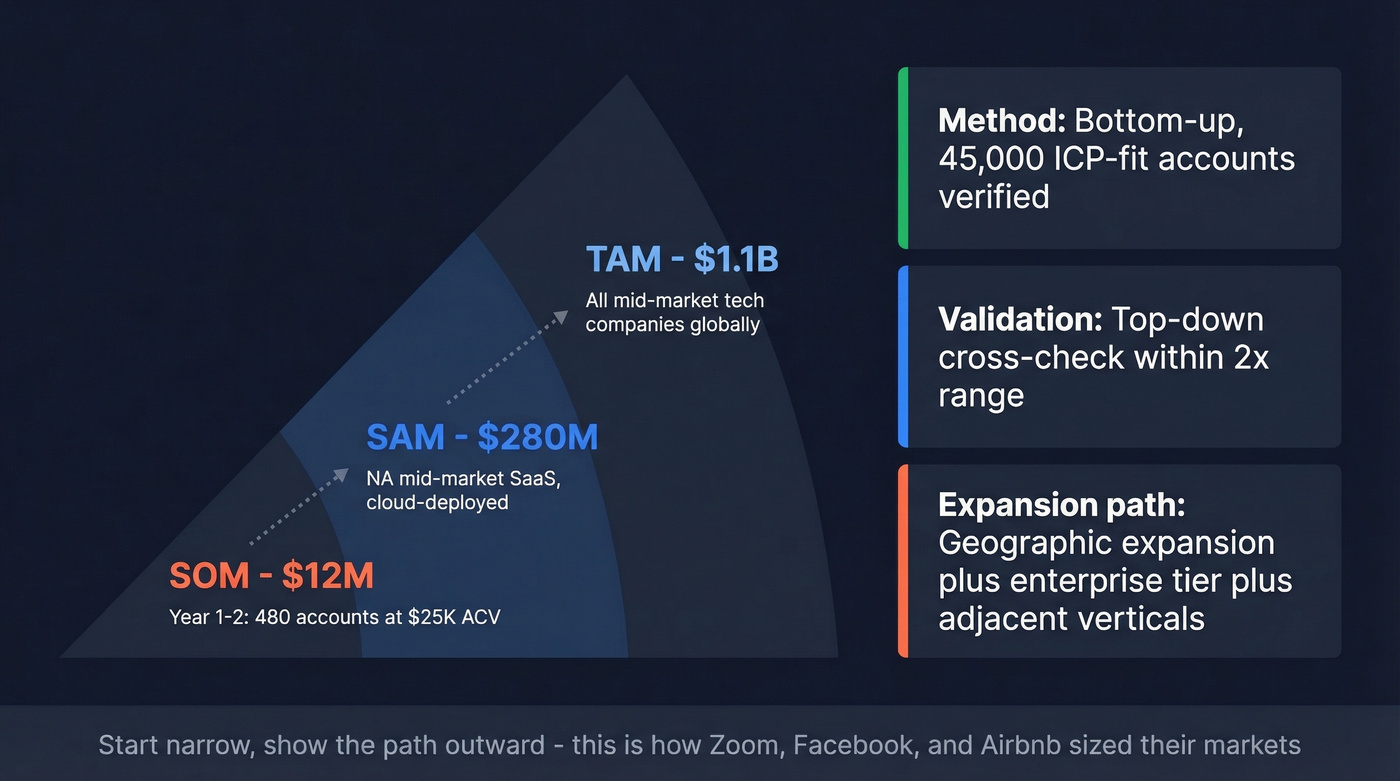
Zoom pitched video calls for tech companies, not "the global communications market." Facebook's early deck sized the market as college students at US universities. Airbnb's S-1 broke their $3.4T TAM into specific wedges - $1.8T in short-term stays, $210B in longer-term stays, $1.4T in experiences - each with its own logic and data. We've reviewed hundreds of pitch decks, and the ones that close consistently use this narrow wedge strategy. If you want to tighten the story around the slide, borrow a few patterns from sales deck storytelling.
With deck review times shrinking, your visual needs to communicate in seconds. Use consistent color coding for TAM/SAM/SOM. Back your SOM with real acquisition data or transparent bottom-up assumptions. If you need a paragraph to explain your sizing, the number isn't clear enough.
Turning Your TAM Into a Prospect List
A $5B market means nothing if you can't name 1,000 companies in it.
That's where most sizing exercises die - the gap between "I calculated my market TAM" and "I have accounts to sell to." The same ICP filters you used for bottom-up sizing - technographics, headcount, funding stage, geography - become your prospecting criteria. Once you've validated your account count against real company data, you're not just sizing a market. You're building a pipeline. To operationalize that, use these sales prospecting techniques and a repeatable lead generation workflow.

You just defined your TAM. Now turn those accounts into pipeline. Prospeo lets you go from market sizing to outbound in minutes - filter by company size, geography, and tech stack, then pull 98%-accurate emails and verified direct dials for every decision-maker. Starting at $0.01 per email.
Go from TAM slide to booked meetings without switching tools.
TAM Questions Founders Ask Most
What TAM size do VCs expect?
Most VCs look for $1B+ TAM with a credible path to $100M+ ARR. But a defensible $500M number backed by bottom-up validation beats a $50B fantasy every time. Quality of reasoning outweighs size of circle.
How often should you recalculate?
Quarterly during early-stage growth, annually once established. Update whenever your ICP, pricing, or geographic scope changes materially. Your addressable market is a living number, not a one-time slide.
Can you calculate TAM for a new category?
Yes - use value theory combined with bottom-up account counting. Quantify the problem's cost, estimate your capture rate at 10-20% for software, and count the organizations experiencing that problem.
What's the fastest way to count ICP companies?
B2B databases with granular filters let you sort by industry, company size, tech stack, and geography to get a real account count. That count doubles as your initial prospect list, which means your sizing exercise and your outbound launch can happen in parallel.
Is TAM the same as market size?
Not exactly. "Market size" typically refers to current spending in a category, closer to SAM or SOM. Total addressable market represents the total theoretical revenue opportunity including demand that doesn't exist yet - it's always the largest number in the framework.