Monthly Churn Rate: How to Calculate, Benchmark, and Reduce It
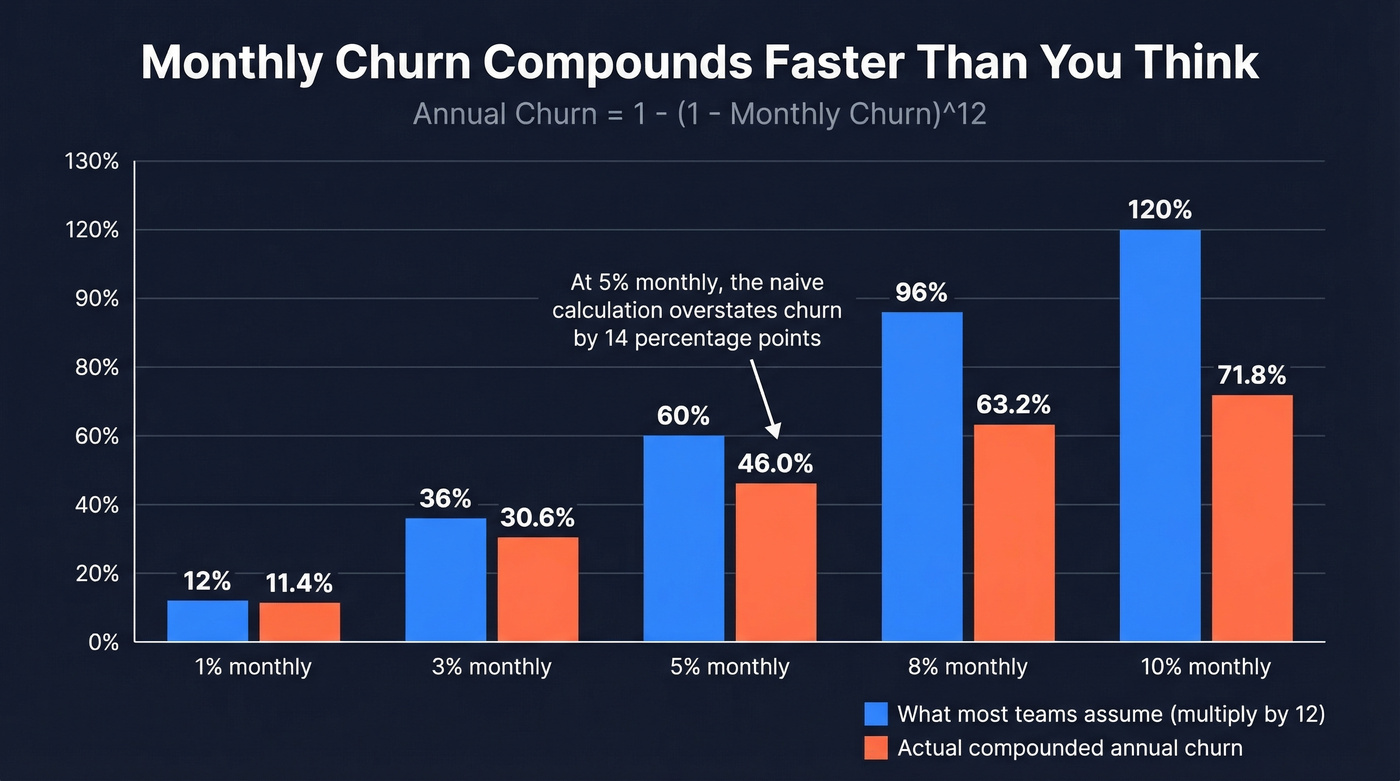
A 5% monthly churn rate sounds manageable - until you compound it and realize you're losing about 46% of your customer base every year. Multiply 5% by 12 and you'd wrongly get 60%; the real math is worse in some ways and better in others, but always different from what most teams present to their board.
Quick version: Monthly churn rate = customers lost / customers at start of month. The B2B SaaS median sits around 3.2%. That number's useless without knowing your ARR stage, ACV tier, and whether you're tracking logo churn, gross revenue churn, or net revenue churn. Implied customer lifetime = 1 / monthly churn rate - at 4% monthly churn, that's 25 months.
What This Metric Actually Measures
Monthly churn rate tells you what percentage of your customers (or revenue) you lost in a given month:
Monthly Churn Rate = Customers Lost During Month / Customers at Start of Month
Start January with 1,000 customers, lose 40 before February, and your rate is 4%. The complexity - and where teams get into trouble - is in defining "lost," choosing the right denominator, and deciding whether you're measuring customers or dollars.
How to Calculate Monthly Churn
Lock your start-of-month count. Use the customer count on day one as your denominator. Not the end. Not the average. The start.
Exclude trials and internal accounts. Free trials, test accounts, and employee seats aren't customers. Including them inflates your denominator and makes churn look artificially low.
Count only true cancellations. A customer who downgrades isn't churned - they've contracted, not churned. A customer whose payment fails isn't necessarily churned yet. Define your churn event clearly and apply it consistently month over month.
Compound to get annual churn. Don't multiply by 12. Use: Annual Churn = 1 - (1 - Monthly Churn)^12. At 5% monthly, that's 1 - (0.95)^12 = 45.96% annual churn, not 60%.
Track the same cohort definition every month. If you change what counts as a "customer" mid-quarter, your trend line is meaningless.
Monthly-to-Annual Conversion Reference
| Monthly Churn | Annual Churn |
|---|---|
| 1% | 11.4% |
| 3% | 30.6% |
| 5% | 46.0% |
| 8% | 63.2% |
| 10% | 71.8% |
Five Mistakes That Skew Your Numbers
These come up constantly in practitioner discussions on r/SaaS and in every churn audit we've run.
Using end-of-month denominator. Dividing by 960 instead of 1,000 understates churn. The difference seems small until it compounds across quarters.
Mixing customer churn with revenue churn. Losing 50 small accounts and losing 5 enterprise accounts can produce the same logo churn but wildly different revenue impact. Track them separately.
Including trials and internal accounts. Trials that expire aren't churn - they're failed conversions. Different problem, different fix.
Counting reactivations as retained. A customer who cancels in March and returns in June is a new acquisition, not a retained customer. Treating reactivations after 30-90 days as retention inflates your numbers.
Mixing monthly and annual contracts without annualizing. Annual customers can only churn once a year. Monthly customers have twelve opportunities. Blending them produces a number that describes neither cohort accurately.
Three Churn Types You're Probably Conflating
Your board deck says "4% churn" - but 4% of what? Customers? Revenue? Revenue after expansion? These three metrics tell completely different stories about the same business.
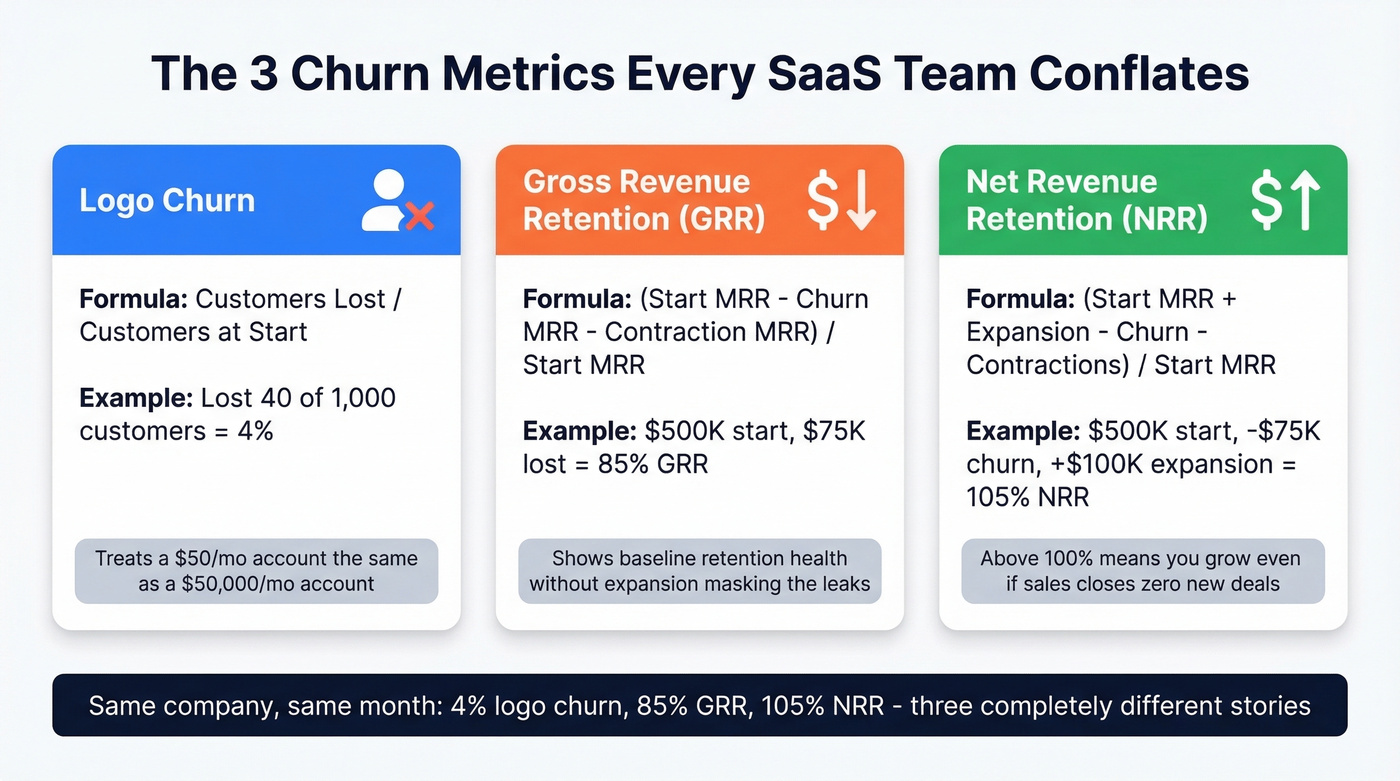
Logo (Customer) Churn
What percentage of customers left? Logo Churn = Customers Lost / Customers at Start of Period. It treats every customer equally - a $50/mo account counts the same as a $50,000/mo account.
Gross Revenue Retention (GRR)
Revenue lost from cancellations and downgrades, ignoring expansion. GRR = (Starting MRR - Churn MRR - Contraction MRR) / Starting MRR. This shows your baseline retention health without expansion masking the leaks.
Net Revenue Retention and Negative Churn
NRR adds expansion revenue back in: NRR = (Starting MRR + Expansion - Churn - Contractions) / Starting MRR.
Here's a concrete example: a company starts with $500K MRR, ends at $425K from cancellations, but gains $100K in upgrades. Gross churn is 15%. Net churn is -5%. Same company, same month, two completely different narratives.
When NRR exceeds 100%, you've achieved negative churn. About 40% of SaaS companies in the $15-30M ARR range get there. It's a core metric investors drill into during due diligence, and the one most early-stage teams aren't tracking yet.
Churn starts at acquisition. When your data provider feeds you bad emails and wrong contacts, you close bad-fit deals that churn in 90 days. Prospeo's 98% email accuracy and 30+ filters - including buyer intent, funding stage, and headcount growth - help you target accounts that actually retain.
Fix churn at the source: start with better data.
2026 SaaS Benchmarks by Segment
Benchmarks are only useful if they're segmented. A 3% rate is excellent for a B2C subscription box and mediocre for enterprise SaaS.
By Industry
From Focus Digital's dataset - 100+ subscription companies representing $2.1B in ARR:
| Industry | Monthly Churn | Voluntary | Involuntary |
|---|---|---|---|
| B2B SaaS | 3.2% | 2.3% | 0.9% |
| Professional Services | 3.6% | - | - |
| Education / E-learning | 4.9% | - | - |
| B2C SaaS | 5.8% | - | - |
| Media / Streaming | 6.4% | - | - |
| Fitness & Wellness | 7.2% | - | - |
| E-commerce Subs | 9.1% | - | - |
| Meal Kits | 12.7% | - | - |
The gap between B2B SaaS (3.2%) and meal kits (12.7%) is enormous. If you're benchmarking against "average churn" without industry context, you're benchmarking against nothing.
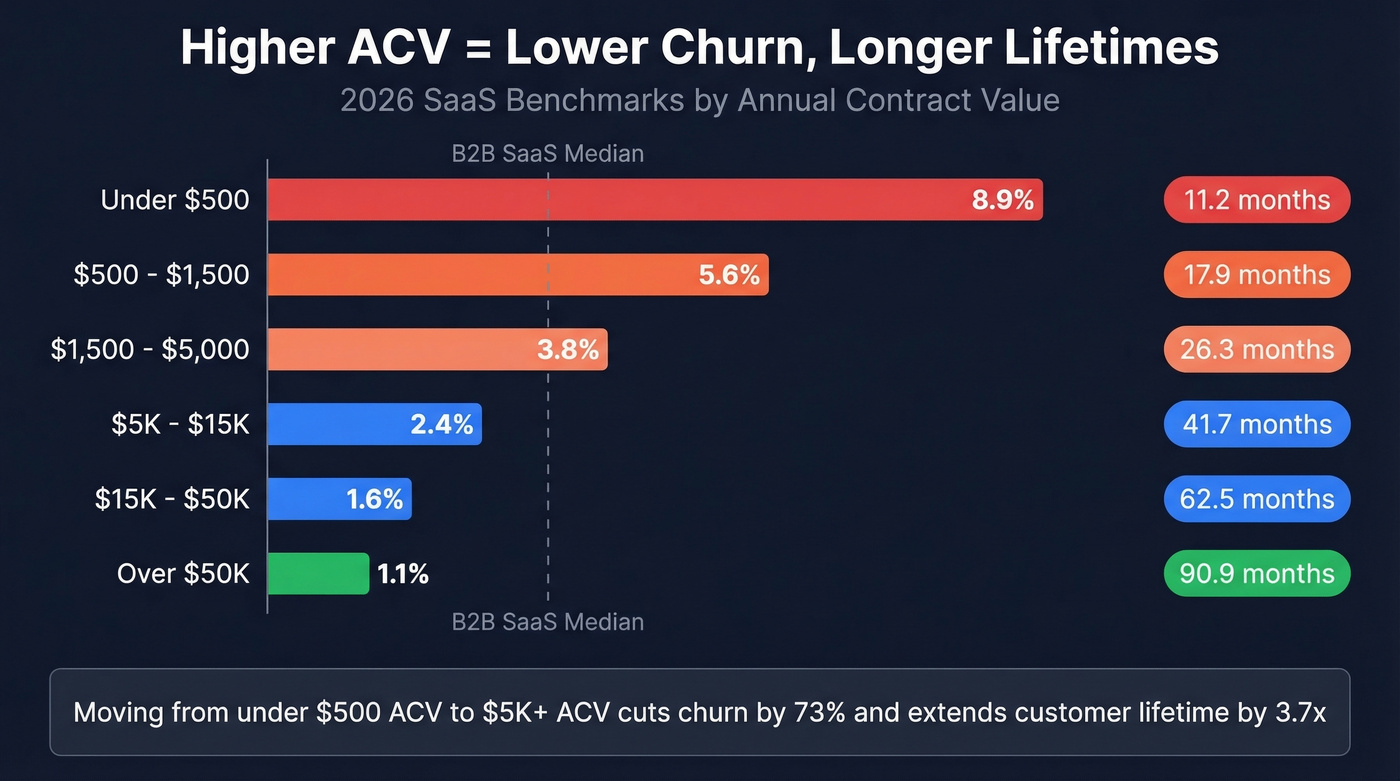
By Contract Value (ACV)
Higher-value contracts churn less - bigger deals involve more stakeholders, longer implementations, and higher switching costs:
| ACV Tier | Monthly Churn | Avg Lifetime |
|---|---|---|
| Under $500 | 8.9% | 11.2 months |
| $500-$1,500 | 5.6% | 17.9 months |
| $1,500-$5,000 | 3.8% | 26.3 months |
| $5K-$15K | 2.4% | 41.7 months |
| $15K-$50K | 1.6% | 62.5 months |
| Over $50K | 1.1% | 90.9 months |
By Company Stage (ARR Band)
We've seen early-stage teams panic over 4% churn when their stage median is 3-5%. These ranges represent median to top-quartile performance:
| ARR Band | Monthly Logo Churn | NRR Range |
|---|---|---|
| $0-$1M | 3-5% | 100-120% |
| $1M-$10M | 2-4% | 105-130% |
| $10M-$50M | 1.5-3% | 110-140% |
| $50M+ | 1-2% | 115-150%+ |
Voluntary vs. Involuntary Split
Not all churn is a product problem. Recurly's benchmark data shows overall churn at 3.27%, split between voluntary (2.41%) and involuntary (0.86%). Involuntary churn - failed payments, expired cards, billing errors - accounts for 18-32% of all churn. That's churn you can fix with infrastructure, not product changes.
Is High Churn Always Bad?
A founder on r/SaaS posted about running 15% monthly churn - and being profitable with 25% month-over-month growth. Their CAC was $50, LTV was $400, and the unit economics worked despite a rate that would make most VCs flinch.
Here's the thing: most teams over-index on churn rate and under-index on the system around it. A 15% rate is catastrophic if your CAC payback is 18 months. It's survivable if payback is under 2 months and you're growing faster than you're leaking. The number matters less than the system it sits inside. In our experience, the teams that obsess over hitting a benchmark number without context are the ones that misallocate retention spend - throwing money at onboarding when the real problem is they're closing the wrong customers.
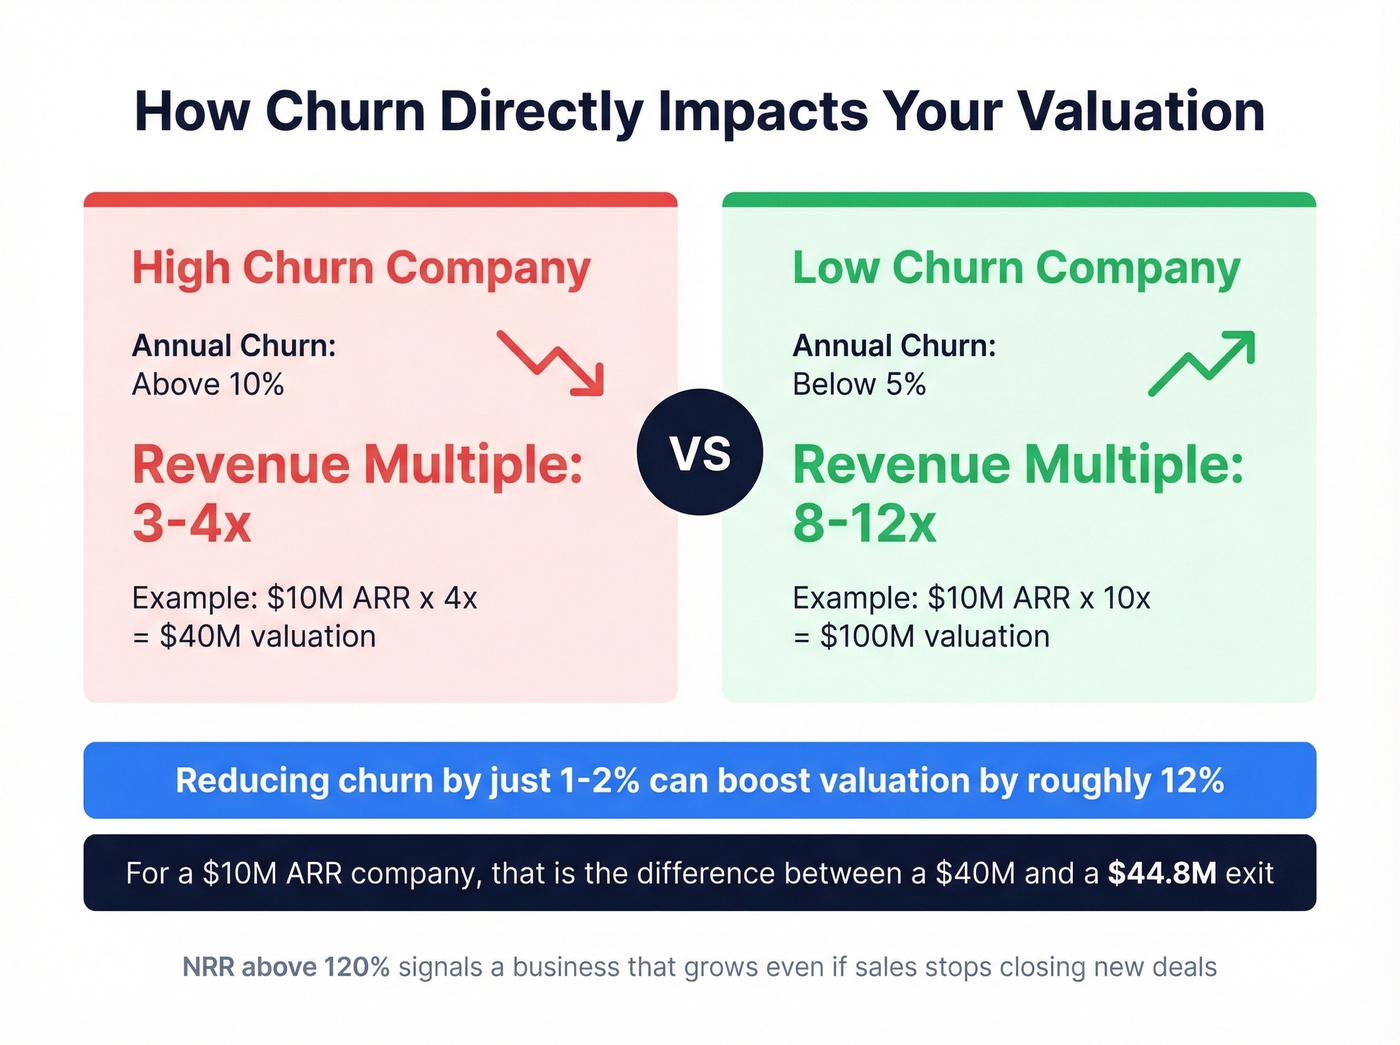
How Churn Affects Valuation
Companies with annual churn above 10% typically trade at 3-4x revenue. Companies below 5% command 8-12x multiples. That's a 2-3x difference in enterprise value driven by a single metric.
Reducing churn by 1-2% can boost valuation by roughly 12%. For a $10M ARR company valued at 4x revenue ($40M), that's the difference between about a $40M and a $44.8M exit. And in due diligence, NRR is the number acquirers drill into - net revenue retention above 120% signals a business that grows even if sales stops closing new deals.
How to Reduce Monthly Churn Rate
Fix Involuntary Churn First
This is the highest-ROI move because it requires zero product changes. Smart dunning sequences, automatic card updaters, and retry logic for failed payments deliver an average 16x ROI per Recurly's research. If involuntary churn is 18-32% of your total, you can cut overall churn by roughly that amount just by fixing billing infrastructure.
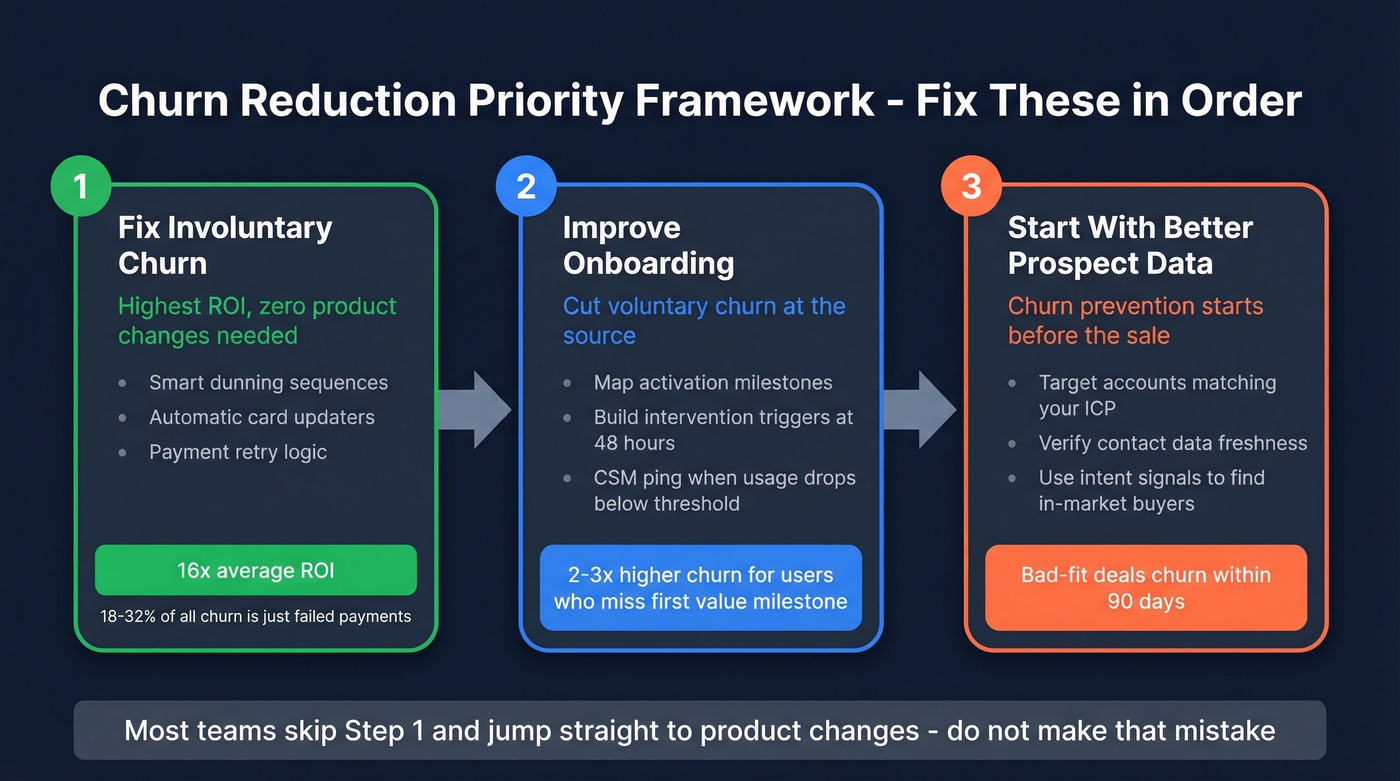
Do this before you touch onboarding or product. Seriously. We've watched teams spend six months redesigning their onboarding flow while 25% of their churn was just expired credit cards.
Improve Onboarding to Cut Voluntary Churn
Onboarding is where voluntary churn lives and dies. Customers who don't reach their first value milestone within the first two weeks churn at 2-3x the rate of those who do. Map your activation metrics, identify where users drop off, and build intervention triggers - an automated email when someone hasn't completed setup after 48 hours, a CSM ping when usage drops below threshold. This is cheaper than building new features and faster than repositioning.
Baremetrics has a solid breakdown of activation-based retention strategies if you want to go deeper.
Start With Better Prospect Data
Let's be honest about something most churn articles ignore: churn prevention starts before the sale. When outbound teams work with stale contact data, they end up closing customers who were never a good fit - wrong company size, wrong use case, wrong budget tier. Those customers churn within 90 days and drag your numbers down.
We've seen this pattern repeatedly across teams that switch to tools like Prospeo, where 98% email accuracy and a 7-day data refresh cycle mean your pipeline starts with prospects who actually match your ICP. Better data in, better customers out, lower churn downstream.
If you're building lists at scale, data enrichment and lead enrichment help you qualify accounts before they ever hit a sequence.
Skip this step if your inbound-to-outbound ratio is 90%+ inbound. But for any team where outbound drives a meaningful share of pipeline, data quality is a churn lever that's hiding in plain sight - especially if you're leaning on sales prospecting techniques or account-based selling.
Your NRR won't hit 120%+ if you're acquiring the wrong customers. Prospeo tracks 15,000 intent topics so you reach in-market buyers - not tire-kickers who inflate your logo churn next quarter. At $0.01 per verified email, the cost of better targeting is a rounding error compared to one churned account.
Stop replacing churned revenue. Start acquiring customers who expand.
FAQ
What's a good monthly churn rate for SaaS?
The B2B SaaS median is around 3.2%. Early-stage companies ($0-1M ARR) typically see 3-5%, while companies above $50M ARR target 1-2%. Always benchmark against your stage and ACV tier - a self-serve product at $29/mo will always churn faster than a $50K enterprise deal.
How do you convert monthly churn to annual?
Use: Annual Churn = 1 - (1 - monthly rate)^12. A 5% monthly rate compounds to roughly 46% annually, not 60%. Multiplying by 12 overstates the figure because it ignores that each month's base shrinks.
Can you have a negative churn rate?
Yes - net revenue churn turns negative when expansion revenue from existing customers exceeds losses from cancellations and downgrades. About 40% of SaaS companies at $15-30M ARR achieve negative churn, making it a key signal investors look for during due diligence.
How does bad prospect data increase churn?
Stale or inaccurate contact data leads sales teams to close poor-fit customers who churn within 90 days. Accurate prospecting tools and enrichment platforms help ensure outbound targets match your ICP, reducing early-stage attrition before it hits your retention metrics.