The Sales Manager's Pipeline Management Playbook: Frameworks, Benchmarks, and Hard Truths
It's Thursday afternoon. Your CRM says $4.2M in pipeline. Your VP wants a forecast by EOD. You scroll through the deals - and your gut says maybe $800K of this is real. The rest? Stale demos from Q1, "verbal commits" that went silent, and a handful of deals your reps swear are "close" but haven't had a buyer interaction in six weeks.
You're not alone. Pipeline management for sales managers starts with accepting an uncomfortable truth: most of what's in your CRM isn't real. One company had pipeline value at nearly 10x annual revenue. Sounds incredible - until you learn they hadn't closed a single new deal in 12 months. When they finally applied real qualification criteria, 86% of that pipeline evaporated. The remaining 8% that was actually real? That's what got them growing again. I'll share the full story later.
Pipeline management isn't about having more pipeline. It's about knowing what's real.
The Cheat Sheet
Before we go deep, here's the short version:
Your pipeline coverage number is probably lying to you. Raw coverage is a vanity metric. A $4M pipeline with 70% stuck in early stages isn't 4x coverage - it's maybe 1.5x when you weight by stage probability. Use weighted coverage or you're flying blind.
Cancel team pipeline reviews. Run 30-minute 1:1s weekly instead. Team reviews become performative status updates where reps over-commit under pressure. 1:1s are where real coaching happens.
If your reps can't reach the contacts in your pipeline, nothing else matters. Bounced emails and disconnected numbers mean deals enter the pipeline but never progress. Fix data quality before you fix anything else.
You don't need $250/user/month tools. A well-configured CRM plus clean, verified contact data gets you 80% of what Gong and Clari deliver. Save the revenue intelligence spend until you're past 50 reps.
Now let's get into the frameworks that make this work.
What Managing Your Pipeline Actually Means Day-to-Day
There's a terminology problem in sales that causes real confusion - and it starts at the top.
Pipeline tracks individual deal progression. It's the seller's view of active opportunities: who's in play, what stage they're at, what needs to happen next. Funnel measures aggregate conversion rates from marketing to close - a volume view, not a deal view. Forecast is a revenue projection based on probability-weighted pipeline value. It answers "how much will we close this quarter?" while pipeline answers "what are we working on right now?"
Managers need all three, but pipeline oversight is the daily discipline. It's the thing you can actually control.
And it matters more than most managers realize. 63% of companies say managing their sales pipeline is their top sales priority. Organizations with a well-defined process report 28% higher revenue growth. Top-performing sales managers are 52% more likely to excel at pipeline planning and analysis than their average-performing peers.
Here's the thing: this isn't a dashboard you check. It's a set of decisions you make every week - which deals to advance, which to kill, which reps need coaching, and where your coverage gaps are going to bite you next quarter. The dashboard just shows you where to look. The managers who treat pipeline as a living system they actively shape outperform those who treat it as a report they passively read. Every time. Whether you're overseeing SDR prospecting at the top of the funnel or coaching AEs through late-stage negotiations, the discipline is the same.
Pipeline Stages and What Each One Should Mean
Most pipeline problems start with stage definitions. If "Discovery" means something different to every rep on your team, your pipeline data is garbage - and every metric built on top of it is garbage too.

The fix: define each stage by what the buyer has done, not what the rep has done. "I sent a proposal" isn't a stage change. "The buyer reviewed terms and came back with questions" is.
| Stage | Buyer Action Required | Close Probability |
|---|---|---|
| Prospecting | N/A - outbound | 5-10% |
| Discovery | Buyer confirms problem | 15-25% |
| Demo/Presentation | Buyer engages stakeholders | 30% |
| Proposal/Quote | Buyer reviews terms | 50% |
| Negotiation | Buyer negotiates contract | 80% |
| Verbal Commit | Buyer confirms intent | 90-95% |
| Closed-Won | Signed | 100% |
These probabilities aren't arbitrary - they should be calibrated to your actual historical data. If your team closes 40% of deals that reach Proposal, use 40%, not the generic 50%. The generic numbers above are starting points for teams that don't have enough data yet.
Pipeline Velocity: The Formula That Ties It Together
Pipeline velocity tells you how much revenue your pipeline generates per day:
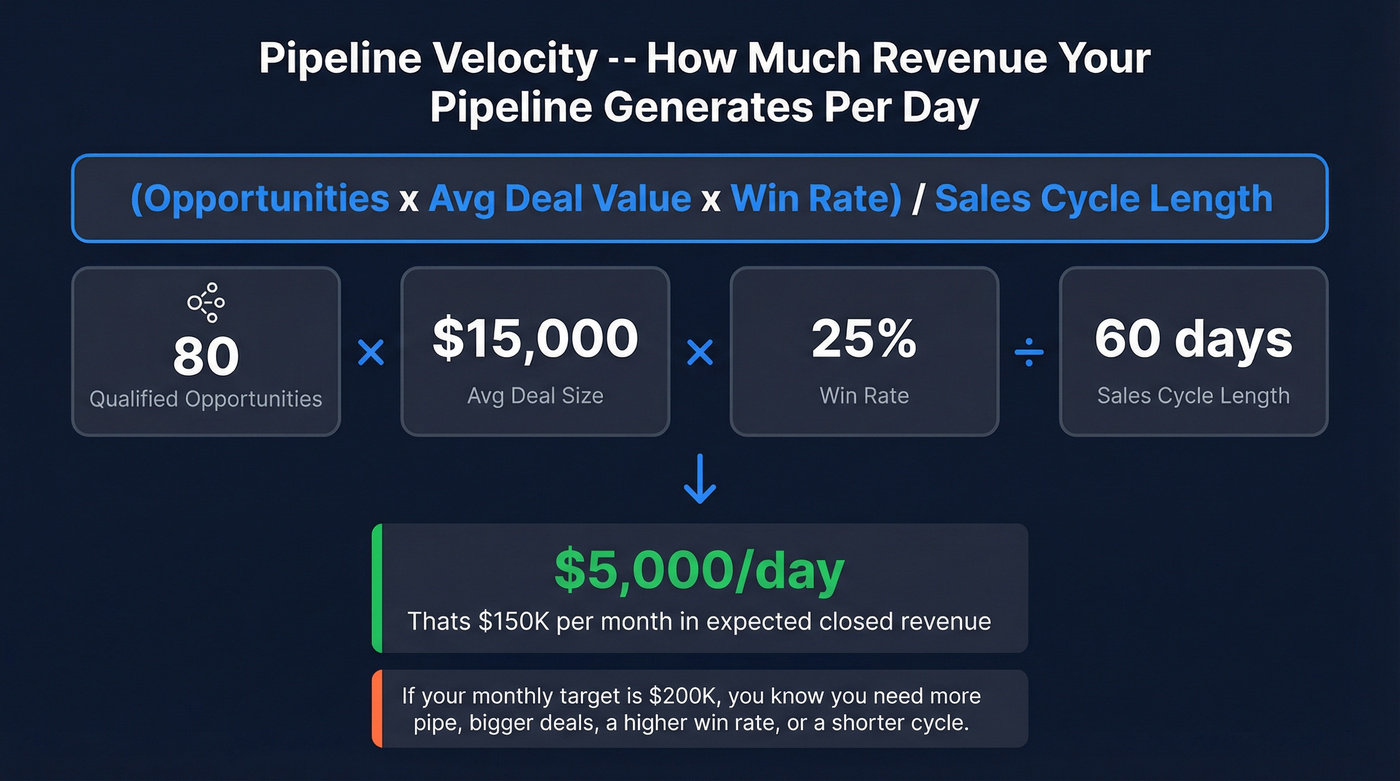
(Opportunities x Average Deal Value x Win Rate) / Sales Cycle Length
Worked example: 80 qualified opportunities, $15,000 average deal size, 25% win rate, 60-day average cycle.
(80 x $15,000 x 0.25) / 60 = $5,000/day
That's $150K/month in expected closed revenue. If your monthly target is $200K, you know immediately you need more pipe, bigger deals, a higher win rate, or a shorter cycle. Velocity makes the math visible - and it makes the conversation with your VP concrete instead of hand-wavy.
You just read that 86% of one company's pipeline was fake. Bad contact data is the silent killer - bounced emails and dead numbers mean deals stall before they start. Prospeo's 98% email accuracy and 125M+ verified mobiles ensure every opportunity in your CRM has a real path to a conversation.
Stop managing ghost pipeline. Start with data that actually connects.
Pipeline Benchmarks Every Sales Manager Should Know
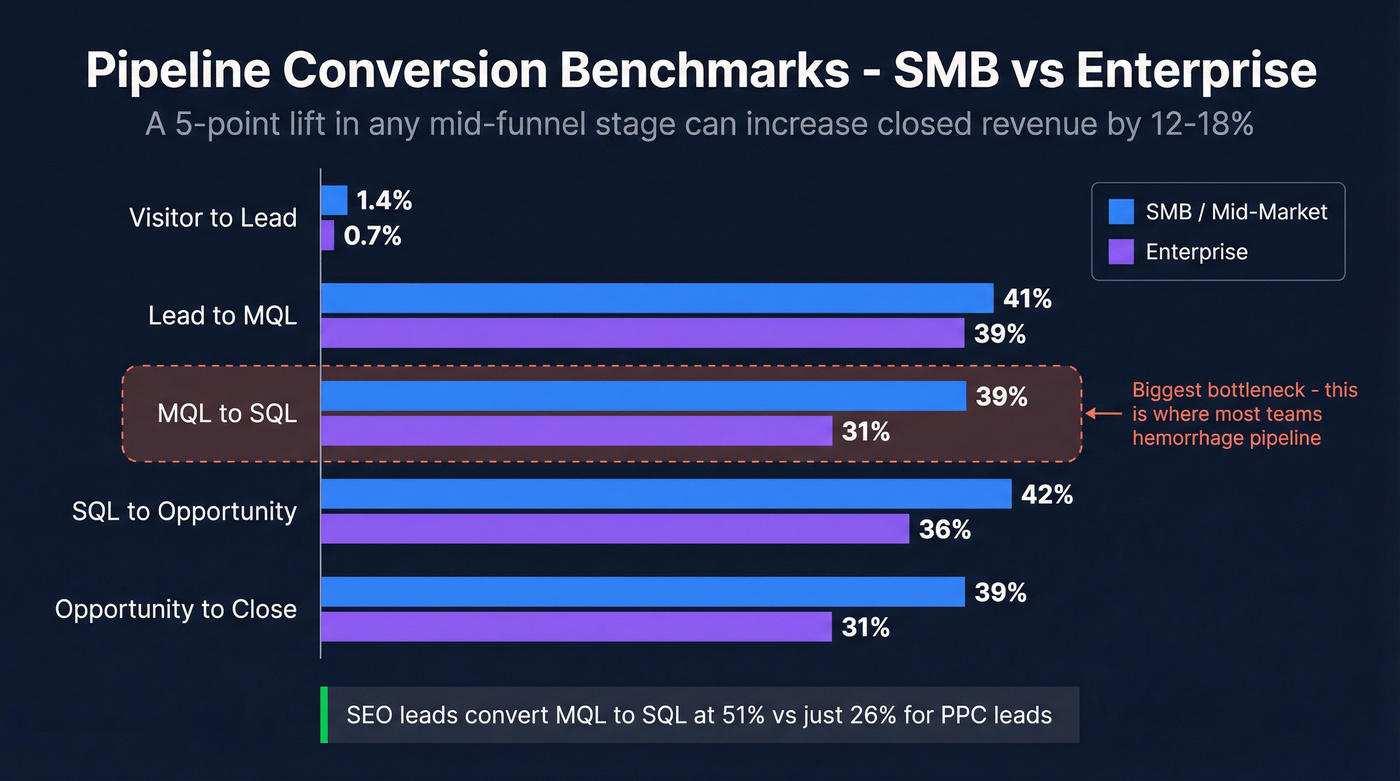
A 5-point lift in any mid-funnel conversion stage can increase total closed revenue by 12-18%.
You don't need to fix everything. Find the one stage where deals are leaking and plug that hole first. That stat should reframe how you read the benchmarks below - they're not academic, they're a diagnostic tool.
Stage-by-Stage Conversion Rates
| Stage Transition | SMB/Mid-Market | Enterprise |
|---|---|---|
| Visitor to Lead | 1.4% | 0.7% |
| Lead to MQL | 41% | 39% |
| MQL to SQL | 39% | 31% |
| SQL to Opportunity | 42% | 36% |
| Opportunity to Close | 39% | 31% |
The biggest bottleneck across the board is MQL to SQL, which runs 15-21% in many organizations. In our experience, this is where most teams hemorrhage pipeline without realizing it - it's where marketing and sales alignment either works or falls apart. Enterprise firms close at 31% opportunity-to-close versus 39% for SMBs - longer cycles, more stakeholders, more ways for deals to die.
Here's a stat most pipeline articles miss: SEO-generated leads convert MQL to SQL at 51%, compared to just 26% for PPC leads. If your pipeline is fed primarily by paid channels, your mid-funnel conversion rates will look anemic no matter how good your sales process is. The quality of what enters the pipeline matters as much as how you manage it.
Pipeline Velocity by Industry
| Industry | Avg Deal Size | Win Rate | Cycle Length | Daily Velocity |
|---|---|---|---|---|
| SaaS & Tech | $12,400 | 22% | 67 days | $1,847 |
| Healthcare | $18,700 | 25% | 72 days | $1,523 |
| Manufacturing | $47,800 | 19% | 124 days | $1,289 |
The median sales cycle across B2B sits at 84 days, with the optimal range being 46-75 days. If your cycle runs longer than 90 days and you're not selling six-figure enterprise deals, something's broken - usually qualification or multi-threading.
Pipeline Coverage - The Number That Predicts Your Quarter
Coverage ratio is the single most important metric for a sales manager overseeing pipeline. It answers one question: do we have enough pipeline to hit our number?
Total Pipeline Value / Revenue Target = Coverage Ratio
The minimum coverage you need is simply 1 divided by your win rate. Close 25% of opportunities? You need at least 4x. Close 20%? You need 5x. The math is unforgiving.
| Sales Type | Win Rate | Min Coverage | Recommended |
|---|---|---|---|
| High-velocity / SMB | 40-50% | 2x | 2.5-3x |
| B2B Mid-Market | 25-33% | 3-4x | 4-5x |
| Enterprise | 15-20% | 5-7x | 6-8x |
But here's where most managers get burned.
Why Raw Coverage Is a Vanity Metric
Raw coverage counts every deal at face value. A $500K deal in Discovery gets the same weight as a $500K deal in Negotiation. That's insane - one has a 20% chance of closing and the other has an 80% chance.
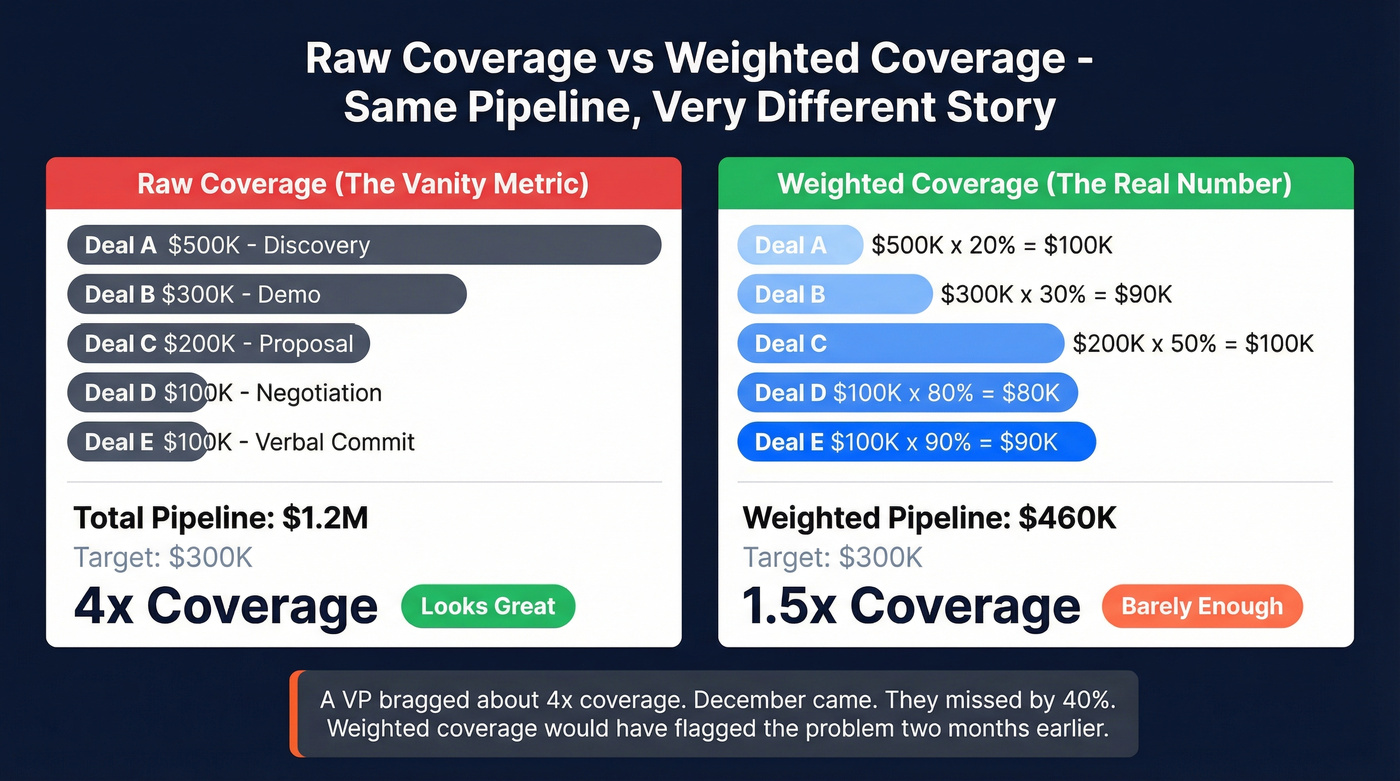
Weighted Coverage Ratio = Weighted Pipeline / Revenue Target
To calculate weighted pipeline, multiply each deal's value by its stage probability. A $100K deal in Discovery (20% probability) contributes $20K. A $100K deal in Negotiation (80%) contributes $80K. Sum those up and you've got your weighted pipeline.
I've seen a VP walk into a board meeting bragging about $8M in pipeline against a $2M target - 4x coverage, looks great. December arrived. They closed $1.2M. A 40% miss. Half that pipeline was stale deals that hadn't moved in months. Weighted coverage would've shown the real number was closer to 1.5x, and the alarm bells would've rung in October instead of January.
Coverage Benchmarks by Sales Type
The table above gives you the math, but there's a subtlety most articles miss: high coverage can mask rep-level problems. If your team shows 5x coverage but one rep has 8x (sandbagging) and another has 1.5x (starving), the team number is meaningless. Break coverage down by rep, by stage, and by time-to-close. That's where the coaching opportunities live.
When coverage falls short, you've got three levers: generate more opportunities, increase deal sizes, or improve win rates. Most managers default to "more pipe" - but improving win rate from 20% to 25% has the same effect as adding 25% more opportunities. And it's usually cheaper.
How to Run a Pipeline Review That Doesn't Waste Everyone's Time
A former CRO put it bluntly on Reddit: "Pipeline meetings are wastes of time and just busywork. Most CRMs hold all the data one would or should get from a pipeline meeting."
He's not wrong - about the way most companies run them. The typical team pipeline review is a status update disguised as a meeting. Reps recite deal narratives. The manager nods. Everyone leaves. Nothing changes.
A pipeline review is NOT:
- A status check
- A forecasting meeting
- An open-ended discussion
- A rep-led narrative where the manager just listens
It's a coaching session with a framework.
The 5 Pillars of an Effective Pipeline Review
- Qualification - Are these deals real? Do they have a confirmed problem, budget, and timeline?
- Coverage - Does this rep have enough weighted pipeline to hit their number?
- Next Steps - Is there a specific, buyer-driven action with a date attached?
- Forecast Accuracy - Are stage assignments matching reality, or is the rep being optimistic?
- Sales Execution - Is the rep having the right conversations with the right people?
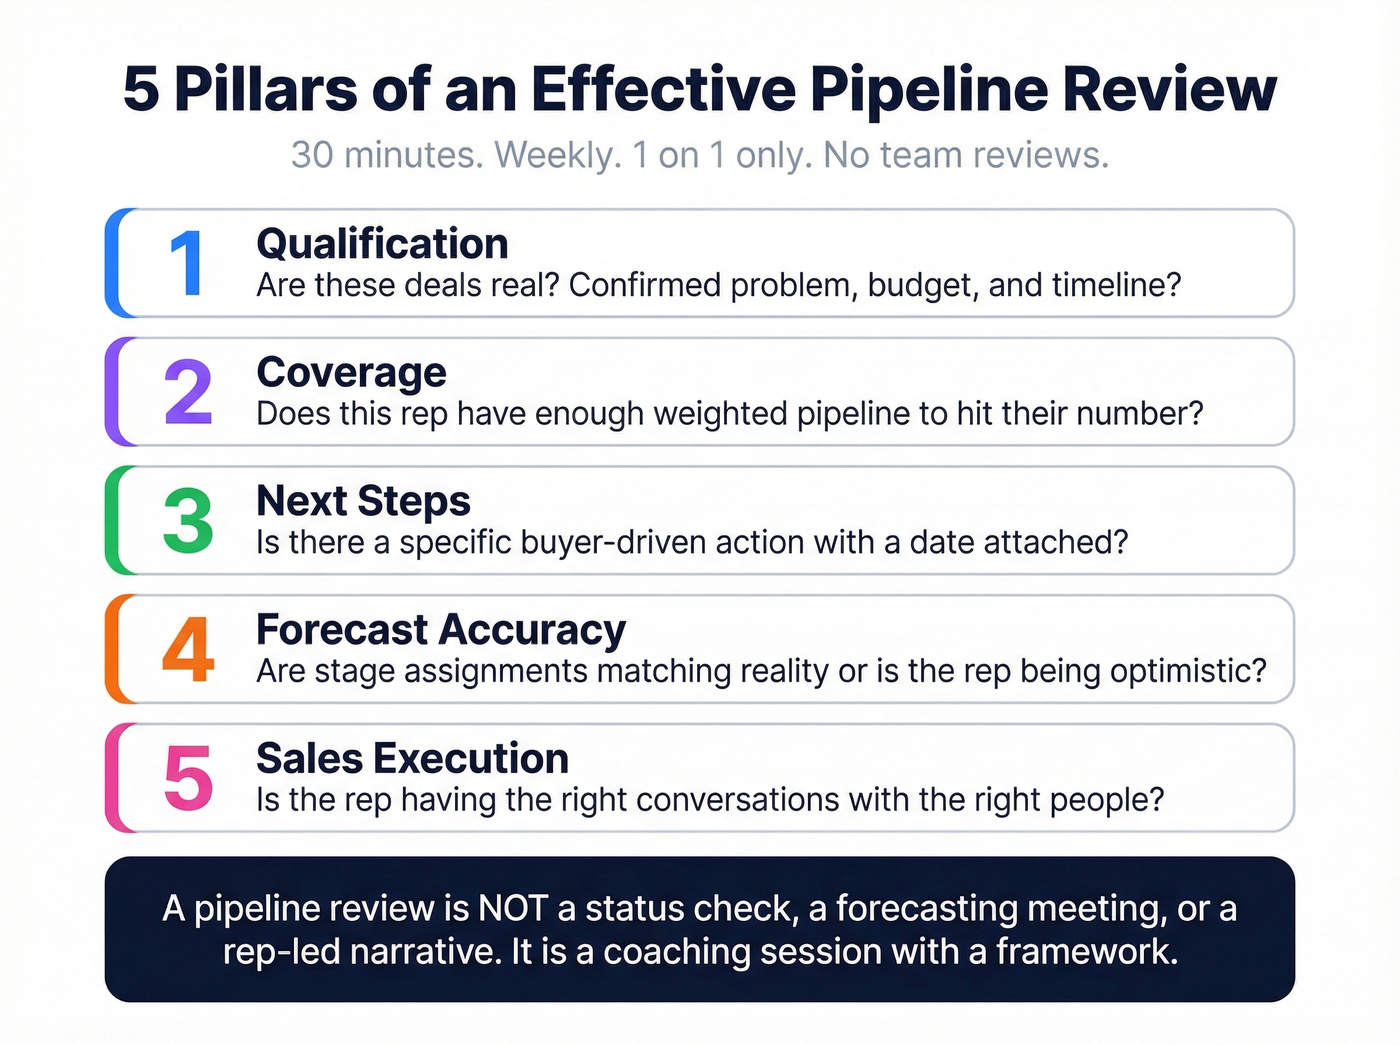
Thirty minutes. Weekly. 1:1 only. Cancel the team-wide review - it's where reps perform instead of getting coached. Richard Harris tells a story about a rep who quit specifically because her manager ran painful pipeline reviews where he never understood her process. That's not an edge case. That's what happens when reviews become interrogations instead of coaching.
The Questions That Actually Matter
For every deal worth inspecting, ask four things:
- "What is the buyer's problem?" (If the rep can't articulate this clearly, the deal isn't qualified.)
- "Who is the economic buyer?" (Not the champion. The person who signs.)
- "What is the decision process?" (How many steps? Who else is involved?)
- "What is the compelling event?" (Why would they buy now instead of next quarter?)
If a rep can't answer these for a deal they've had for 30+ days, that deal probably isn't real.
Common Pipeline Review Mistakes (and Fixes)
No agenda or structure. Fix: Use the 5 Pillars framework above. Every review follows the same format.
Gut-feeling decisions. Fix: Pull CRM data before the meeting. Look at days-in-stage, last buyer activity, and deal velocity - not vibes.
Inconsistent stage definitions. Fix: Define stages by buyer actions, not rep actions. Write them down. Train on them quarterly.
Irregular cadence. Fix: Weekly, same day, same time. No exceptions. Infrequent reviews let red flags fester.
Blame culture. This one's the silent killer. If reps fear punishment for honest updates, they'll hide bad news. Frame reviews as problem-solving sessions, not performance tribunals. A rep who tells you a deal is dead is more valuable than one who pretends it's alive until the quarter ends.
No documented action items. Fix: End every 1:1 with 2-3 specific next steps written in the CRM, not in a notebook. If it's not in the system, it didn't happen. Follow up on last week's action items before discussing new deals - this is what separates coaching from conversation.
Why Your Forecast Is Wrong (And How to Fix It)
79% of sales organizations miss their forecast by more than 10%. That's not a rounding error - that's the difference between hitting plan and missing payroll for new hires.
The accuracy gap comes down to method. Here's how different forecasting approaches stack up:
| Method | Typical Accuracy | Best For |
|---|---|---|
| Rep Roll-Up | +/-25-35% | Small teams, early-stage |
| Weighted Pipeline | +/-18-25% | Mid-market, clean CRM |
| Historical Trend | +/-15-20% | Stable, mature businesses |
| AI/ML-Assisted | +/-8-15% | 50+ reps, 12+ months data |
Companies using Salesforce's Einstein Forecasting report a 29% improvement in forecast accuracy. But AI models are only as good as the data you feed them - garbage CRM data produces confidently wrong forecasts, which is worse than no forecast at all.
Forecast accuracy also decays over time. A 30-day forecast runs 85-90% accurate. Push that to 90 days and you're down to 65-75%. Accuracy drops 5-8% per month of forecast horizon. This is why quarterly forecasts made in month one are basically fiction.
The 5 Forecast Accuracy Killers
Sandbagging. Reps understate pipeline to lower expectations, then "overperform." Feels good for the rep. Destroys planning for everyone else.
Happy Ears. The buyer said "this looks great" and the rep heard "we're buying." Confirmation bias is the silent killer of forecast accuracy.
Zombie Deals. Opportunities that haven't moved in 60+ days but nobody wants to kill them. They inflate coverage and distort forecasts simultaneously.
Stage Confusion. When "Proposal Sent" and "Proposal Reviewed" are the same stage in your CRM, you can't distinguish between a deal that's progressing and one that's sitting in someone's inbox unread.
End-of-Quarter Stuffing. Reps push deals into the current quarter's forecast to hit activity metrics, knowing they'll slip. This is a management problem, not a rep problem - if you incentivize optimistic forecasting, you'll get optimistic forecasts.
Companies with accurate forecasts are 7.3% more likely to hit quota. And businesses with aligned RevOps functions - where sales, marketing, and customer success share pipeline data and definitions - grow revenue up to 19% faster. Pipeline management doesn't exist in a silo. If your marketing team defines "qualified" differently than your sales team, your forecast is broken before it starts.
Pipeline Hygiene and the Data Quality Problem Nobody Talks About
One sales manager on Reddit described managing 9 reps and feeling like he was "constantly playing catch up" - tried automating with ChatGPT, found Gong too expensive, and still couldn't get a handle on which deals were real. That's the reality for most mid-market managers. The problem isn't intelligence or effort. It's that the underlying data is rotten.
Remember that company with 10x pipeline coverage and zero new deals? Here's the full story. ExecGroup audited a B2B company where BDMs had been told to "put opportunities in the CRM" - and that was the entire pipeline management process. Management saw massive pipeline numbers and assumed growth was coming.
After applying real qualification criteria aligned with their ICP, 86% of the pipeline was removed. After visiting the remaining 14% of prospects in person, another 6% was cut. Only 8% of the original pipeline was real. The national sales manager and several BDMs were replaced. The company rebuilt with a smaller, realistic pipeline - and started growing again.
This is an extreme case, but the underlying disease is everywhere.
Stale deals with no activity for 30+ days are 80% less likely to close. Data decay costs organizations 12-25% of revenue annually. And sales reps spend 23% of their time on data entry instead of selling - which means they're not updating the very data you need to manage the pipeline.
Another Reddit thread captured the culture perfectly: reps described being told to "just move the status to X" to make the pipeline look healthy for leadership. When stage changes are performative rather than buyer-driven, every metric downstream - coverage, velocity, forecast - becomes fiction.
The 30-day stall rule is simple: if a deal hasn't had buyer-initiated activity in 30 days, it gets flagged. Not killed - flagged. Then you ask the four qualification questions. If the answers aren't there, move it out.
But there's a deeper problem: the contact data feeding your pipeline is rotting. Bounced emails and disconnected phone numbers mean reps are prospecting into a void. Deals enter the pipeline because a rep "sent an email" - but the email bounced, or the prospect changed jobs three months ago. Your CRM shows activity. Reality shows nothing.

This is where data quality tools earn their keep. Prospeo runs a 7-day refresh cycle on its 300M+ professional profiles, delivering 98% email accuracy and 125M+ verified mobile numbers. One customer, Meritt, saw their pipeline triple from $100K to $300K per week after switching, with bounce rates dropping from 35% to under 4%.
Pipeline velocity depends on four levers - and contact data quality quietly degrades all of them. When 35% of emails bounce, your cycle lengthens, win rates drop, and reps waste hours chasing dead leads. Prospeo refreshes every record every 7 days, so your pipeline reflects reality, not last quarter's data.
Real pipeline coverage starts at $0.01 per verified email.
Who Owns the Pipeline? Roles, Responsibilities, and Handoffs
Pipeline management for sales managers means overseeing the entire system, but day-to-day ownership is distributed across roles - and misalignment between those roles is where deals quietly die.
SDRs and BDRs own the top of the pipeline. SDR pipeline management is fundamentally about volume and qualification: are they generating enough meetings with prospects who actually fit the ICP? The metrics that matter here are meetings booked, show rates, and SQL conversion - not deal value. When top-of-funnel prospecting breaks down, the downstream effects are brutal: AEs waste cycles on unqualified opportunities, coverage numbers look inflated, and forecast accuracy tanks.
Account executives own their pipeline from qualified opportunity through close. The best AEs treat their pipeline like a portfolio, actively balancing early-stage opportunities against deals nearing close so they never face a coverage cliff at the start of a new quarter.
The handoff between SDR and AE is the most fragile point in most pipelines. If qualification criteria aren't shared and enforced, you get the worst of both worlds: SDRs hitting their meeting quota with mediocre prospects, and AEs burning time on discovery calls that go nowhere. As a manager, your job is to define that handoff clearly, inspect it regularly, and hold both sides accountable to the same standard.
Pipeline Management Tools Worth Your Budget
Here's my hot take: if your average deal size is under $10K, you almost certainly don't need ZoomInfo-level data or Gong-level call intelligence. A 4-person SaaS team on Reddit described outgrowing Google Sheets and panicking about tool costs - they ended up with a $14/user CRM and a data verification tool, and it worked fine.
Skip the enterprise stack until you actually need it.

CRM Platforms
| Tool | Starting Price | Best For |
|---|---|---|
| Pipedrive | $14/user/mo | Pipeline-first visualization |
| HubSpot Sales Hub | Free-$150/user/mo | Marketing + sales alignment |
| Salesforce Sales Cloud | $25-$330/user/mo | Enterprise scale |
| Close | $9/user/mo | Inside sales teams |
| Monday CRM | $12/user/mo | Non-traditional sales |
| Freshsales | $9/user/mo | Budget-conscious SMBs |
Pipedrive is the best pure pipeline tool for teams under 30 reps. It's visual, it's intuitive, and it doesn't try to be a platform. HubSpot wins when marketing and sales need to share a system. Salesforce wins when you need enterprise-grade customization - but expect to spend 2-3x the license cost on implementation and admin.
Revenue Intelligence
| Tool | Est. Price | Best For | G2 Rating |
|---|---|---|---|
| Gong | ~$100-150/user/mo + $5K platform | Call intelligence (50+ seats) | 4.7 |
| Clari | Custom pricing | Forecast accuracy | 4.6 |
Gong is genuinely excellent at conversation intelligence. But at ~$100-150/user/month plus a platform fee, you're looking at $1,200-$1,800/user/year before you add any other tools. Clari's forecasting engine is best-in-class - but it relies on clean CRM data, which most teams don't have. Both require 8+ weeks to implement properly. For teams under 50 reps, invest that budget in better data and rep coaching instead.
Data Quality & Enrichment
| Tool | Starting Price | Key Strength |
|---|---|---|
| Prospeo | Free (75 emails/mo) | 98% email accuracy, 7-day refresh |
| Apollo | $49/user/mo | Prospecting + engagement |
| ZoomInfo | ~$1/lead (enterprise) | Largest database, highest cost |
This is the category most managers underinvest in - and it's the one that determines whether your pipeline is built on real contacts or ghosts. If you want a deeper breakdown of options, start with lead enrichment and email verifier websites.
Tool Stack by Budget
Under $50/user/mo: Pipedrive or Close plus a data verification tool. This covers pipeline visibility and data quality for under $25/user/mo total. For a 10-rep team, that's ~$3,000/year.
$50-150/user/mo: HubSpot Pro or Salesforce Professional with verified contact data. You get marketing automation, deal management, and clean data. This is the sweet spot for most B2B teams with 10-50 reps.
$150+/user/mo: Salesforce Enterprise + Gong or Clari + enrichment. Only invest here when you've got 50+ reps and 12+ months of CRM data to feed the AI models. Otherwise you're buying a Ferrari to drive to the grocery store.
FAQ
What is a good pipeline coverage ratio?
Minimum coverage equals 1 divided by your win rate - a team closing 25% of deals needs at least 4x. Most B2B mid-market teams target 3-5x, but use weighted coverage adjusted by stage probability rather than raw totals. Raw coverage masks stale deals; a $4M pipeline that's 70% early-stage is worth about $1.2M weighted.
How often should sales managers review pipeline?
Weekly 1:1 reviews with each rep, 30 minutes maximum. Cancel team-wide pipeline meetings - they become performative status updates. Focus each session on deals closing this period, stalled opportunities with no buyer action in 30+ days, and newly added deals that need qualification validation.
What's the difference between pipeline, funnel, and forecast?
Pipeline tracks individual deal progression - active opportunities and their stages. Funnel measures aggregate conversion rates from marketing to close. Forecast is a revenue projection based on probability-weighted pipeline value. Managers need all three, but pipeline is the daily discipline that feeds the other two.
How do I clean a stale sales pipeline?
Flag any deal with no buyer-initiated activity in 30+ days and apply four qualification questions: confirmed problem, identified economic buyer, known decision process, and compelling event. If answers are missing, move the deal out. One company removed 86% of its pipeline this way and returned to growth within two quarters.
How does bad contact data affect pipeline health?
Stale emails and disconnected phone numbers mean reps prospect into a void - deals enter the CRM but never progress. Data decay costs organizations 12-25% of revenue annually. Tools like Prospeo that refresh contact data weekly prevent pipeline rot at the source, with 98% email accuracy versus the 79-87% typical of larger providers.