Pipeline Marketing: What It Actually Is, What It Costs, and How to Make It Work
Your CMO is in a board meeting. Someone asks what percentage of pipeline is marketing-sourced. The room goes quiet. There's a slide with MQL counts, a chart showing webinar registrations, and absolutely nothing connecting those numbers to revenue.
Fewer than 20% of sales leaders rate their pipeline forecast accuracy as "predictable." That gap between marketing activity and revenue reality is exactly what pipeline marketing exists to close.
The Short Version
This isn't a concept. It's an operating system. Define shared pipeline stages with exit criteria, pick an attribution model (start with W-shaped), set SLAs between sales and marketing, and fix your contact data so outreach actually reaches people. The rest of this guide gives you the benchmarks, formulas, and anti-patterns to execute each step.
What Is Pipeline Marketing?
Most teams confuse this with lead generation. They're not the same thing.
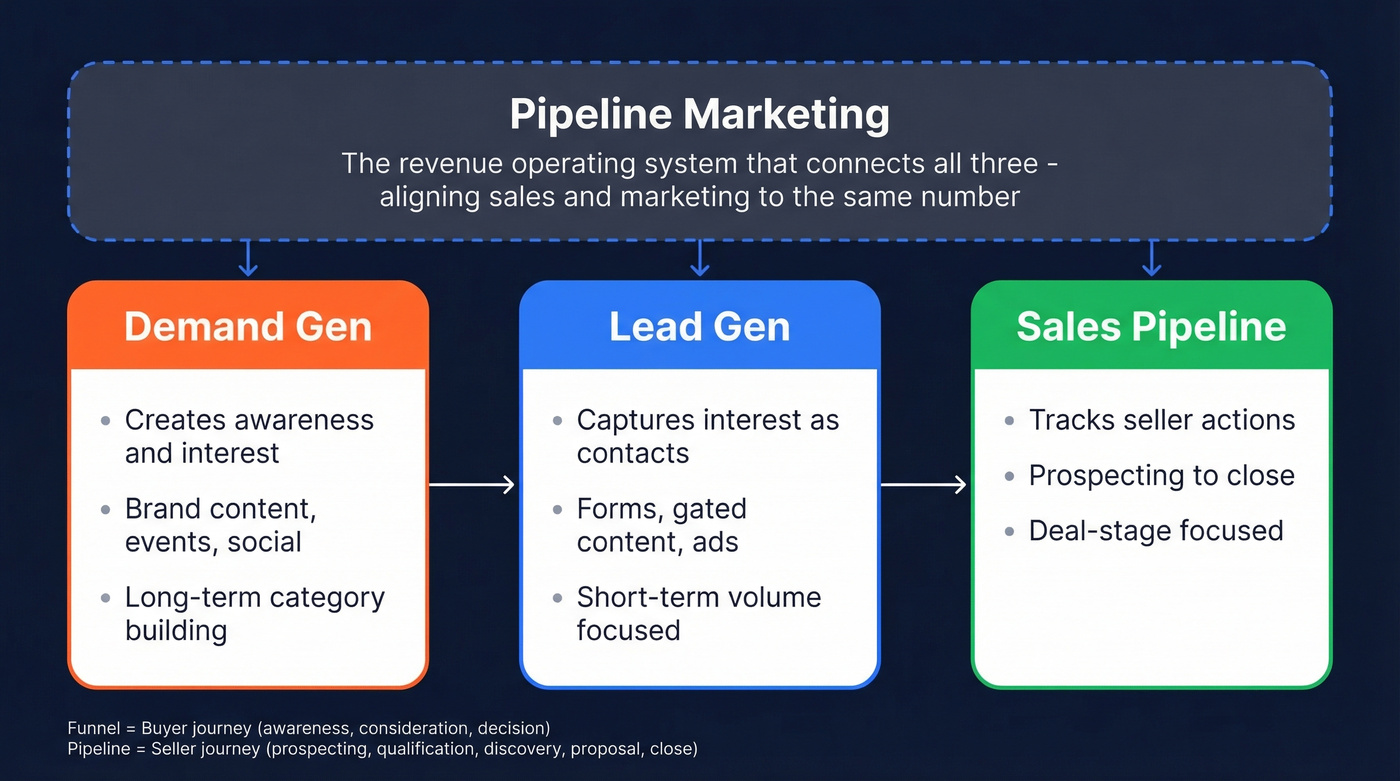
Lead generation fills the top of the funnel. Pipeline marketing is the revenue-focused operating system that tracks, measures, and optimizes the entire journey from first touch to closed deal - and holds both sales and marketing accountable to the same number. A pipeline tracks seller actions: prospecting, qualification, discovery, proposal, negotiation, close. A funnel tracks the buyer's journey: awareness, consideration, decision. Pipeline marketing sits on top of both, aligning them into a single measurement system tied to revenue.
Demand gen creates awareness and interest. Lead gen captures that interest as contacts. A pipeline-centric approach connects both to revenue outcomes - tracking how every dollar and every touchpoint contributes to deals that actually close.
The variance across organizations is wild. Some source 5-10% of pipeline from marketing, while others run at 75-100%. There's no universal "right" number. But without this operating system in place, you can't even answer the question - and that's the real problem.
How you split budget between demand gen and lead gen should flex based on your market. Creating a new category or selling into long enterprise cycles? Lean 70%+ toward demand gen. High-intent market with short cycles or a product-led motion? Flip that ratio toward lead gen. Pipeline marketing is the framework that tells you whether either investment is actually working.
Why Lead Gen Alone Isn't Enough
The old playbook is breaking. Organizations saw 20-30% MQL growth in recent years while close rates fell roughly 15%. More leads, less revenue. That's pipeline inflation - the symptom of measuring activity instead of outcomes.
Sales cycles have stretched 23% since 2023. The average B2B purchase now involves around 13 stakeholders, with 89% of decisions spanning multiple departments. Buyers are nearly 70% through their purchasing process before they ever talk to a seller.
Here's the thing: 79% of marketing leads never convert to sales - not because marketing failed, but because those leads lacked a "why now" trigger. When your sales cycle is 84 days, your buying committee has 13 people, and your close rate is falling, you can't afford to measure marketing by MQL volume. You need a system that tracks velocity, stage conversion, and revenue contribution.
B2B Benchmarks Worth Tracking
Let's get specific.
Stage Conversion by Segment
SaaS and Tech:
| Stage | Early-Stage SaaS | Growth SaaS | Enterprise |
|---|---|---|---|
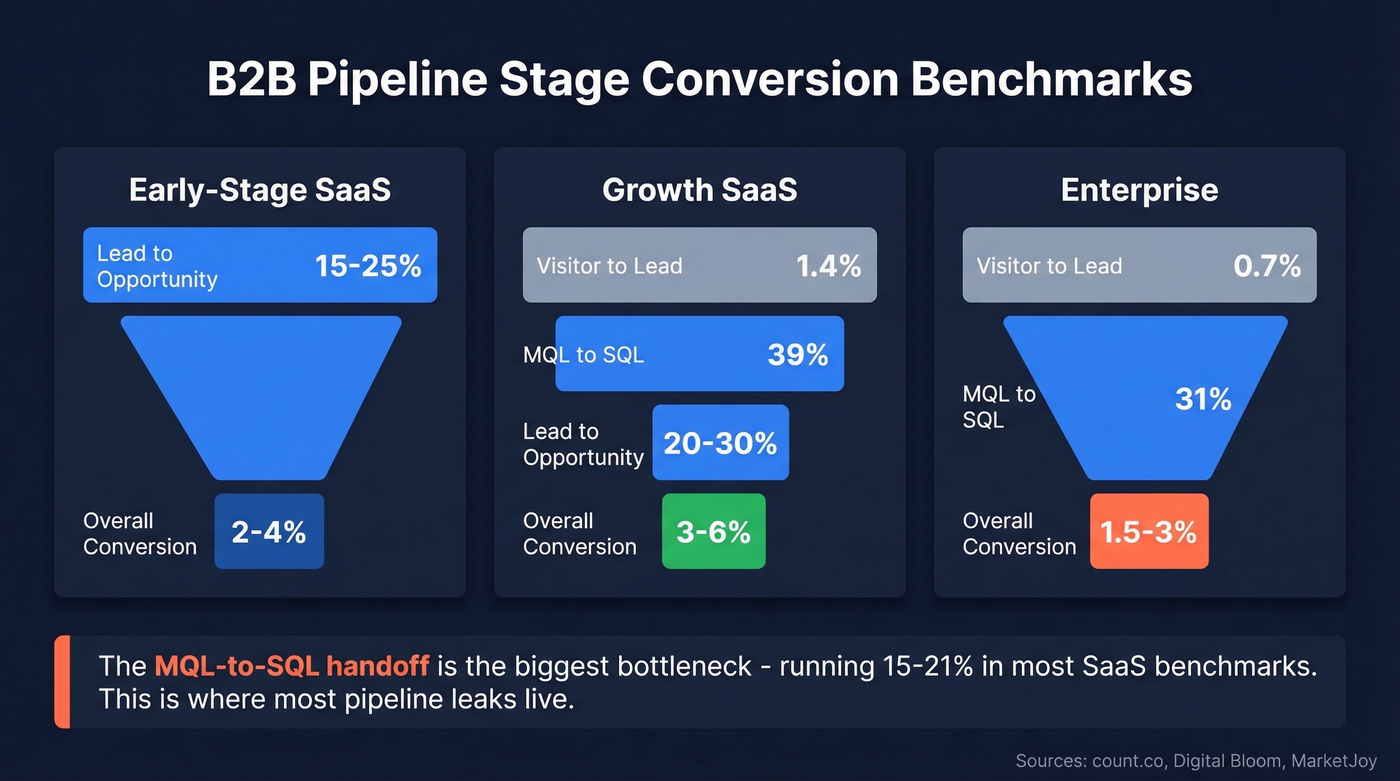
| Lead to Opportunity | 15-25% | 20-30% | - |
| Visitor to Lead | - | 1.4% | 0.7% |
| MQL to SQL | - | 39% | 31% |
| Overall Conversion | 2-4% | 3-6% | ~1.5-3% |
Professional services teams typically see 6-12% overall conversion, while manufacturing runs 4-9%. Not every stage has published benchmarks for every vertical - the data above reflects what's reliably documented.
The segment-level ranges come from count.co's benchmarks. The SaaS funnel and channel-stage rates come from Digital Bloom's SaaS funnel data. A separate MarketJoy dataset paints a more conservative picture: Lead to MQL 22%, MQL to SQL 15%, SQL to Opportunity 11%, Opportunity to Closed-Won 7%.
The MQL-to-SQL handoff is consistently the biggest bottleneck - running 15-21% in SaaS benchmark sets and around 12-18% in MarketJoy's data. We've seen teams obsess over top-of-funnel volume when their real problem is a 90-day gap between MQL and first sales touch. That handoff is where most pipeline leaks live.
Channel Conversion Differentials
| Channel | Visitor to Lead | MQL to SQL | Opp to Close |
|---|---|---|---|
| SEO | 2.1% | 51% | 38% |
| PPC | 0.7% | 26% | 35% |
| Webinars | - | 30% | - |
| Events | - | - | 40% |
SEO leads convert to SQLs at nearly double the rate of PPC leads. That's not a minor difference - it should reshape how you allocate budget if pipeline conversion, not just lead volume, is your metric.
Pipeline Velocity Formula
This is the number that ties everything together:
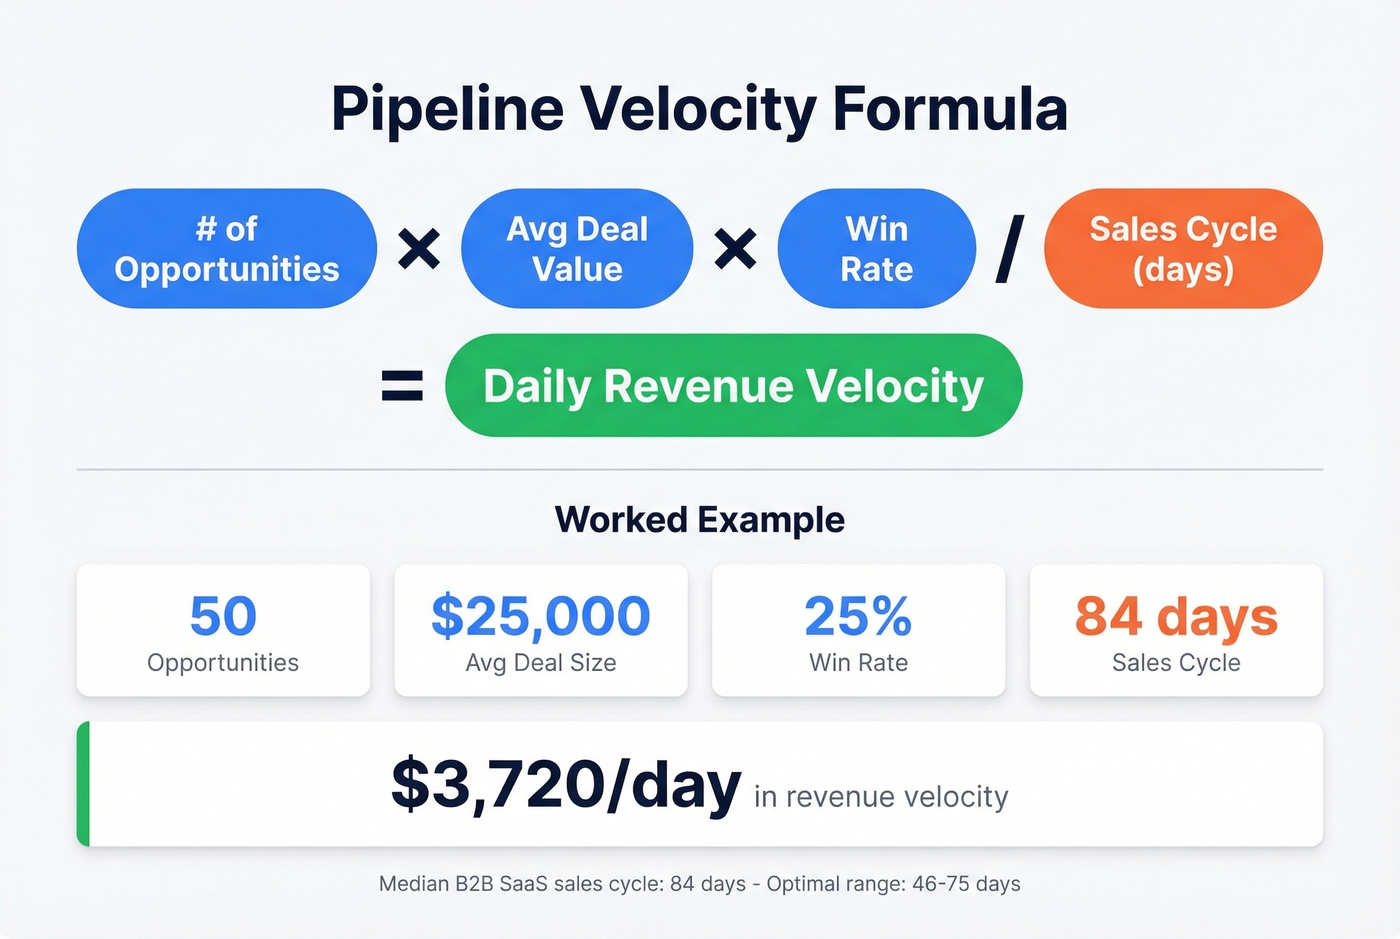
Pipeline Velocity = (# Opportunities x Avg Deal Value x Win Rate) / Sales Cycle Length
Worked example: 50 opportunities x $25,000 average deal x 25% win rate / 84 days = $3,720 in daily revenue velocity. That single number tells you more about pipeline health than any MQL dashboard. The median sales cycle across B2B SaaS runs about 84 days, with an optimal range of 46-75 days.
One caveat worth flagging: if your average deal is under $15k and your sales cycle is under 30 days, you probably don't need a full pipeline marketing stack. A CRM, clean data, and weekly pipeline reviews will get you 80% of the way there. This operating system pays off when complexity demands it - multiple stakeholders, long cycles, and enough deal volume to make the math meaningful.
79% of marketing leads never convert to sales - often because reps can't actually reach the contact. Prospeo delivers 98% email accuracy and 125M+ verified mobile numbers with a 30% pickup rate, so every opportunity in your pipeline has a real path to a conversation.
Stop inflating your pipeline with unreachable contacts.
How to Implement It
Stage Definitions and Exit Criteria
Every pipeline stage needs three things: a clear definition, measurable exit criteria, and agreement from both sales and marketing. Without these, you get pipeline leakage - stalled deals sitting in "discovery" for 90 days, duplicates inflating your numbers, and SLA breaches nobody catches.
Start here:
- Map your stages from prospecting through qualification, discovery, proposal, negotiation, and close
- Define what moves a deal from one stage to the next with measurable actions, not rep judgment
- Audit for duplicates and stalled deals weekly
- Enforce stage definitions in your CRM with validation rules, not free-text fields
SLAs and Governance
Use this if your sales and marketing teams argue about lead quality more than once a month. Skip this if you have fewer than 5 people across both teams and can just talk to each other.
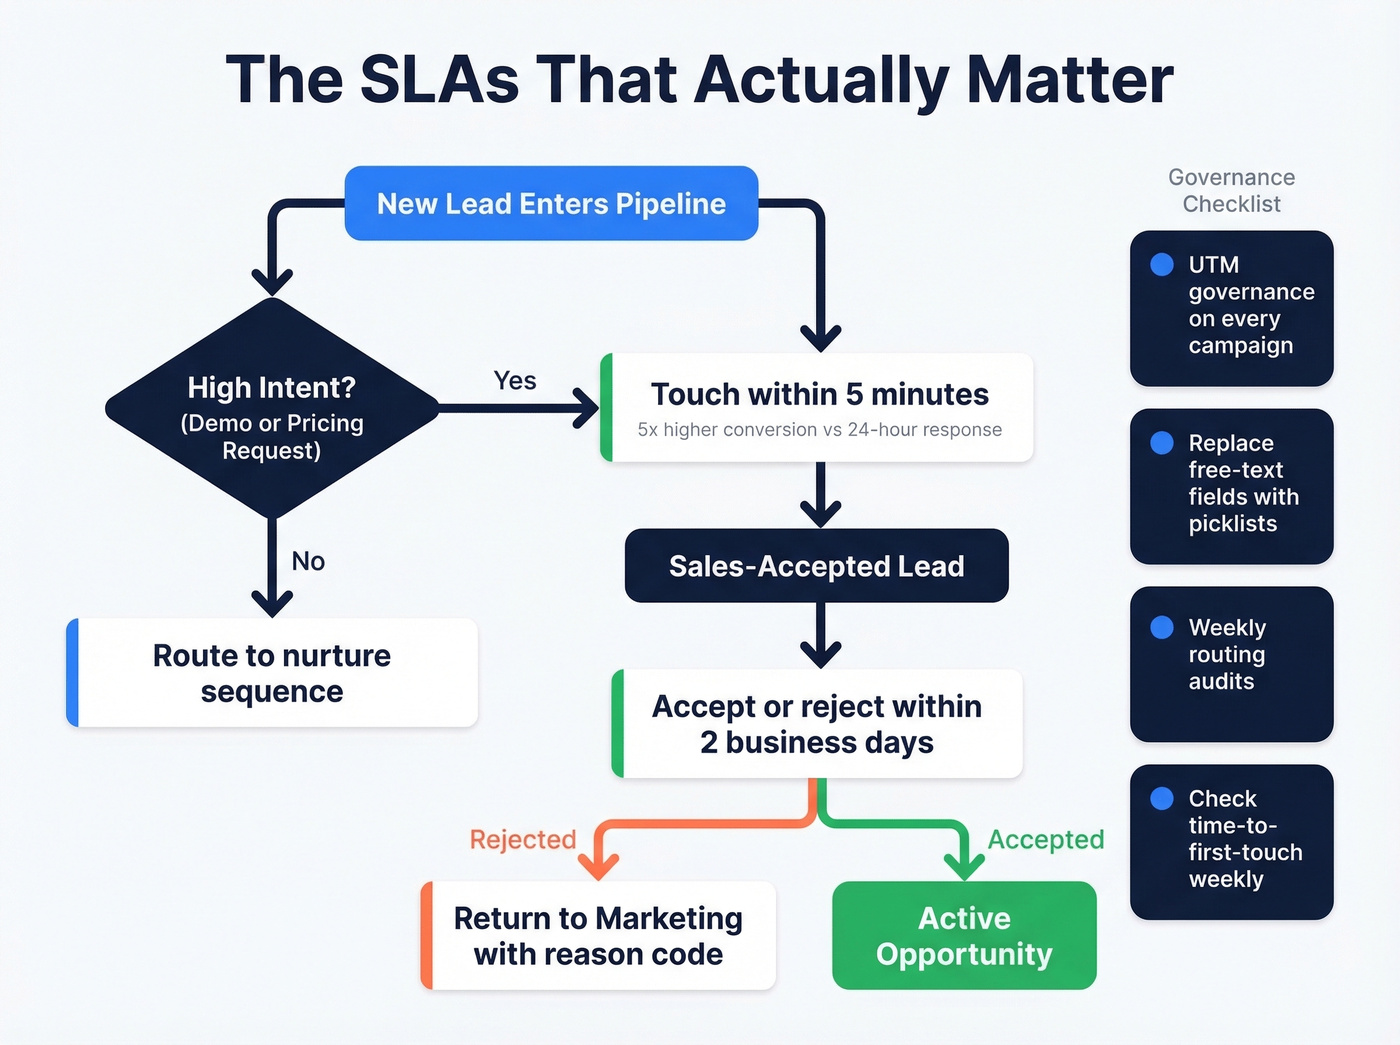
The SLAs that actually matter: demo and pricing leads touched in under 5 minutes, sales-accepted leads accepted or rejected within 2 business days, UTM governance enforced across every campaign, free-text CRM fields replaced with picklists and validation rules, and weekly routing audits checking accuracy and time-to-first-touch.
That speed-to-lead number isn't arbitrary. Contacting leads within 24 hours increases conversion by 5x. Within 5 minutes for high-intent leads, the multiplier is even higher. Most teams know this and still don't do it.
Attribution Models
| Model | Best For | Limitation |
|---|---|---|
| First-touch | Awareness channels | Ignores nurture/close |
| Last-touch | Closing channels | Ignores discovery |
| Linear | Simple multi-touch | Over-credits low-value |
| U-shaped | Lead gen programs | Misses mid-funnel |
| Time-decay | Long sales cycles | Under-credits awareness |
| W-shaped | Most B2B (start here) | Needs CRM + MA integration |
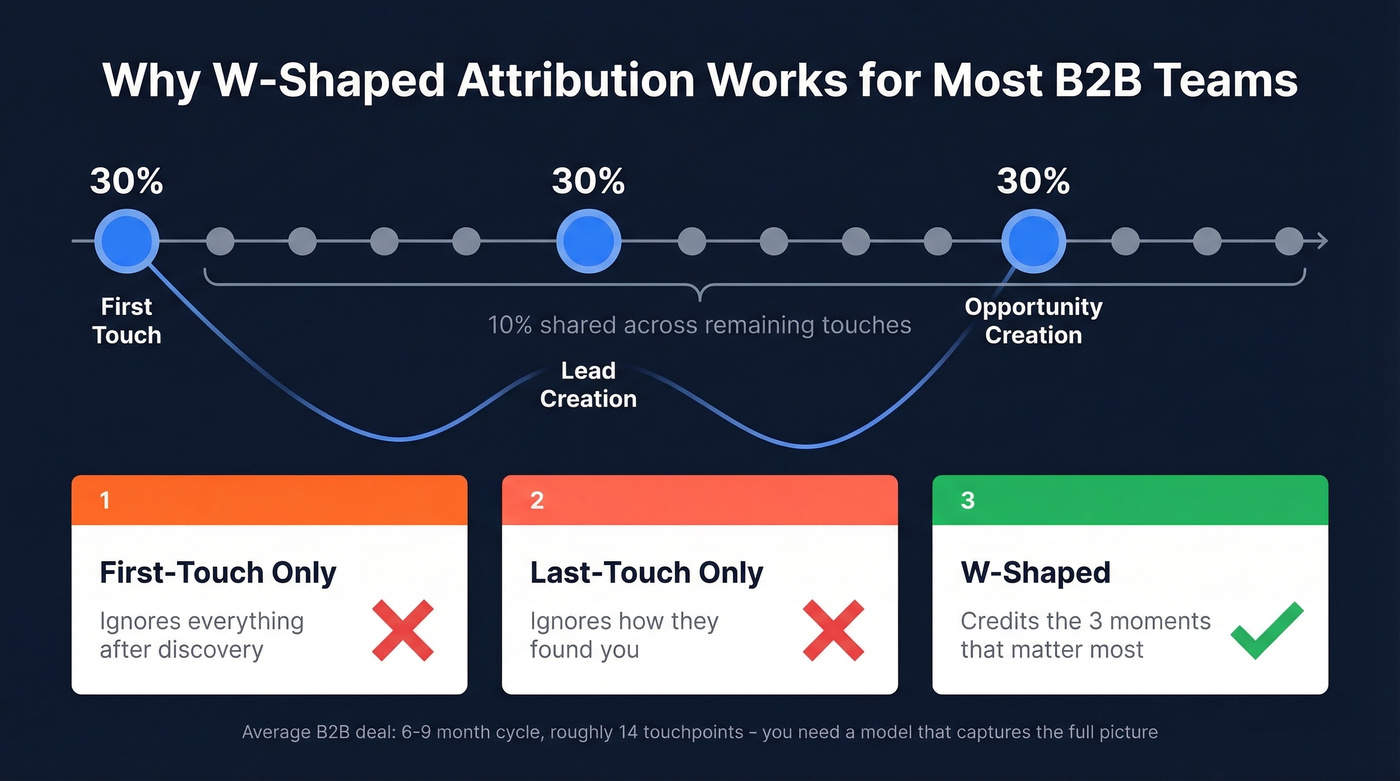
For most B2B teams, W-shaped attribution is the right starting point. It credits three critical moments - first interaction, lead creation, and opportunity creation - while distributing remaining credit across other touchpoints. When you're dealing with 6-9 month sales cycles and ~14 touchpoints, you need a model that captures the full picture without requiring a data science team to maintain.
There's real pressure behind this. In this r/b2bmarketing thread, a marketing leader spending a fraction of revenue on marketing needed oversimplified, directionally accurate formulas to prove impact to their board. W-shaped gives you that - not perfect attribution, but defensible attribution. We've tested this across dozens of implementations, and the teams that start with W-shaped and refine quarterly consistently outperform those who wait for a "perfect" model that never ships.
Data Quality as Infrastructure
Look, your pipeline velocity formula is fiction if a third of your emails bounce. We've seen this pattern over and over - teams invest in attribution, build beautiful dashboards, set SLAs, and then watch conversion rates crater because the underlying contact data is garbage. SDRs waste 40-60% of their time filtering low-intent noise and chasing bounced emails instead of working real opportunities.
The Meritt case study makes this concrete. Their bounce rate was 35%. Pipeline sat at $100K/week. After fixing the data layer, bounce rate dropped under 4%, and pipeline tripled to $300K/week. Same team, same strategy, same ICP - different data.
Prospeo addresses this at the infrastructure level with 98% email accuracy, a 7-day data refresh cycle versus the 6-week industry average, and 300M+ professional profiles. When your conversion rates reflect your strategy instead of your data quality, every other investment in your revenue engine compounds.

The full tech stack adds up fast. CRMs range from free tiers to $150+/user/month for enterprise editions. Marketing automation platforms like Marketo or Pardot typically run $1,000-$5,000+/month. Attribution tools like HockeyStack or Bizible cost $1,000-$6,000+/month. Intent data platforms like Bombora run $2,000-$8,000+/month, while enterprise ABM suites from Demandbase or 6sense start at $30,000-$120,000+/year. Prospeo starts with a free tier and scales at roughly $0.01/email with no contracts - a fraction of what most teams spend on tools that sit on top of bad data.
Signal-Based Pipeline Generation
The shift from volume-based to signal-based pipeline generation is the biggest strategic change happening in B2B right now. Instead of blasting 10,000 contacts and hoping 2% convert, signal-based teams identify accounts showing active purchase behavior and concentrate outreach there.
The concept of "intent density" captures this well - it's the concentration of buying signals within a single account. When multiple stakeholders at the same company are researching your category, visiting competitor pages, and hiring for roles your product supports, that's a high-intent-density account. More importantly, it's an account with a "why now" trigger. Those 79% of marketing leads that never convert don't fail because of bad messaging. They fail because there's no urgency driving the purchase. Signal-based approaches filter for urgency first, then activate outreach.
ABM is the primary lever. 9 in 10 organizations now run ABM programs, with 81% reporting stronger ROI than other tactics. The key is committee-level coverage - mapping those 6-13 roles in the buying group with role-specific proof points for finance, IT, security, ops, and executive stakeholders. Buying groups that reach consensus are 2.5x more likely to report high-quality deals.
Think about your pipeline in three segments: Land for new logos where you're building awareness and creating first opportunities, Expand for existing customers with upsell and cross-sell potential, and Protect for renewals at risk. Each segment needs different signals, different content, and different velocity targets. Aligned teams hit targets 73% of the time. The math is clear.
Pipeline velocity depends on four variables - but none of them matter if your contact data decays faster than your sales cycle. Prospeo refreshes all 300M+ profiles every 7 days, not the 6-week industry average. When your median deal takes 84 days to close, stale data kills deals silently.
Keep your pipeline data fresher than your sales cycle is long.
Mistakes That Kill Revenue
The most dangerous mistake isn't tactical - it's expectational. One r/marketing thread captured it perfectly: a Series A SaaS company with a $30k+ ACV product, long sales cycles, and no existing funnels asked their new marketing hire to double pipeline in 90 days. That's not ambitious. It's delusional.
The anti-patterns that kill pipeline revenue:
- Unclear ICPs. If your ICP is "companies with 50-5,000 employees in North America," you don't have an ICP. You have a TAM. (addressable market)
- Tactic-first planning. "We need a webinar series" isn't a pipeline strategy. Start with the pipeline math, then pick tactics. (funnel metrics)
- Vanity metrics without conversion context. MQLs are meaningless without MQL-to-SQL rates. Impressions are meaningless without pipeline influence. (lead generation metrics)
- Siloed teams. Marketing measures MQLs. Sales rejects them. RevOps stitches together fragmented attribution. Nobody owns the pipeline number. (RevOps)
- Generic messaging. When 13 stakeholders are involved in a purchase, "one-size-fits-all" content reaches nobody. (B2B brand positioning)
Map every metric to a business outcome. Impressions to pipeline influence. MQLs to SQL conversion rate to revenue sourced. If a metric doesn't connect to pipeline, stop reporting it.
Pipeline Growth in Action
One B2B campaign generated 792% ROI in 120 days, building a $1.9M/year recurring revenue funnel from 269 executive downloads of a single authority asset. Customer acquisition cost ran 12.6% initially, dropping to under 3.1% by year three. The framework was simple - authority asset, targeted executive outreach, pipeline. (cost to acquire customer)
Snyk's results reinforce the data quality angle. With 50 AEs prospecting 4-6 hours per week, they cut bounce rates from 35-40% to under 5%, drove AE-sourced pipeline up 180%, and generated 200+ new opportunities per month. Clean data didn't just improve metrics - it unlocked an entirely different scale of pipeline production. (email bounce rate)
The pattern across both cases is the same: strategy plus clean data plus disciplined execution equals compounding pipeline growth. No shortcuts, no "double pipeline in 90 days" magic.
FAQ
What's the difference between pipeline marketing and demand generation?
Demand generation creates awareness and interest. Pipeline marketing is the operating system that tracks and optimizes the entire revenue journey from first touch to closed deal - including demand gen. Think of demand gen as one input and the pipeline framework as the layer connecting all inputs to revenue.
What percentage of pipeline should marketing source?
Most B2B SaaS teams target 30-50% marketing-sourced pipeline, though the range spans 5% to 100% depending on sales motion and maturity. The more important question is whether you can measure it at all, which requires shared stage definitions and a real attribution model.
How do you calculate pipeline velocity?
Pipeline velocity = (number of opportunities x average deal value x win rate) / sales cycle length in days. The result is your daily revenue velocity. Improving any of the four variables accelerates the whole system.
What's the best attribution model for B2B?
W-shaped attribution is the strongest starting point - it credits first interaction, lead creation, and opportunity creation while distributing remaining credit across other touchpoints. Refine quarterly as you accumulate data. Most teams outperform by iterating rather than waiting for a perfect model.
How does contact data quality affect pipeline results?
Bad data inflates pipeline numbers while killing actual conversion. When 35% of emails bounce, your velocity formula is fiction. Fixing the data layer - through tools like Prospeo that maintain 98% email accuracy on a 7-day refresh cycle - gives teams the clean infrastructure every other pipeline investment depends on.
Your pipeline velocity number is the single best health check for your revenue engine. Calculate it today, set a baseline, and measure every marketing and sales initiative against whether it moves that number. Everything else is noise.