How to Build a QBR Presentation That Doesn't Waste Everyone's Time
You've spent 10 hours building a deck that an executive will skim for three minutes before asking "so what's the ask?" That's the QBR presentation problem in one sentence. 72% of senior executives think most QBRs are a waste of time, and the average manager burns 8-12 hours preparing each one.
Here's the thing: most of that prep time goes to formatting slides and reconciling data, not thinking strategically. We've watched teams pour days into decks that get derailed by the first question. The fix isn't working harder on the deck - it's building a fundamentally different kind of deck.
The quick version: Your QBR needs an 8-slide core narrative. Lead with an executive summary, show 4-6 headline metrics with RAG indicators , present 3-4 insights as observation then implication, propose 3-5 priorities with owners, and end with a clear ask. Send the deck as a pre-read. Use the meeting for decisions, not data dumps.
What Is a QBR Presentation?
A QBR (quarterly business review) presentation is a structured deck that summarizes the previous quarter's performance, highlights what matters, and aligns stakeholders on priorities for the next quarter. Not a data dump. Not a status report. A decision-making tool.
You'll sometimes hear "EBR" (executive business review) used interchangeably. QBR refers to the quarterly cadence, EBR refers to the executive audience. Some teams combine them into an EQBR. Don't overthink the label - focus on the content.
The 8-Slide Template That Works
Most QBR decks fail because they report what happened instead of what it means. This 8-slide structure flips that: start with insight, end with a decision. Total deck length should land between 15-25 slides including appendix, but the core narrative lives in these eight.
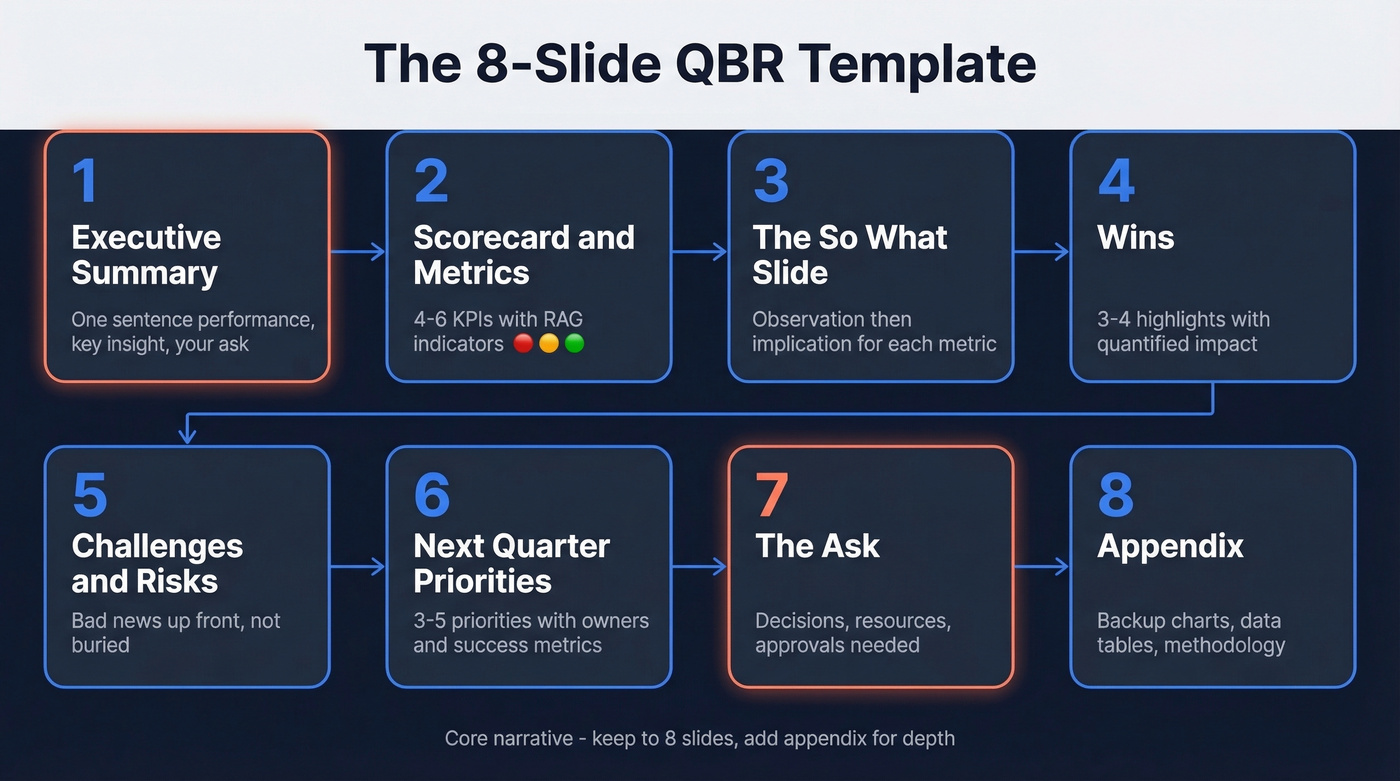
Executive Summary (Slide 1)
This is the only slide that matters if the exec checks out after 60 seconds. It needs three things: the quarter's performance in one sentence, the single most important insight, and your ask.
"Q4 exceeded target by 12% (£2.4M vs £2.1M goal), driven primarily by referral channel growth. Recommend doubling referral budget to £100K. Need approval for £50K incremental spend by January 15."
That's the entire slide. If the exec reads nothing else, they know the score, the opportunity, and what you need from them. Remember - your deck often gets forwarded up the chain. Build it so your champion can use it to justify the renewal internally (and if you're tightening the renewal story, a simple churn analysis view helps).
Scorecard & Metrics (Slide 2)
Four to six key numbers - not 12, not 20. Each metric gets a target, an actual, a variance, and a visual indicator in green, amber, or red. The exec should scan this slide in five seconds and know where things stand.
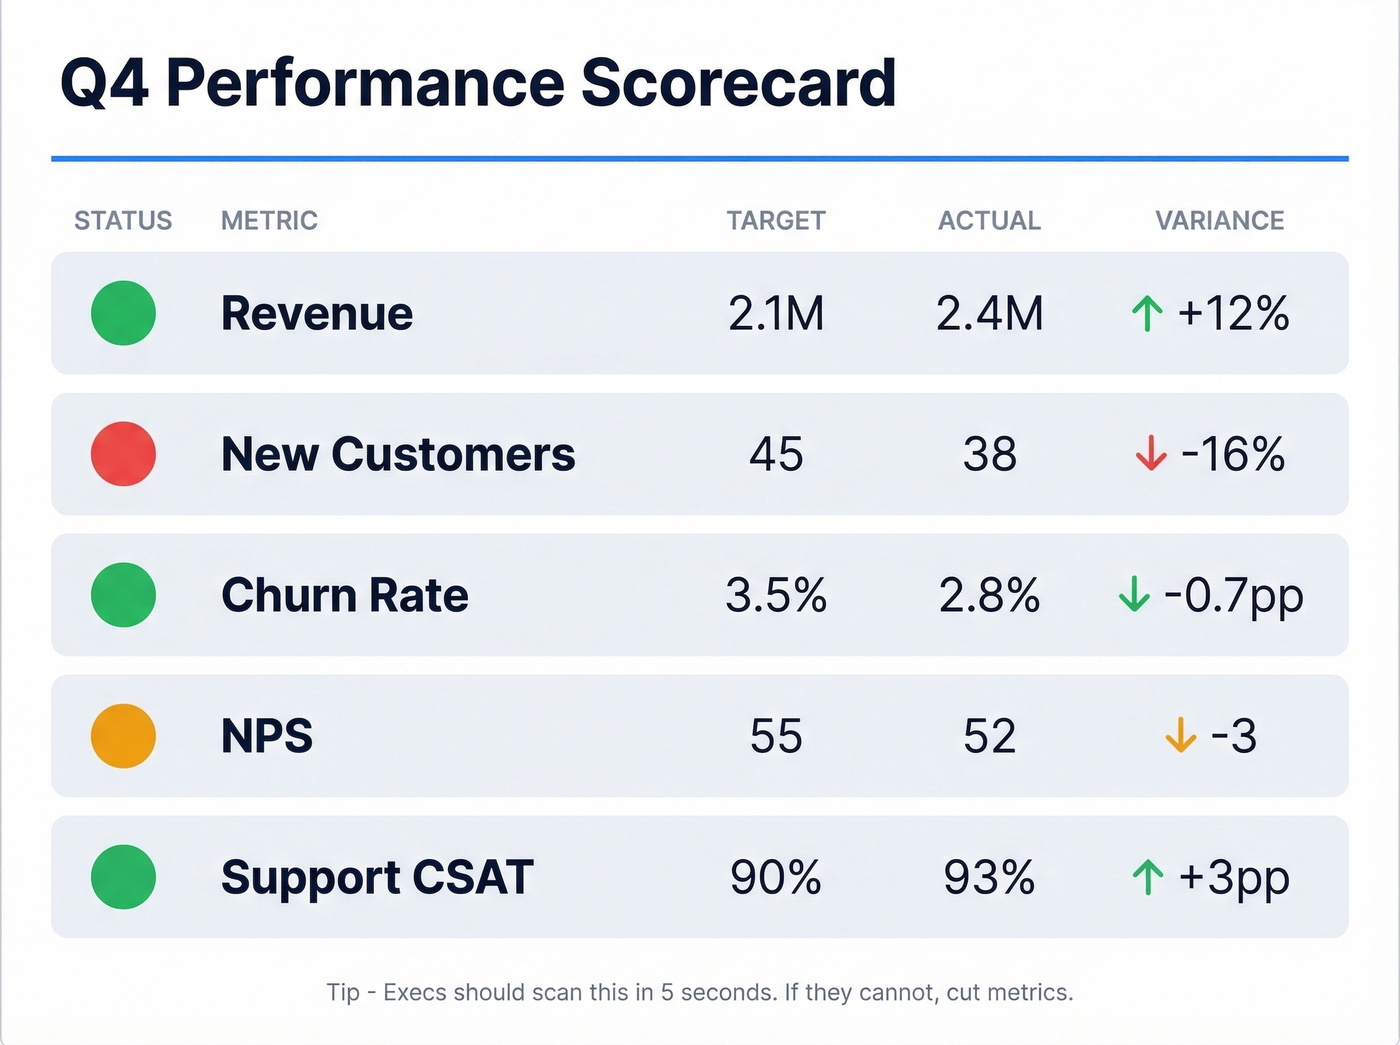
| Metric | Target | Actual | Variance | Status |
|---|---|---|---|---|
| Revenue | £2.1M | £2.4M | +12% | 🟢 |
| New Customers | 45 | 38 | -16% | 🔴 |
| Churn Rate | 3.5% | 2.8% | -0.7pp | 🟢 |
| NPS | 55 | 52 | -3 | 🟡 |
| Support CSAT | 90% | 93% | +3pp | 🟢 |
Five metrics. One table. No paragraphs of explanation - that's what the next slides are for.
Insights, Priorities & The Ask (Slides 3-8)
Slide 3 - The "So What?" Slide. This is where most QBRs fall apart. Take 3-4 metrics from the scorecard and structure each as observation then implication.
"New customer acquisition fell 16% despite pipeline growth - our close rate dropped, likely due to the pricing change in October. Implication: we need to revisit mid-market packaging before Q2 pipeline hits."
That's the kind of thinking executives want. Not a restatement of the number they already saw on Slide 2.
Slide 4 - Wins. Three to four highlights with quantified impact. Celebrate what worked, but keep it tight - two sentences per win, max.
Slide 5 - Challenges & Risks. Don't bury bad news. Executives smell spin, and hiding problems destroys credibility faster than any red metric ever will.
Slide 6 - Next-Quarter Priorities. Three to five priorities max, each linked to an insight from Slide 3. Every priority needs an owner and a success metric. If it doesn't have both, it's a wish, not a plan (this is where sales execution discipline shows up).
Slide 7 - The Ask. Without a clear ask, your QBR could have been an email. What decisions do you need? What resources? What approvals? Be specific.
Slide 8 - Appendix. Everything else. The 15 backup charts, the granular data tables, the methodology notes. Available if someone asks, invisible if they don't.
Choosing the Right Metrics
The right metrics depend on your function. Mural's framework offers a solid taxonomy - pick the 5-7 that matter most for this quarter's story:
| Category | Example Metrics |
|---|---|
| Revenue growth | ARR, MRR, expansion revenue |
| Usage & adoption | DAU/MAU, feature adoption, login frequency |
| Renewal & churn | Gross/net retention, churn rate |
| Satisfaction | NPS, CSAT, CES |
| Support health | Ticket volume, resolution time, escalation rate |
| Expansion opportunity | Upsell pipeline, whitespace analysis |
Don't include a metric just because you have the data. If you need a tighter way to frame the story, borrow from funnel metrics and keep the scorecard to what drives decisions.
Marketing QBR Metrics
For marketing-specific reviews, Kellblog's framework is worth stealing: marketing-sourced opportunity count - not dollars, which are lagging indicators - pipeline conversion rates on a trailing-twelve-month basis, and 3.0x day-one pipeline coverage at quarter start.
One metric most teams overlook is CRM data freshness. 86% of buyers are more likely to buy when they feel their goals are understood, but if your contact records haven't been enriched recently, your adoption and outreach metrics are built on stale records. Tools like Prospeo refresh CRM data on a 7-day cycle with an 83% match rate, so the numbers in your review reflect reality rather than contacts who left the company six months ago (more options in our roundup of data enrichment services).
Your QBR scorecard is only credible when the underlying data is fresh. Prospeo enriches your CRM with 50+ data points per contact at a 92% match rate - refreshed every 7 days, not every 6 weeks. Stop presenting metrics built on stale records.
Present QBR numbers you can actually defend. Start enriching free.
Mistakes That Kill QBRs
We've sat through enough bad quarterly reviews to spot the patterns. The consensus on r/CustomerSuccess is that most decks are "too wordy" and need to be "more visual" - which tells you teams already know their decks aren't working but keep making the same mistakes anyway. Here are the seven that do the most damage:
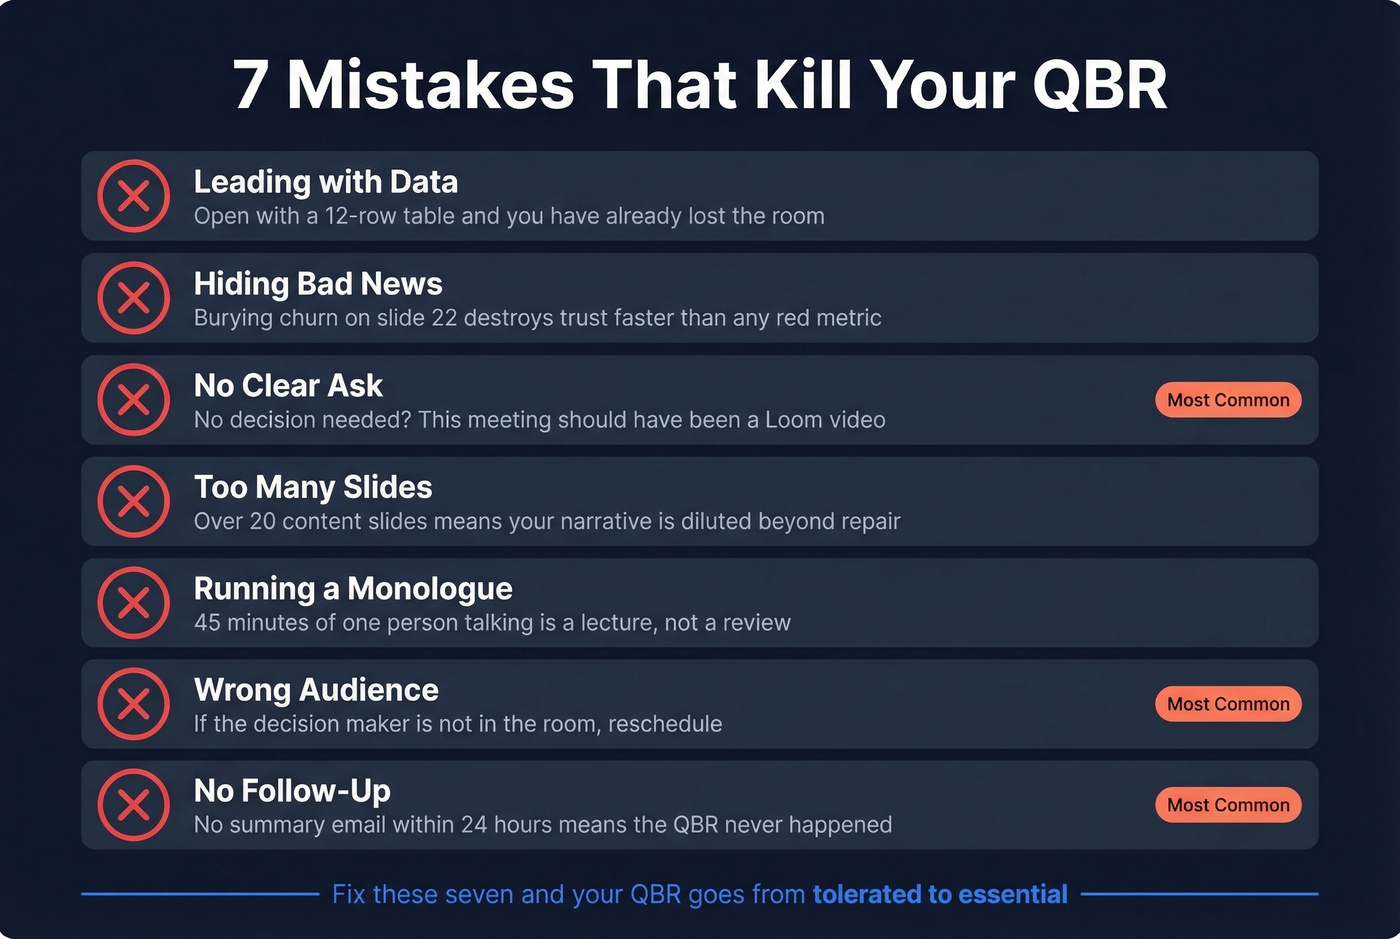
Leading with data instead of narrative. Opening with a 12-row metrics table signals "data dump." Lead with the story, then support it with numbers (if you need help structuring the narrative, use a sales deck storytelling framework).
Hiding bad news. If churn spiked, say so on slide 3, not slide 22. Burying problems makes you look untrustworthy.
No clear ask. The single biggest QBR killer. If there's no decision to make, you just held a meeting that should've been a Loom video.
Too many slides. If your content deck exceeds 20 slides excluding appendix, you're including data that belongs in a pre-read. Bloated decks dilute your narrative and guarantee executives tune out before you reach the ask.
Running a monologue. A review where one person talks for 45 minutes isn't a review - it's a lecture. Kapta flags this as a hallmark of inexperience. Build in discussion time.
Not involving decision-makers. If the person who can approve your ask isn't in the room, you're presenting to the wrong audience. Skip the meeting and reschedule.
No follow-up. A QBR without a follow-up email summarizing decisions, owners, and deadlines within 24 hours is a QBR that didn't happen (keep a few sales follow-up templates handy so it actually gets sent).
Design Tips That Keep Executives Engaged
Stop treating your slides as a document to be read aloud.
The best QBR presentation design follows a simple principle: one idea per slide, one visual per idea. Use white space aggressively, limit text to headlines and short bullet points, and let charts do the heavy lifting. If a slide requires more than 30 seconds to parse, it belongs in the appendix.
Colour should carry meaning, not decoration. Reserve green, amber, and red for RAG status indicators and use a neutral palette everywhere else. Consistent fonts, aligned elements, and minimal animation signal professionalism - executives notice sloppy formatting even if they don't mention it. I once watched a VP dismiss a team's entire Q3 strategy because the bar chart colours clashed with the company brand guidelines. Petty? Sure. But it happens.
How to Run the Meeting
Stop calling it a presentation. The best QBRs are working sessions where the deck is a pre-read and the meeting is for debate, decisions, and alignment.
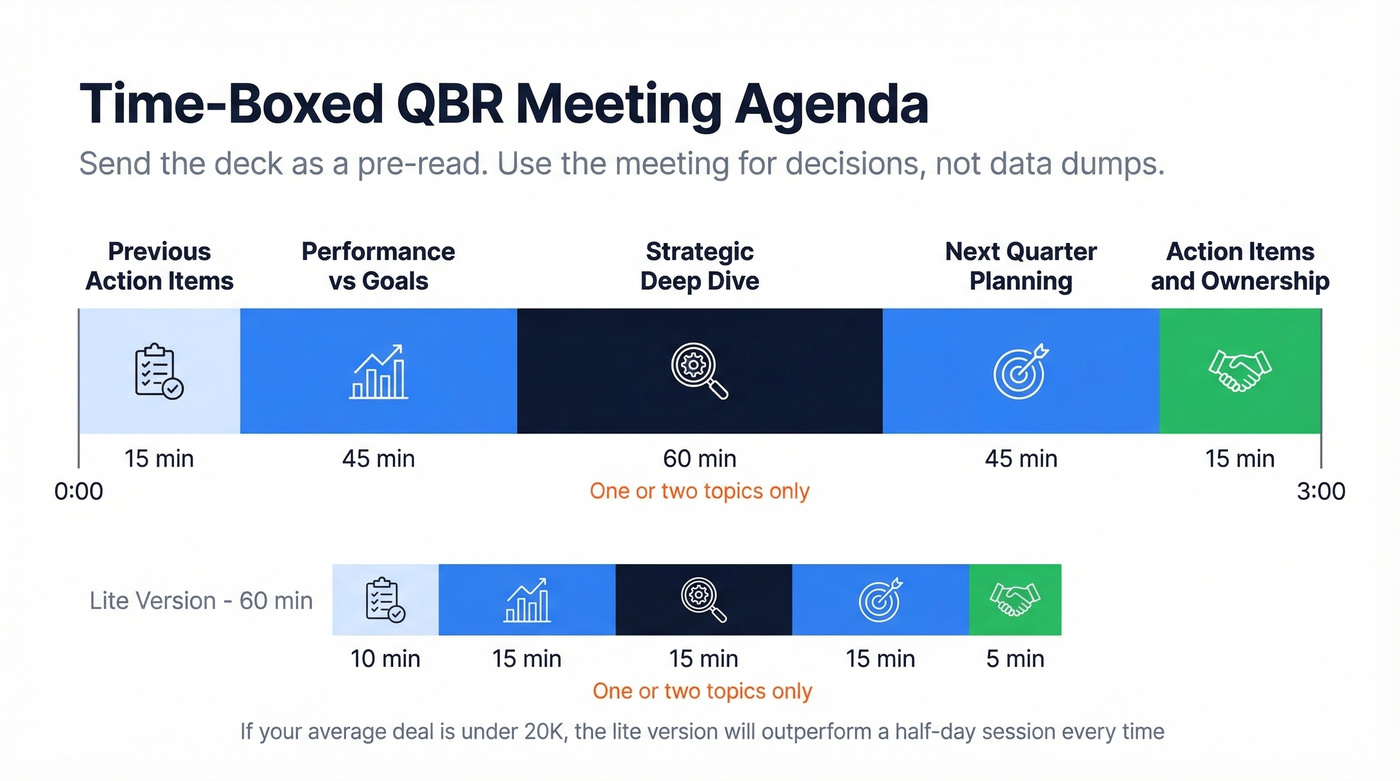
Send the full deck 1-2 days before the meeting. Execs who care will read it. Execs who don't will at least skim the executive summary. In our experience, the pre-read model eliminates at least 15 minutes of narration and cuts decision-making time by nearly 40%. Gong publishes three agenda formats - generic, SaaS/EBR, and project-based - worth adapting to your context (especially if you're running a remote sales meeting).
Time-box the meeting itself:
| Block | Duration | Focus |
|---|---|---|
| Previous action items | 15 min | What got done, what didn't |
| Performance vs goals | 45 min | Scorecard discussion |
| Strategic deep dive | 60 min | One or two topics only |
| Next-quarter planning | 45 min | Priorities, owners, metrics |
| Action items & ownership | 15 min | Decisions, deadlines, who |
That's a three-hour session for a full strategic QBR. For lighter quarterly check-ins, compress the deep dive and planning blocks to 30 minutes each.
Let's be honest: if your average deal size is under £20K, you probably don't need a three-hour QBR. A 60-minute check-in with a tight 8-slide deck will outperform a bloated half-day session every time. The goal is decisions, not theater.
Build Your Deck Faster in 2026
Teams spend 20+ collective hours per QBR cycle. Most of that time goes to gathering data, reconciling numbers, and formatting slides - not thinking strategically. That's backwards.
For templates, SlidesCarnival offers 25 layouts free with attribution, Slidesgo has a 23-slide template for PowerPoint and Google Slides, and Beautiful.ai's Smart Slides auto-align and resize content as you edit. AI tools like ChatSlide or PowerPoint Copilot can generate a first-draft outline from your data in minutes. Use them for structure, then add your actual thinking.
But the fastest way to cut QBR prep isn't a better template - it's cleaner data. If you're spending hours reconciling CRM contacts before you can even pull metrics, run an enrichment pass first. When you pull adoption or outreach metrics for your scorecard, they need to reflect real people at real companies - not bounced emails and departed employees. That upstream data quality is what cuts busywork and gives you numbers worth presenting (see our guide to lead enrichment).
86% of buyers engage more when they feel understood - but that's impossible when your contact data is months out of date. Prospeo's 83% enrichment match rate and 7-day refresh cycle mean your adoption metrics, churn analysis, and expansion pipeline reflect real people at real companies.
Kill stale data before your next QBR. 75 free lookups to start.
FAQ
How long should a QBR presentation be?
Aim for 15-25 slides covering 8 core narrative sections. If your content deck exceeds 20 slides excluding appendix, move the excess into a pre-read document. The appendix can be as long as needed - it's backup, not narrative.
How often should you hold QBRs?
Quarterly is the default, but adjust by account maturity. Monthly during onboarding, quarterly for active accounts, semi-annually for stable long-term customers. B2B customers with strong executive participation are 2.5x more likely to renew, so cadence should match how fast the relationship is evolving.
What's the difference between a QBR and an EBR?
QBR refers to the quarterly cadence; EBR (executive business review) refers to the audience level - typically C-suite or VP+. The format and structure are nearly identical. The audience determines the altitude of the conversation.
How do you make sure QBR data is accurate?
Run a CRM enrichment pass before pulling metrics. Stale contacts inflate churn numbers and deflate adoption stats. Refreshing records on a regular cycle - weekly if you can manage it - means your scorecard reflects current reality, not contacts who changed roles months ago.