Revenue Funnel: The 2026 Guide With Real Benchmarks
It's Monday morning pipeline review. Marketing reports 500 MQLs. Sales accepted 80 SQLs. Finance wants to know why revenue is flat when "leads are up." Everyone's looking at different dashboards, measuring different things, and blaming a different team.
This isn't a people problem - it's a revenue funnel problem. And when up to 70% of B2B reps missed quota last year, most organizations clearly haven't solved it.
The Short Version
A revenue funnel tracks the full customer lifecycle from first touch through expansion and advocacy - not just acquisition. Three things matter most:
- The MQL-to-SQL handoff is where most funnels break, with conversion running as low as 15-21% in many B2B SaaS motions.
- Pipeline velocity is the single most useful metric in RevOps.
- Your funnel is only as good as the data feeding it. Bad contact data means every conversion rate you calculate is fiction.
What Is a Revenue Funnel?
It's an end-to-end framework that maps the entire customer lifecycle - from first touch through expansion and advocacy - with revenue attribution at every stage. Think of it as the connective tissue between marketing, sales, and customer success, giving each team a shared view of how revenue actually gets generated.
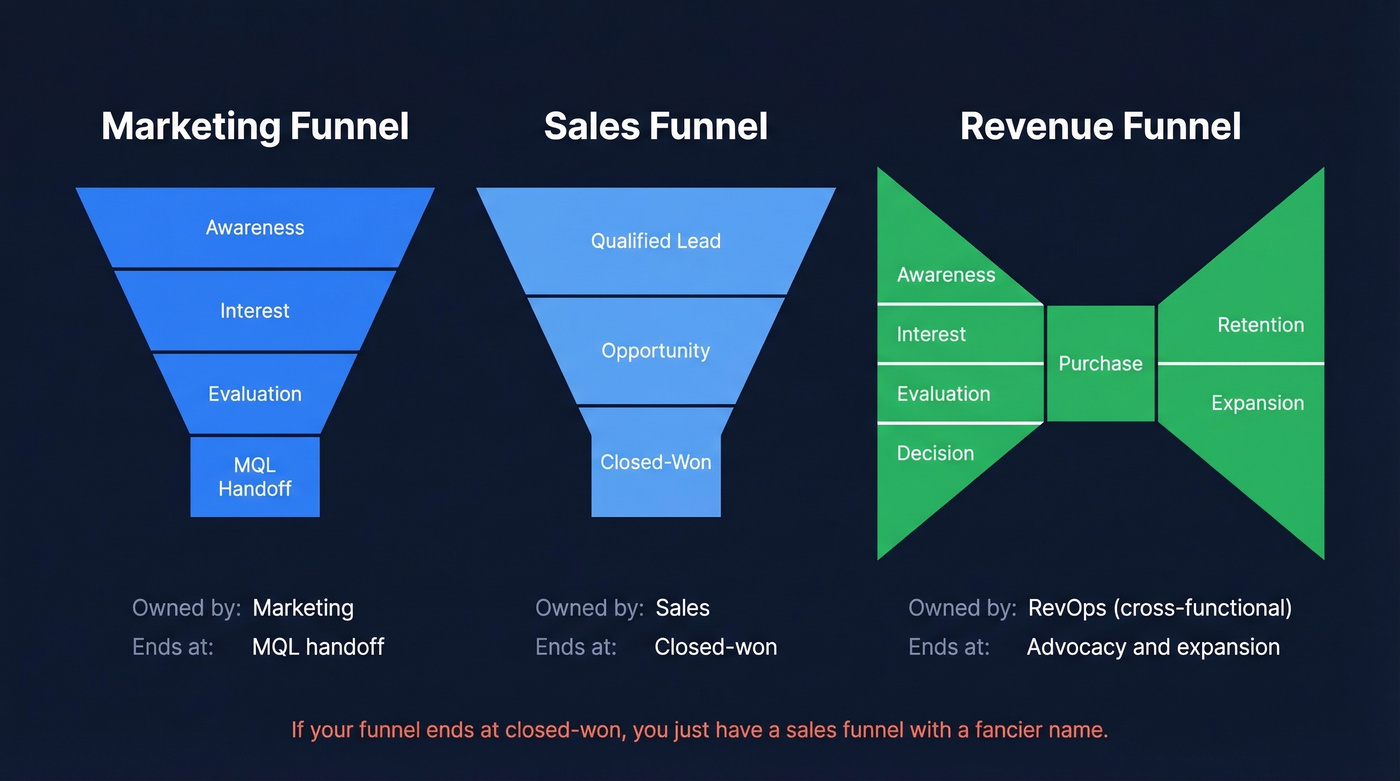
Here's the thing: if your funnel ends at closed-won, you've just got a sales funnel with a fancier name. The entire value of this model is that post-sale revenue - renewals, upsells, referrals - gets equal weight to acquisition. That's what separates it from every other funnel you've seen in a slide deck.
Revenue Funnel vs. Sales Funnel vs. Marketing Funnel
Pipeline reviews get derailed when these three terms blur together. Here's the actual distinction:
| Marketing Funnel | Sales Funnel | Revenue Funnel | |
|---|---|---|---|
| Scope | Awareness to lead gen | Qualification to close | First touch to expansion |
| Ownership | Marketing | Sales | Cross-functional (RevOps) |
| Starts At | Unknown visitor | Qualified lead | Anonymous awareness |
| Ends At | MQL handoff | Closed-won | Advocacy / expansion |
| Key Metrics | CPA, engagement, lead quality | Win rate, deal size, velocity | Pipeline velocity, NRR, LTV:CAC |
The marketing funnel maps audience mindset, messaging, and channels across TOFU, MOFU, and BOFU stages in B2B content marketing. The sales funnel picks up after a hand-raise and focuses on forecasting revenue and progressing deals. The revenue funnel encompasses both and extends past them.
One more distinction worth nailing down: a pipeline shows active deals being worked. A funnel diagnoses where leads drop off. The full-lifecycle revenue funnel does both, across every stage from awareness to advocacy.
Revenue Funnel Stages
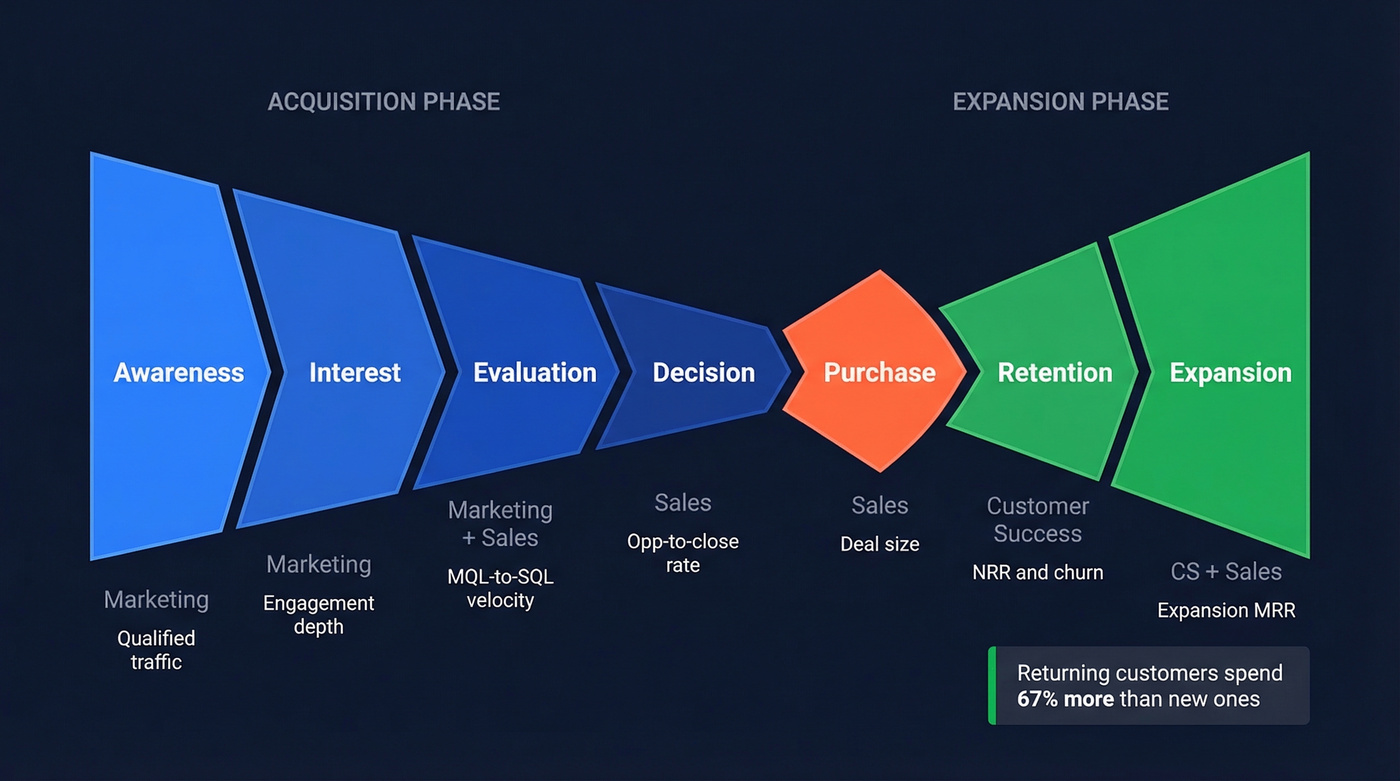
The model maps to seven stages grouped into three phases. The Bowtie model from Winning by Design is the structural inspiration - acquisition on the left, expansion on the right, with the purchase as the pivot point.
| Stage | Phase | Owner | Example Tactics | Key Metric |
|---|---|---|---|---|
| Awareness | Acquisition | Marketing | SEO, PR, social, events | Qualified traffic |
| Interest | Acquisition | Marketing | Blogs, videos, podcasts | Engagement depth |
| Evaluation | Acquisition | Mktg + Sales | Case studies, webinars | MQL-to-SQL velocity |
| Decision | Acquisition | Sales | Demos, trials, proposals | Opp-to-close rate |
| Purchase | Pivot | Sales | Contract, onboarding handoff | Deal size, cycle length |
| Retention | Expansion | Customer Success | Onboarding, QBRs, NPS | NRR, churn rate |
| Expansion | Expansion | CS + Sales | Upsell, cross-sell, referrals | Expansion MRR |
The first four stages look like a traditional sales funnel. The last three are where the full-lifecycle model earns its name - and where the real compounding happens. Returning customers spend 67% more than new ones, which means your expansion stages often generate more revenue per dollar invested than acquisition ever will.
2026 Benchmarks by Stage
This is the section you'll bookmark.
Stage-by-Stage Conversion Rates
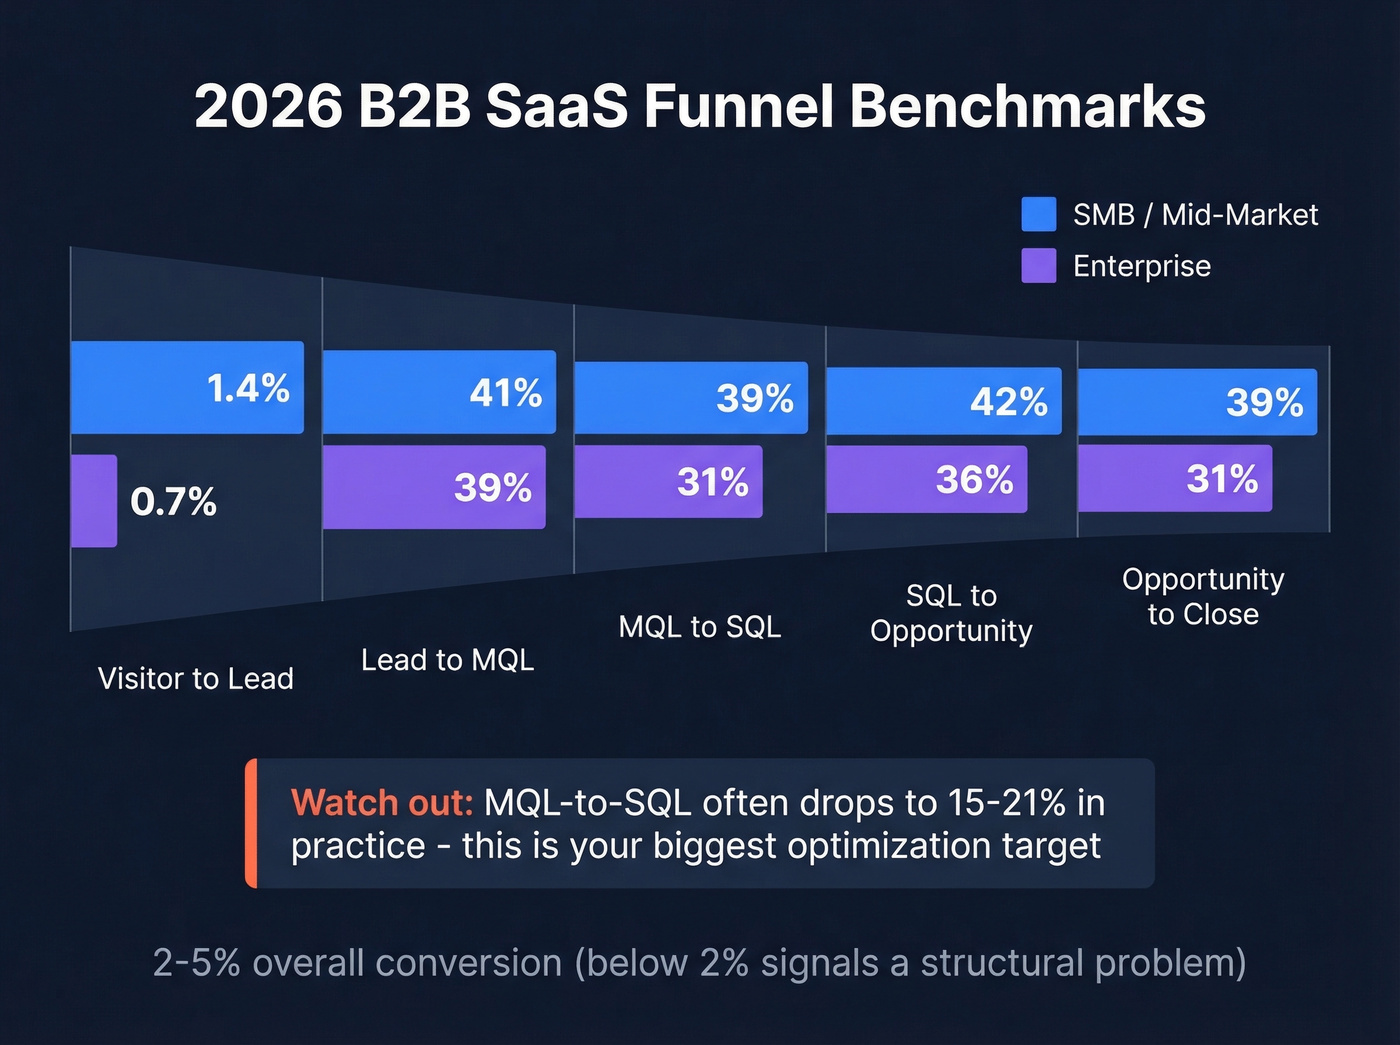
Data compiled from 40+ benchmark studies across B2B SaaS:
| Stage Transition | SMB / Mid-Market | Enterprise |
|---|---|---|
| Visitor to Lead | 1.4% | 0.7% |
| Lead to MQL | 41% | 39% |
| MQL to SQL | 39% | 31% |
| SQL to Opportunity | 42% | 36% |
| Opportunity to Close | 39% | 31% |
A note on MQL-to-SQL: the table shows broad averages across segments. In many B2B SaaS motions, this is the steepest drop - benchmarks run as low as 15-21%. That's your biggest optimization target regardless of segment.
Channel Benchmarks
Source matters enormously for funnel math:
| Channel | Visitor to Lead | MQL to SQL | Opp to Close |
|---|---|---|---|
| SEO | 2.1% | 51% | 38% |
| PPC | 0.7% | 26% | 35% |
| Events | 1.0% | 24% | 40% |
SEO leads convert to SQL at nearly double the rate of PPC leads. Events have the highest close rate but the lowest top-of-funnel volume. These tradeoffs should drive your budget allocation, not gut feel.
Pipeline Velocity
Pipeline velocity is the single most useful metric in RevOps. It combines four variables into one number that tells you how fast you're generating revenue:
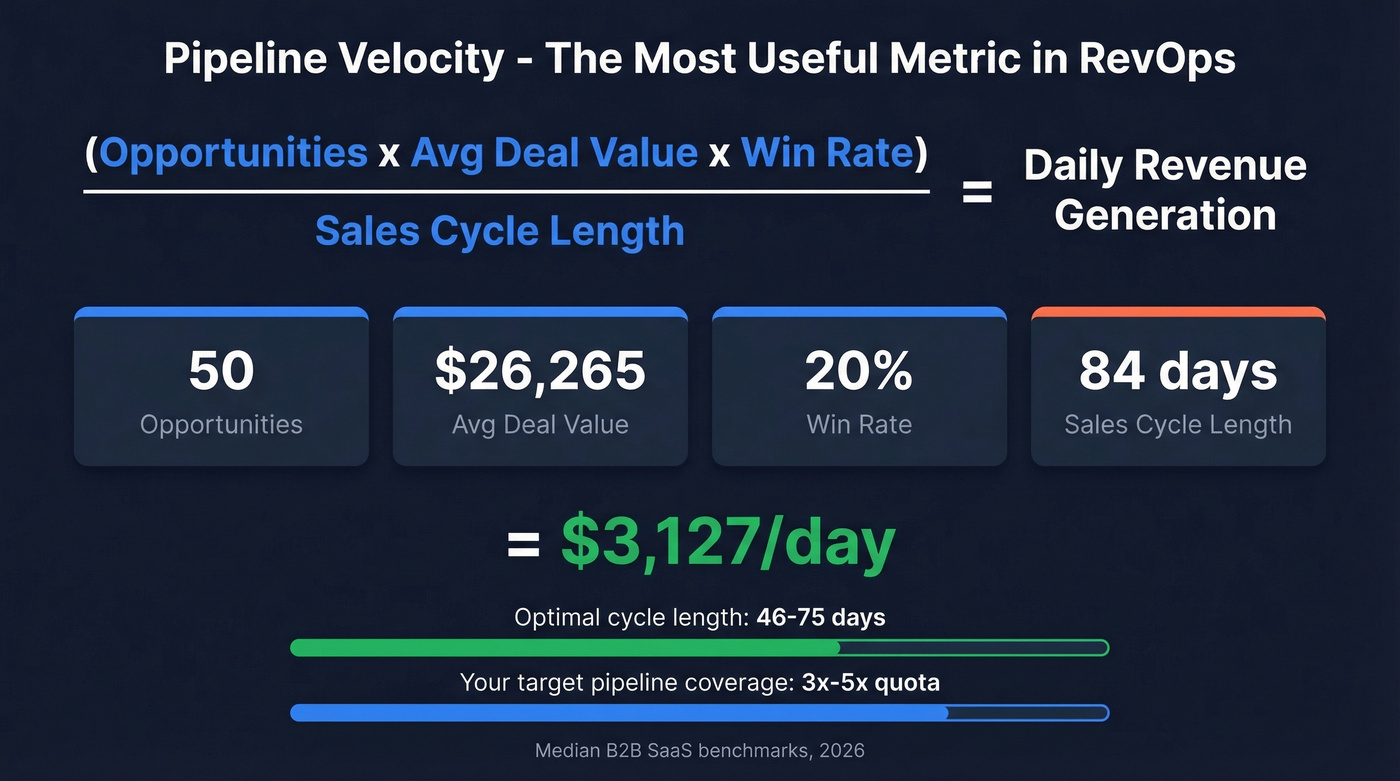
(Opportunities x Avg Deal Value x Win Rate) / Sales Cycle Length
With median B2B SaaS numbers: 50 opportunities x $26,265 deal size x 20% win rate / 84-day cycle = $3,127/day. The optimal sales cycle sits between 46-75 days - if yours is longer, that denominator is dragging everything down.
Most RevOps teams also target 3x-5x pipeline coverage against quota. Carrying less than 3x coverage means you're relying on an unrealistic win rate to hit your number.
Overall lead-to-customer conversion across B2B SaaS runs 2-5%. Below 2% signals a structural problem. Above 5% means you're either in a great market or not generating enough top-of-funnel volume.
Every conversion rate in your revenue funnel is fiction if the contact data underneath is wrong. Prospeo delivers 98% verified email accuracy with a 7-day refresh cycle - so your MQL-to-SQL handoff reflects real buyer engagement, not bounced emails and dead leads.
Stop diagnosing funnel leaks caused by bad data.
Frameworks Worth Knowing
Four models dominate the RevOps conversation. You don't need all of them.
Start here - Bowtie (Winning by Design). This treats the customer lifecycle as a bowtie shape: acquisition narrows to purchase, then expands through retention and growth. It's the most complete model because post-sale gets equal weight. If you only adopt one framework, make it this one.
HubSpot Flywheel replaces the linear funnel with a continuous cycle where happy customers generate momentum. Philosophically sound, but harder to measure stage-by-stage - better as a mental model than an operational one.
Running a 200+ person org? The SiriusDecisions Revenue Operations Model was built for you. It's heavy on governance, handoffs, and cross-functional SLAs. Overkill for a 30-person startup, indispensable for enterprise alignment.
TOPO Framework is the most operationally prescriptive - pure execution, measurement, and optimization. Less philosophy, more playbook. Think of it as the "just tell me what to do" option.
Who Owns the Revenue Funnel?
Nobody. And everybody. That's the problem.
RevOps exists to be the connective tissue. Sales Ops handles CRM governance, pipeline hygiene, and forecasting with sales operations metrics. Marketing Ops owns lead routing, attribution, and campaign measurement. CS Ops manages onboarding, NRR, and expansion playbooks. The challenge is that 65% of marketing and sales professionals struggle with leadership misalignment, and only 30% of companies have a unified data strategy. That's why the CRO role is the fastest-growing title in the space - someone has to own the full picture.
We've seen this pattern repeatedly: companies build a lifecycle funnel in a slide deck, but nobody has the authority or the data infrastructure to enforce it across teams. Without a RevOps function - or at minimum a CRO with cross-functional authority - the model stays theoretical.
Let's be honest: most companies don't need a more sophisticated funnel. They need one person with the authority to enforce the funnel they already have. The framework isn't the bottleneck. The org chart is.
How to Build a Revenue Funnel
Five steps. None of them are optional.
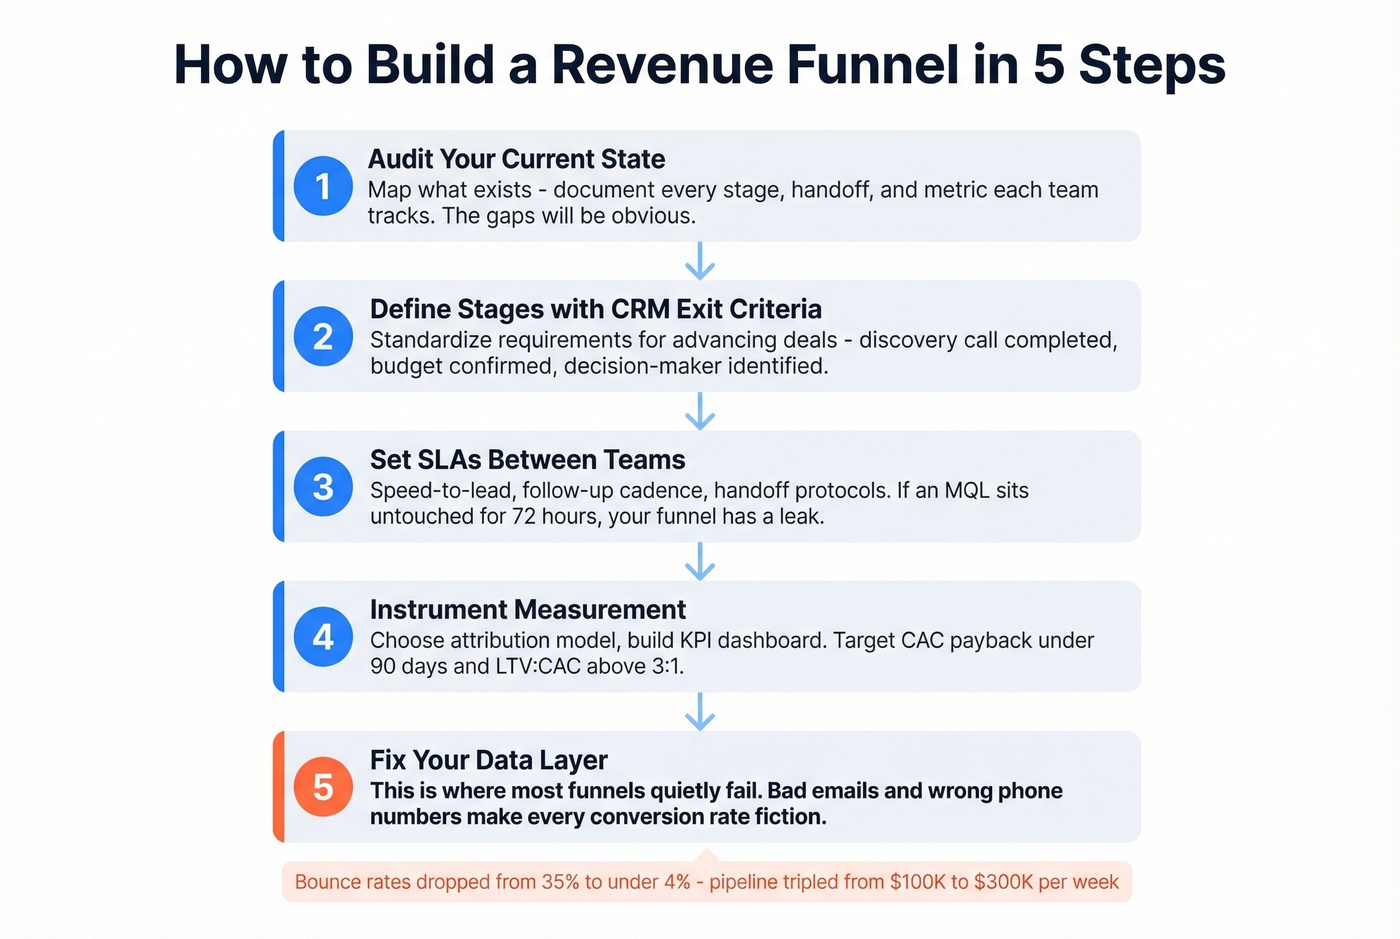
Step 1: Audit your current state. Map what exists. Most companies already have a marketing funnel and a sales pipeline - they just aren't connected. Document every stage, handoff, and metric each team tracks. The gaps will be obvious.
Step 2: Define stages with CRM exit criteria. Reps shouldn't advance a deal without meeting specific requirements - discovery call completed, budget confirmed, decision-maker identified. Standardize these in your CRM and enforce them using clear lead status definitions.
Step 3: Set SLAs between teams. Speed-to-lead, follow-up cadence, handoff protocols. If marketing generates an MQL and sales doesn't touch it for 72 hours, your funnel has a leak that no amount of optimization will fix. (If you need copy, steal these sales follow-up templates.)
Step 4: Instrument measurement. Choose an attribution model, build a KPI dashboard, and map metrics to stages. TOFU gets qualified traffic and engagement depth. MOFU gets MQL-to-SQL velocity. BOFU gets trial-to-paid conversion and cycle length. Post-sale gets NRR and churn. Target CAC payback under 90 days and LTV:CAC above 3:1.
Step 5: Fix your data layer. This is where most funnels quietly fail. You've built the perfect stage model, set SLAs, and instrumented every metric - but 35% of your emails bounce and your phone numbers connect 10% of the time. Every conversion rate you calculate is wrong. Every forecast is fiction. Tools like Prospeo, with 98% email accuracy and a 7-day data refresh cycle, exist specifically to solve this problem at the foundation level. One customer saw their pipeline triple from $100K to $300K/week after switching, with bounce rates dropping from 35% to under 4%. (If you’re evaluating vendors, start with these data enrichment services and email deliverability basics.)

Pipeline velocity depends on reaching real decision-makers fast. Prospeo gives you 300M+ verified profiles with 30+ filters - buyer intent, technographics, headcount growth - so every opportunity in your formula is a real one. Teams book 26% more meetings compared to ZoomInfo.
Accelerate your pipeline velocity with data that actually connects.
Five Mistakes That Kill Funnels
1. Vanity metrics. Tracking MQL volume without diagnosing why deals stall is like celebrating website traffic while revenue flatlines. A Reddit thread auditing 100+ sales funnels found this was the single most common failure pattern.
2. Committee copy. Messaging gets watered down by stakeholders until it converts nobody. Every team adds their "must-have" bullet point, and the result is a landing page that speaks to everyone and persuades no one.
3. Optimizing the wrong stage. Teams over-invest in BOFU - better demos, sharper proposals - when the real leak is at TOFU. They're not generating enough qualified interest in the first place. Always find the biggest leak before you start patching. (If you need a stage model, the AIDA Sales Funnel is a clean starting point.)
4. Data fragmentation. 60% of consumers take 6+ actions before buying from a new brand, but teams optimize in silos. Marketing looks at ad metrics, sales looks at CRM data, and nobody connects the dots. If you're not verifying contact data before it enters your CRM, every conversion rate downstream is wrong - especially when your email bounce rate is creeping up.
5. Overcomplicating the funnel. Funnels should be 3-4 core steps, not 8-stage monsters with sub-stages and micro-conversions. One practitioner reported that fixing just three psychological barriers in their funnel increased conversion 4.7%, adding $28,200/month on $50K ad spend. Simplicity compounds.
How to Optimize an Existing Funnel
Stop adding stages. The companies that double revenue find the one stage that's leaking and fix it.
We've benchmarked dozens of funnels, and the pattern is always the same: map your funnel, measure each stage, identify the biggest leak, run systematic tests on that one thing. A SaaS company called TuBoost documented this approach and doubled monthly revenue from $8,140 to $16,280 with the same traffic. Their stage improvements: Visitor-to-Signup went from 11% to 16%, Signup-to-Trial from 41% to 55%, Trial-to-Paid from 18% to 25%. Small gains at each stage compound dramatically.
Only 2-3% of visitors buy on first contact, and most sales happen on the 5th-7th touchpoint. Retargeting and nurture sequences aren't optional - they're where the majority of your revenue actually converts. And since returning customers spend 67% more than new ones, your nurture investment pays dividends long after the first close. The math favors patience and persistence over funnel redesigns.
Is the Revenue Funnel Dead?
You'll hear this take at every conference. Buyers don't move linearly. Journeys are multi-touch, nonlinear, and messy.
All true. That doesn't make the funnel useless - it makes it a measurement model, not a literal journey map. The Bowtie and Flywheel models account for nonlinear behavior while still giving you stage-by-stage diagnostics. The funnel isn't a path buyers walk. It's a diagnostic tool you use to find where revenue leaks. Kill the metaphor if you want. Keep the math.
FAQ
What's the difference between a revenue funnel and a sales funnel?
A sales funnel covers qualification through close and is owned by the sales team. A revenue funnel spans the entire lifecycle - first touch through retention, expansion, and advocacy - with revenue attribution at every stage. The key difference is post-sale: renewals and upsells are core stages, not afterthoughts.
What's a good lead-to-customer conversion rate?
For B2B SaaS, 2-5% is typical. The biggest drop happens at MQL-to-SQL, where conversion can run as low as 15-21%. If your overall rate is below 2%, diagnose the MQL-to-SQL handoff first - that's almost always where the structural problem lives.
How do funnel metrics relate to sales bookings?
Sales bookings represent committed contract value at the Decision and Purchase stages. Tracking bookings alongside full-lifecycle metrics lets you see whether your funnel actually converts pipeline into recognized revenue - or just shuffles deals between stages. Target 3-5x pipeline coverage to hit bookings targets consistently.
How do you measure revenue funnel performance?
Track conversion rates between each stage, pipeline velocity (opportunities x deal size x win rate / cycle length), and unit economics like CAC payback and LTV:CAC ratio. Accurate contact data is the prerequisite - bad data at the top means bad math all the way down. Skip this step and you're building forecasts on a foundation of sand.