How to Calculate Revenue Growth: Every Formula, Benchmark, and Excel Method You Need
Your CEO asks for the revenue growth number for the board deck. Simple enough - until you remember the company acquired a competitor in Q2 and the euro weakened 8% against the dollar. Suddenly "what's our growth rate?" has about six different answers, and most of them tell a different story.
Most guides hand you one formula and call it a day. That's like teaching someone to drive by explaining the gas pedal. Pick the wrong formula and you'll put a misleading number on a slide that 12 board members will stare at for 20 minutes.
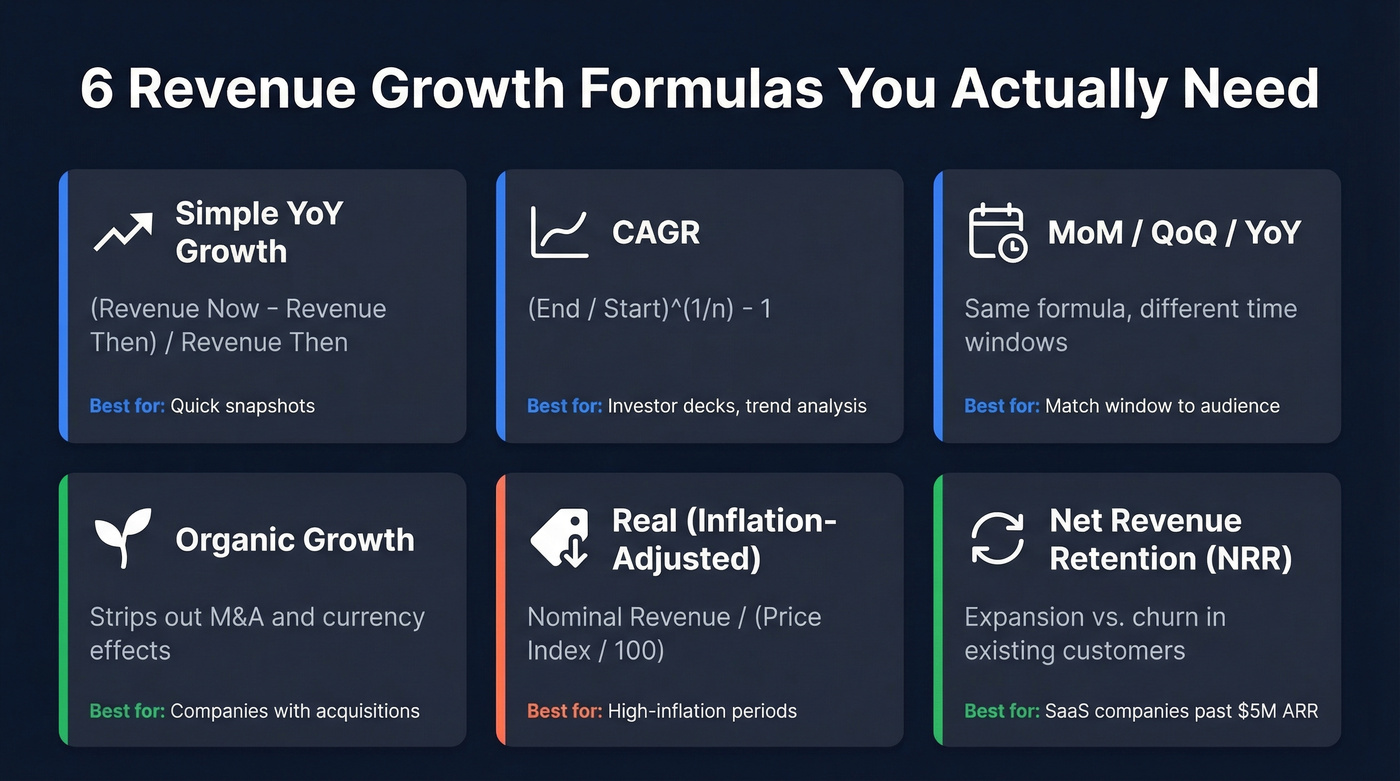
Six Revenue Growth Formulas You Actually Need
- Simple YoY Growth - the standard percentage change, period over period. Use it for quick snapshots.
- CAGR - annualized growth over multiple years. Use it for trend analysis and investor decks.
- MoM / QoQ / YoY - same formula, different time windows. Match the window to the audience.
- Organic Growth - strips out M&A and currency effects. Essential if your company has acquired anything.
- Real (Inflation-Adjusted) Growth - deflates nominal revenue by a price index. Use it in high-inflation periods or cross-country comparisons.
- Net Revenue Retention (NRR) - measures expansion vs. churn within existing customers. Non-negotiable if you're SaaS.
The formula takes 10 seconds to learn. Knowing which formula to use, what benchmarks to compare against, and how to avoid mistakes that make your analysis wrong - that's what separates a useful growth number from a misleading one.
One quick distinction before we get into it: revenue growth measures topline sales increases. It's not profit growth, it's not earnings growth, and it's not EPS growth. Reddit threads regularly conflate all four. They're different metrics answering different questions.
The Basic Revenue Growth Rate Formula
Here's the formula you'll use 80% of the time:
Revenue Growth Rate (%) = (Current Period Revenue - Previous Period Revenue) / Previous Period Revenue x 100
Amazon reported full-year revenue of $575B for 2023, up from $514B in 2022:
($575B - $514B) / $514B x 100 = 11.87% (roughly 12%)
That's the year-over-year simple growth rate. It tells you one thing: how much bigger the topline got compared to the same period last year. Nothing more.
This is the right formula when you're comparing two adjacent periods and nothing complicated happened between them - no acquisitions, no divestitures, no major currency swings. The moment any of those enter the picture, you need the advanced variants we'll cover below.
CAGR - Average Annual Sales Growth Rate
Simple growth works for one period. But what if someone asks "what's been our average annual sales growth rate over the last five years?" You can't just average five annual growth rates - that math doesn't account for compounding. You need CAGR.
CAGR = (Ending Value / Beginning Value)^(1/n) - 1
Where n is the number of years. Say your revenue went from $20M in 2021 to $48M in 2026:
CAGR = ($48M / $20M)^(1/5) - 1 = 2.4^(0.2) - 1 = 0.1916 = 19.16%
This tells you: if revenue had grown at a perfectly steady rate each year, that rate would've been 19.16%. The actual year-by-year numbers might've been lumpy - 35% one year, 8% the next - but CAGR smooths it into a single comparable figure.
When to use CAGR over simple growth: investor presentations, competitive benchmarking, any context where you're comparing growth trajectories across different time horizons. CAGR is annualized, so it's comparable across companies - just make sure you call out the time window (3-year vs. 5-year) because it changes what's being summarized.
The tradeoff is that CAGR hides volatility. A company that grew 50%, then shrank 20%, then grew 40% looks the same as one that grew steadily at ~19% per year. If volatility matters to your analysis, show both.
How Time Period Changes the Story
The same company can look like a rocket ship or a flatline depending on which time window you pick. Let's make this concrete.
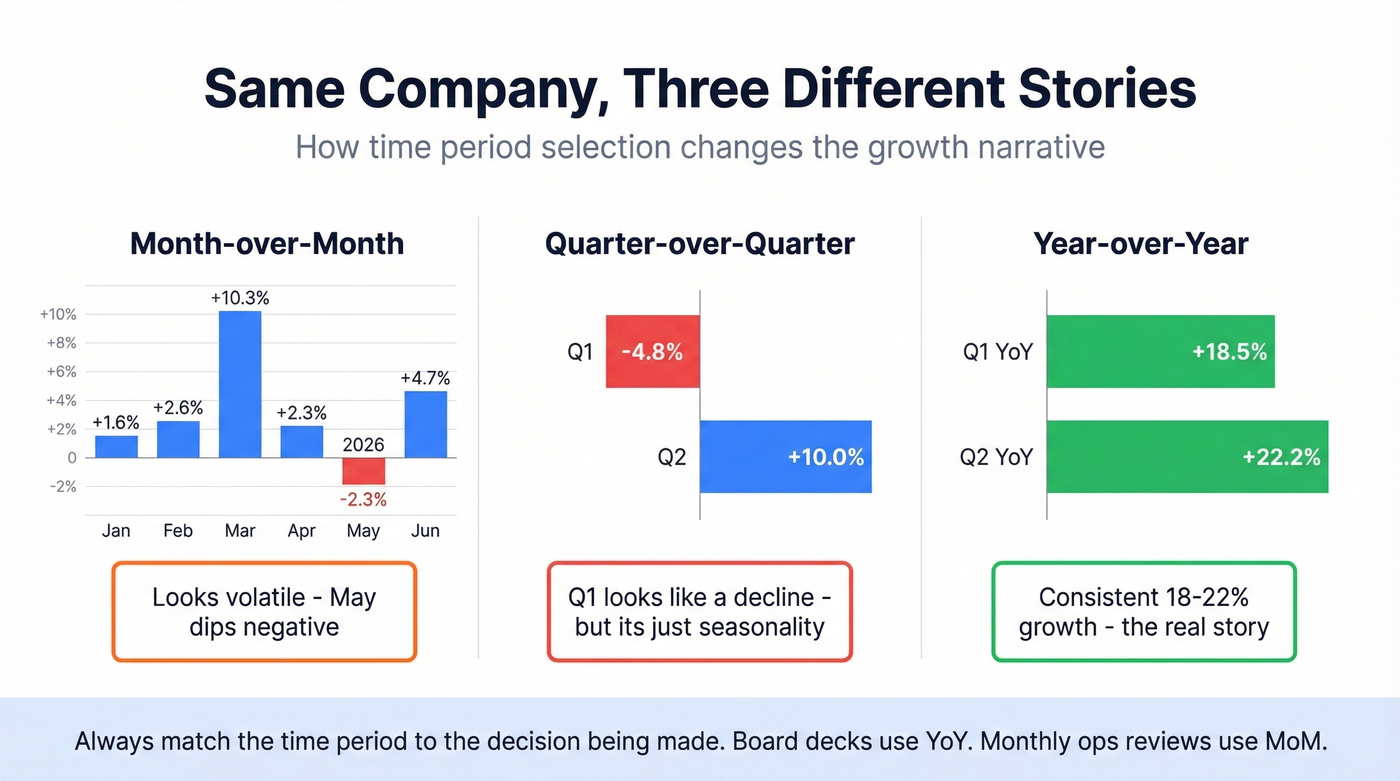
Imagine a B2B software company with this monthly and quarterly revenue:
| Month | Revenue | MoM | Quarter | QoQ | YoY |
|---|---|---|---|---|---|
| Jan 2026 | $3.8M | +1.6% | Q1 2026: $12.0M | -4.8% | +18.5% |
| Feb 2026 | $3.9M | +2.6% | |||
| Mar 2026 | $4.3M | +10.3% | |||
| Apr 2026 | $4.4M | +2.3% | Q2 2026: $13.2M | +10.0% | +22.2% |
| May 2026 | $4.3M | -2.3% | |||
| Jun 2026 | $4.5M | +4.7% |
The MoM numbers bounce around - May even dips negative. QoQ shows what looks like a decline in Q1. But YoY tells a consistent story of 18-22% growth. Same data, three different narratives.
Seasonality is the silent killer of QoQ analysis. If your business has a strong Q4, then Q1 will almost always look like a decline quarter-over-quarter. That's not a real decline - it's just the calendar. YoY comparisons eliminate this distortion because you're comparing Q1 to Q1.
A -4.8% QoQ number isn't a crisis if YoY is +18.5%. Context matters. Always present the time period that matches the decision being made. Board decks? YoY. Monthly ops reviews? MoM. Earnings calls? Both QoQ and YoY, with seasonality context.
Calculating revenue growth is step one. Accelerating it is step two. Prospeo gives your team 300M+ verified contacts with 98% email accuracy and 30+ filters - including buyer intent, funding signals, and headcount growth - so you can target the accounts most likely to move your topline.
Teams using Prospeo book 26% more meetings than ZoomInfo users.
Industry Benchmarks for 2026
Here's the thing: if you're comparing your company's growth to a generic "10-25% is good" range, you're doing it wrong. A 15% growth rate is elite for a $500M retailer and mediocre for a $5M SaaS company. Benchmarks without industry and stage context are useless.
Public Company Benchmarks
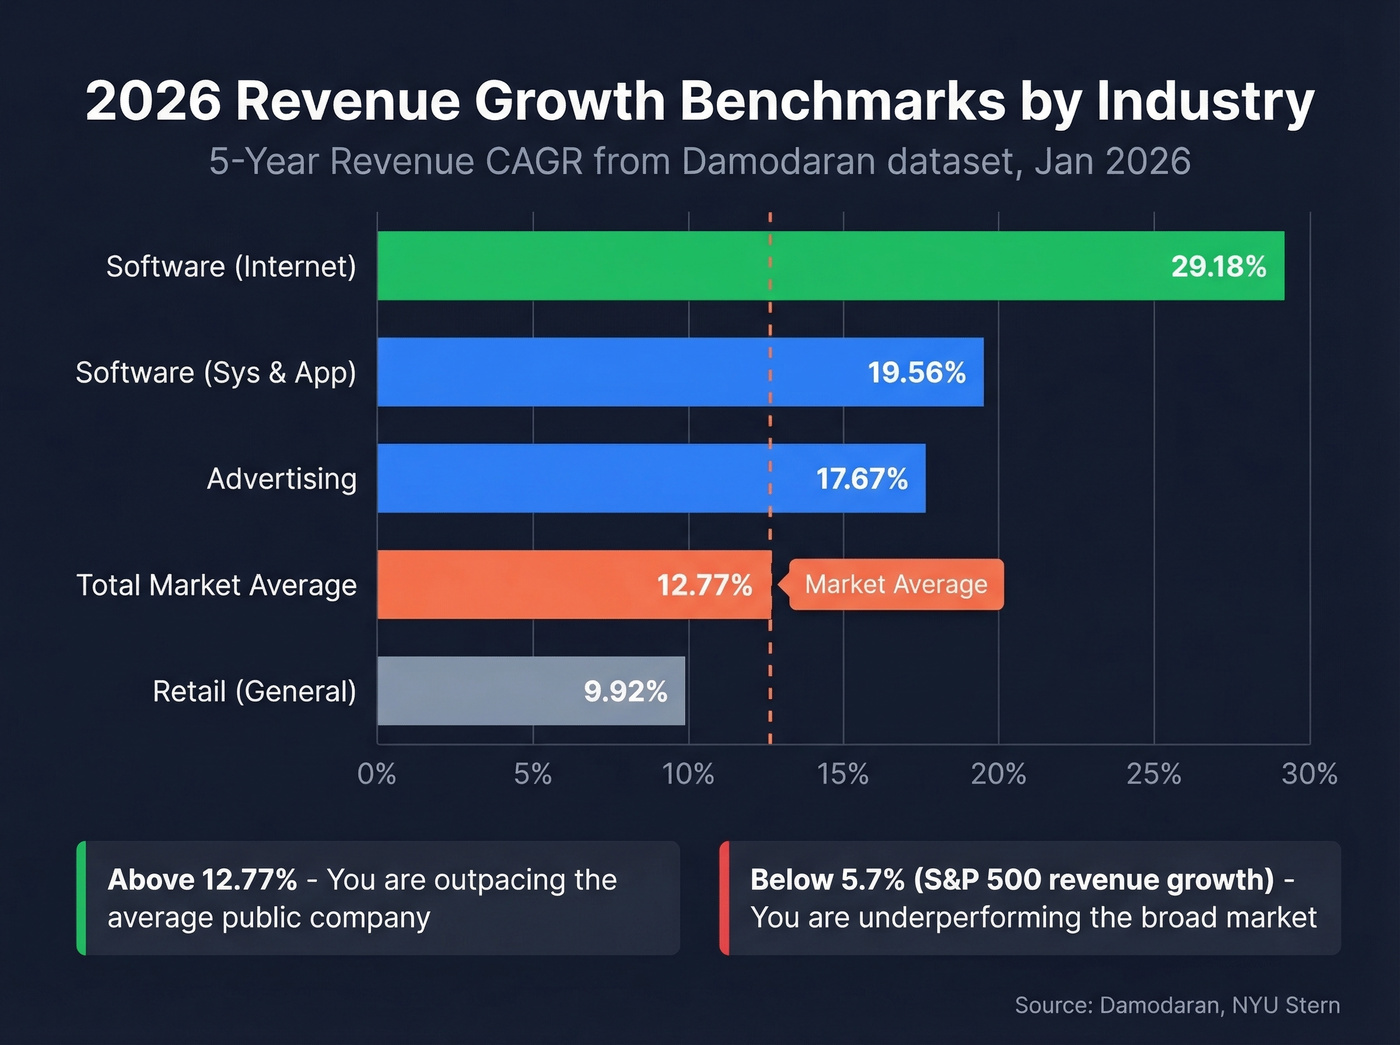
Aswath Damodaran's dataset at NYU Stern, updated January 2026, provides 5-year revenue CAGRs across thousands of public companies:
| Industry | 5-Year Revenue CAGR | # of Firms |
|---|---|---|
| Total Market | 12.77% | 5,994 |
| Software (Internet) | 29.18% | 29 |
| Software (Sys & App) | 19.56% | 309 |
| Advertising | 17.67% | 52 |
| Retail (General) | 9.92% | 23 |
That 12.77% total market figure is the number to anchor against. If you're growing faster, you're outpacing the average public company. If you're in internet software and growing below 29%, you're lagging your peer set.
SaaS Revenue Growth Benchmarks
Public company data doesn't capture the private SaaS world well. For that, SaaS Capital's annual survey of 1,000+ private SaaS companies is the best source we've found.
In their 2025 survey, bootstrapped B2B SaaS companies with $3M-$20M ARR reported a median growth rate of 20% and a 90th percentile of 51%. That's a meaningful deceleration from the prior year, when median was 30% and the 90th percentile hit 75%. The post-ZIRP hangover is real - and it highlights how a slower macro environment forces companies to prioritize retention and expansion over pure new-logo acquisition.
Across all private SaaS companies with >$1M ARR, median growth runs 24%. There's also a strong exponential correlation between net revenue retention and growth - companies with NRR above 110% grow dramatically faster than those below 100%. We'll dig into NRR in the advanced section.
The S&P 500 Baseline
For a macro-level sanity check: the S&P 500's estimated YoY revenue growth for 2025 was 5.7%, with Information Technology leading at 13.1%. Ten of eleven sectors showed positive revenue growth. If your company is growing below 5.7%, you're underperforming the broad market. Full stop.
Advanced Revenue Growth Calculations
Organic vs. Inorganic Growth
Any revenue growth analysis that doesn't separate organic from inorganic is incomplete. Organic growth comes from internal initiatives - selling more to existing customers, entering new markets, launching new products. Inorganic growth comes from acquisitions.
If you're doing this for a go-to-market motion, pair it with competitive intelligence so you know why peers are accelerating (pricing, product, channel, M&A), not just that they are.
A company that "grew 40%" but acquired a $50M-revenue competitor didn't necessarily grow its core business at all. The organic growth formula strips this out:
Organic Growth (%) = (Current CC Revenue ex-M&A - Prior CC Revenue ex-M&A) / Prior CC Revenue ex-M&A x 100
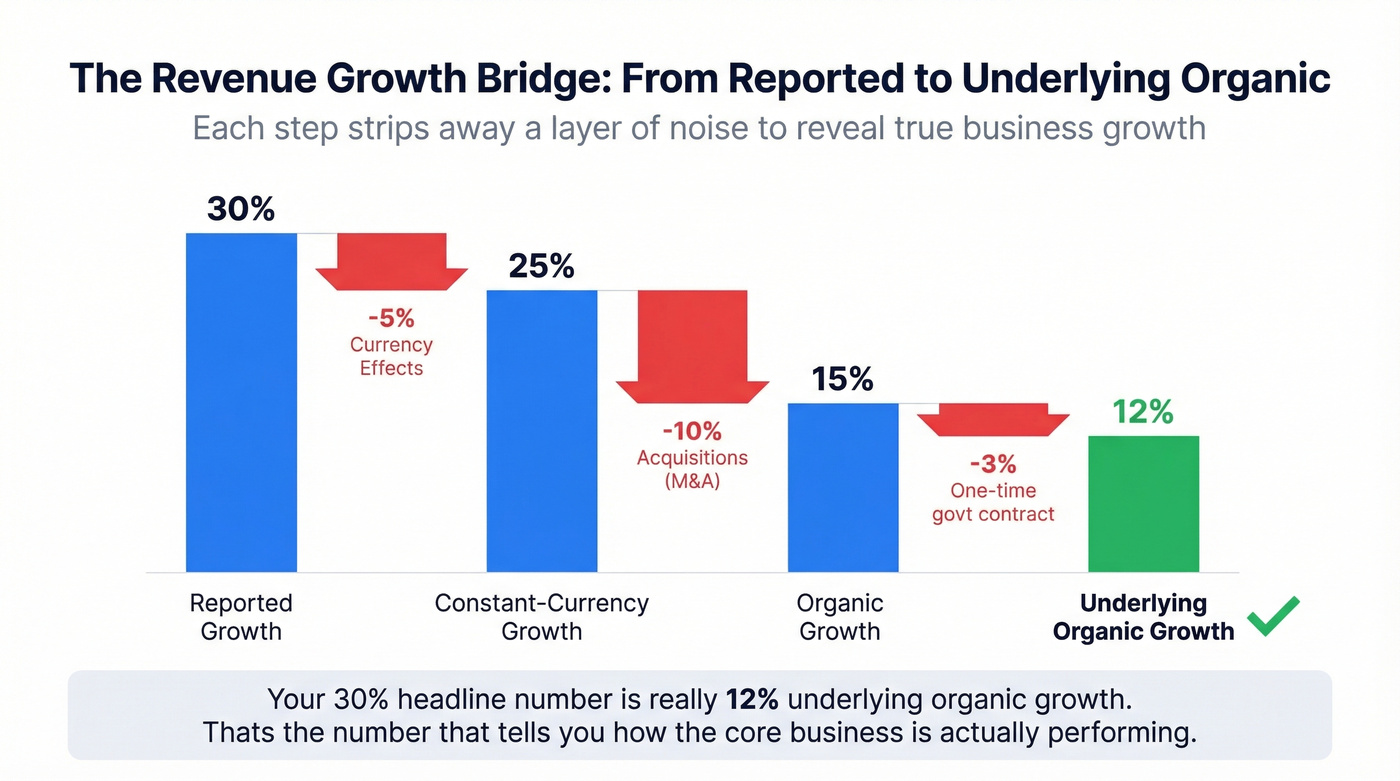
"CC" means constant currency - you're also removing foreign exchange effects. Best practice is to report a bridge that walks from reported growth down to underlying organic growth: Reported Growth -> Constant-Currency Growth -> Organic Growth -> Underlying Organic Growth (excluding one-offs). So your 30% reported growth might be 25% at constant currency, 15% organic, and 12% underlying organic after stripping a one-time government contract. Each step removes a layer of noise.
Real vs. Nominal Growth
In a 2-3% inflation environment, the difference between real and nominal growth is small. When inflation runs 6-8%, it's the difference between "growing" and "actually growing." The deflation method is straightforward:
Real Revenue = Nominal Revenue / (Price Index / 100)
Common price indexes include CPI for consumer-facing businesses, PPI for manufacturing and wholesale, PCE for broader consumer spending, and the GDP deflator for economy-wide analysis. Pick the one that matches your revenue mix. This matters most for cross-country comparisons and any analysis spanning high-inflation periods.
Price-Volume-Mix Decomposition
Once you know your organic growth rate, the next question is where did it come from? Price-Volume-Mix decomposition answers this:
Volume Effect = (Units_current - Units_prior) x ASP_prior
Price Effect  = (ASP_current - ASP_prior) x Units_prior
Mix Effect    = Total Organic CC Change - Volume Effect - Price Effect
This is the analysis that separates a CFO who understands the business from one who just reads the P&L. Growing 15% because you raised prices 15% on a flat customer base is a very different story from growing 15% because you added 20% more customers at slightly lower ASPs. PVM tells you which levers are actually working.
Net Revenue Retention for SaaS
If you run a SaaS business, topline revenue growth alone misses half the story. NRR measures how much revenue you retain and expand from your existing customer base, including upsells, cross-sells, and price increases. If you want the mechanics behind expansion revenue, see upsell vs. cross-sell:
NRR = (MRR from Dec 2024 customers still active in Dec 2025, including all expansion) / (Total MRR in Dec 2024) x 100
NRR above 100% means expansion revenue exceeds churn - your existing customers are growing faster than you're losing them. Gross Revenue Retention (GRR) is the same calculation but excludes upsells and price increases, so it can never exceed 100%.
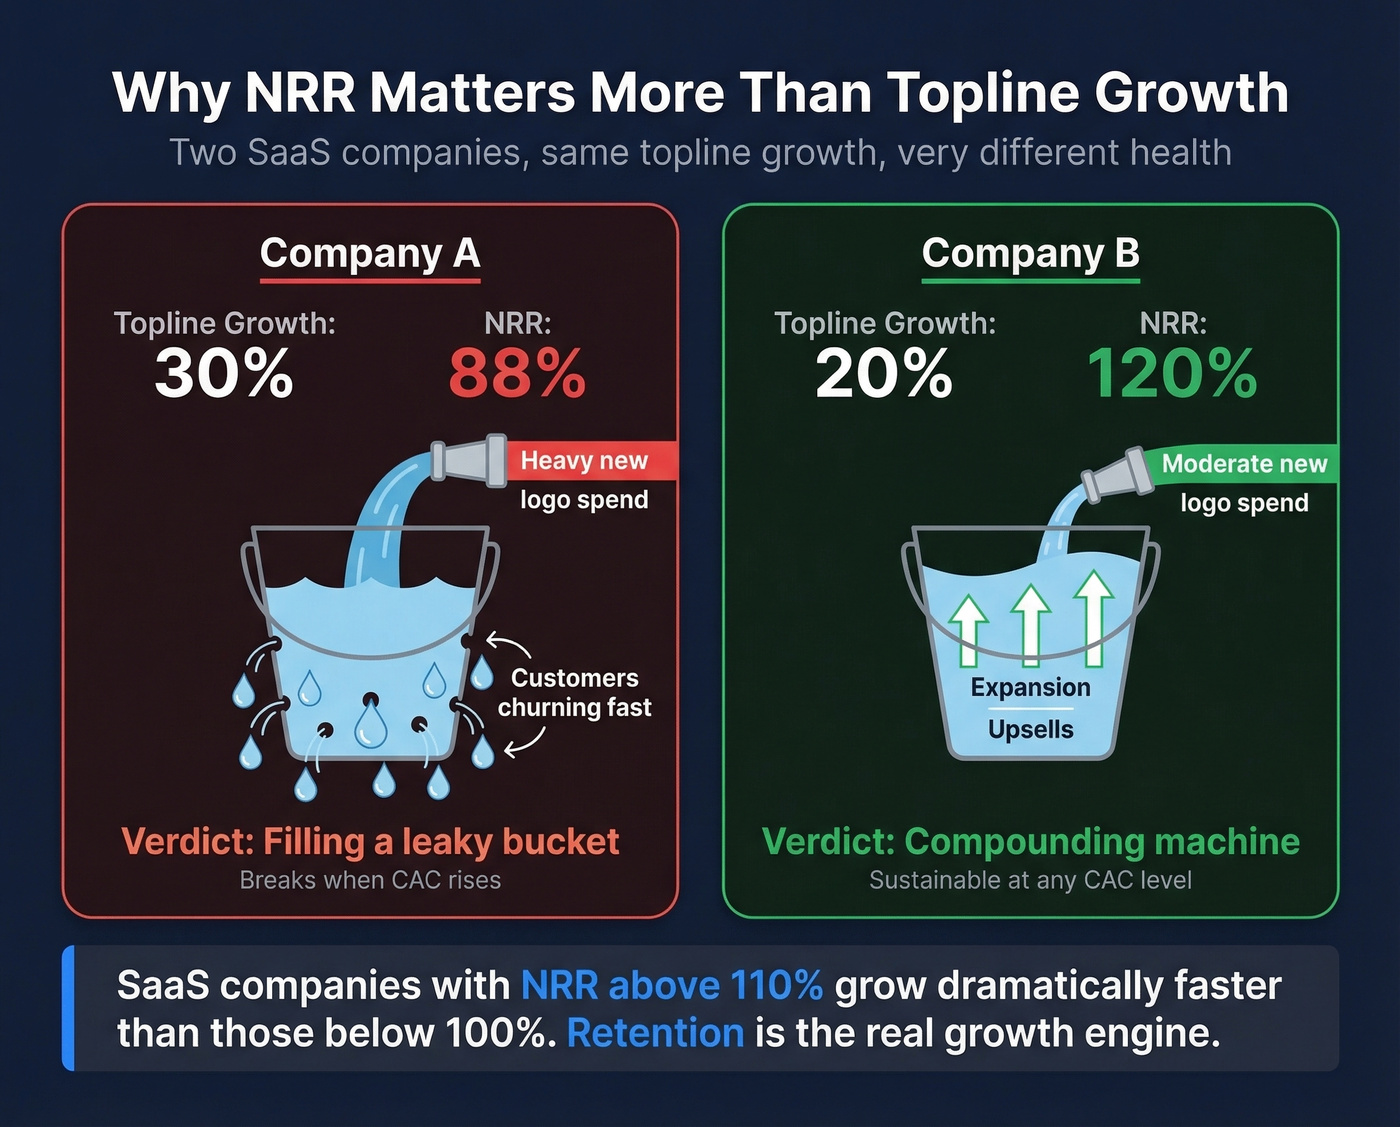
Let's be honest: NRR is more important than topline growth for SaaS companies past $5M ARR. We've seen SaaS companies with 30%+ topline growth but NRR below 90%. They're filling a leaky bucket with new logos. It works until customer acquisition costs rise - then the whole model breaks. A company growing 20% with 120% NRR is in a fundamentally stronger position than one growing 35% with 85% NRR.
If you want to connect this to unit economics, track CAC alongside NRR so you can see whether growth is getting more expensive over time.
Building a Growth Model in Excel
Basic Formulas
For simple period-over-period growth with revenue in cells B1 (prior) and B2 (current):
=(B2-B1)/B1
Format the cell as percentage. Done.
For CAGR with Year 1 revenue in B1 and Year 5 revenue in B6:
=(B6/B1)^(1/5)-1
Excel also has a lesser-known RRI function that does the same thing: =RRI(5, B1, B6). Same result, slightly cleaner.
For projecting future revenue based on historical trends, the GROWTH function is underrated. Feed it 5 years of revenue data and it returns an exponential trend projection. It's not a forecast - it's a trendline extrapolation - but it's useful for quick sanity checks on growth assumptions. Pairing GROWTH with your model lets you stress-test assumptions across bull, base, and bear scenarios before presenting to the board.
If you're turning this into a real operating cadence, align the model with your sales forecasting process so assumptions and pipeline reality don't drift.
Handling Messy Data
Real-world revenue data is rarely clean. We've dealt with spreadsheets where not all companies have data for all years, categories are mixed within rows, and years are sorted as columns instead of rows. The r/excel community flags this constantly.
Don't try to brute-force it with cell references. Use a PivotTable or Power Query to reshape the data first, then calculate growth rates on the clean output. If you're stuck in a formula-only environment, INDEX/MATCH keyed on company name and year handles ragged time series better than hardcoded cell references:
=IFERROR((INDEX(Revenue,MATCH(A2&Year,Key,0))-INDEX(Revenue,MATCH(A2&(Year-1),Key,0)))/INDEX(Revenue,MATCH(A2&(Year-1),Key,0)),"N/A")
The Formatting Trap
This one catches people more than it should. If your cell is already formatted as a percentage, do NOT multiply by 100 in your formula. The formula =(B2-B1)/B1 in a %-formatted cell displays correctly. Adding *100 turns your 17.86% into 1,786%. Even published guides contain this exact error - the page shows a formula with *100 and then contradicts its own worked example. Always sanity-check your output.
Common Mistakes That Skew Results
Six errors we see most often, roughly in order of how much damage they cause:
Confusing revenue growth with earnings growth. Revenue is the topline. Earnings are after expenses. A company can grow revenue 25% and shrink earnings. These are different metrics answering different questions.
The percent formatting double-multiplication. If the cell is formatted as %, don't multiply by 100. This is the single most common spreadsheet error in growth calculations.
Ignoring seasonality in QoQ comparisons. Q1 will almost always look bad compared to Q4 in B2B. Compare same-quarter YoY instead.
Not adjusting for acquisitions or currency. A 30% growth rate that includes a $20M acquisition and a 5% currency tailwind is 12% organic growth. The board needs to know the difference.
Drawing conclusions from tiny base periods. Going from $100K to $200K in revenue is 100% growth. It's also just $100K. Percentage growth from small bases is mathematically dramatic but operationally meaningless.
Basic arithmetic errors on published sites. Paddle's revenue growth guide includes an example where revenue doubling from $1M to $2M is labeled "2% growth." It's 100%. Even reputable sites get this wrong. Always sanity-check your numbers against common sense.
Choosing the Right Calculation
Match the revenue growth calculation to the decision:
- Quick snapshot for a meeting - Simple YoY growth
- Multi-year trend for an investor deck - CAGR
- SaaS health check - Pair topline growth with NRR
- M&A-active company - Organic growth, constant currency, ex-acquisitions
- Cross-country or high-inflation analysis - Real (deflated) growth
- Understanding growth drivers - Price-Volume-Mix decomposition
The harder question isn't the formula - it's choosing and justifying the growth assumption for a forecast. Modelers on r/financialmodelling get stuck here constantly. Anchor your assumption in the benchmark data from the industry tables above, then adjust for company-specific factors like market position, product launches, and expansion plans. Tracking the right metrics over time - not just a single quarter's number - is what turns a static calculation into an actionable growth story.
If you're pressure-testing assumptions against pipeline reality, add a quick pipeline health check before you lock the growth narrative.
Skip all of this if you're just calculating a one-off growth rate for a presentation. The basic formula at the top of this article is all you need. But if you're building models, benchmarking competitors, or analyzing acquisition targets, the advanced methods are where the real insight lives.
For teams analyzing revenue trajectories to identify companies worth selling into - not just modeling their own business - Prospeo's B2B database lets you filter by revenue range, headcount growth, and funding stage across 300M+ professional profiles. The 30+ search filters and 7-day data refresh cycle mean you're prospecting into companies that are actually scaling right now, not six weeks ago.
To operationalize that targeting, use firmographic filters and a clear ideal customer profile so "high growth" translates into a repeatable list-building rule.
NRR above 110% correlates with dramatically faster growth. To get there, you need to reach the right buyers inside existing accounts - and new ones. Prospeo's intent data tracks 15,000 topics so you prospect companies actively researching what you sell, not cold leads that waste your pipeline.
Stop guessing which accounts are in-market. Start knowing.
FAQ
What is a good revenue growth rate?
The total public market averages 12.77% CAGR across nearly 6,000 firms per Damodaran's January 2026 data. Bootstrapped SaaS companies with $3M-$20M ARR target 20%+ median. Mature retailers often aim for high single digits. Anyone quoting a single "good" number without industry and stage context is guessing.
How do you calculate 3-year revenue growth?
Use CAGR: (Year 3 Revenue / Year 0 Revenue)^(1/3) - 1. This gives you the annualized rate that smooths out year-to-year volatility. In Excel: =(B4/B1)^(1/3)-1, where B1 is starting revenue and B4 is ending revenue.
What's the difference between revenue growth and CAGR?
Simple revenue growth measures one period's percentage change. CAGR measures the average annualized growth over multiple periods, assuming steady compounding. Use simple growth for single-period analysis and CAGR when comparing trajectories across different time horizons.
How do you handle negative starting revenue?
You can't calculate a meaningful percentage growth rate from a negative base - dividing by a negative number flips the sign and produces nonsensical results. Report the absolute dollar change instead, or start the growth calculation from the first positive-revenue period.