How to Calculate ROI in Sales (And What "Good" Actually Looks Like)
Your CFO just asked for the ROI on your last two sales hires. You open a spreadsheet, stare at it for ten minutes, and realize you're not sure what goes in the denominator. Salary? Benefits? The $18,000 you spent on a data tool nobody fully adopted?
Every ROI guide on the internet uses real estate flips and stock portfolios as examples - almost none show you how to calculate the return on a sales rep, a sales tool, or a quarter of outbound activity. Let's fix that.
The Quick Version
- The real formula:
(Net Profit from Sales Activity - All-In Cost) / All-In Cost x 100. The key word is all-in. If you're only dividing by ad spend, your ROI is a fantasy. - The benchmark: 3:1 to 5:1 return per salesperson, a range drawn from Outreach's methodology across 5,000+ customers. For unit economics, your LTV:CAC ratio should be at least 3:1 - anything below that and you're subsidizing activity, not funding growth.
- The #1 hidden ROI killer: Bad contact data. When 20-40% of your emails bounce, your cost denominator balloons with invisible waste - rep hours, burned domain reputation, inflated CAC.
Why Most Teams Get Sales ROI Wrong
ROI stands for return on investment. You know that. The problem is that in sales, both "return" and "investment" are slippery concepts.
The textbook formula is simple: (Gain - Cost) / Cost x 100. But "gain" in sales doesn't mean revenue. It means net profit generated by a specific sales activity or investment. And "cost" doesn't mean your marketing budget line item - it means the total investment required to produce that profit. Salary, benefits, tools, training, ramp time, office allocation, lead acquisition costs. All of it. Most teams calculate their returns with a thin denominator and a fat numerator. The result looks great on a slide deck and means nothing in practice.
A closely related metric worth understanding is return on sales (ROS), which measures operating profit as a percentage of revenue. ROS tells you how efficiently your company converts top-line revenue into actual profit - a useful complement because it highlights operational efficiency rather than investment payback. If your ROS is shrinking while your investment returns look healthy, you're growing revenue at the expense of margins.
The Sales ROI Formula (And What Belongs in the Denominator)
Here's the formula that actually works:
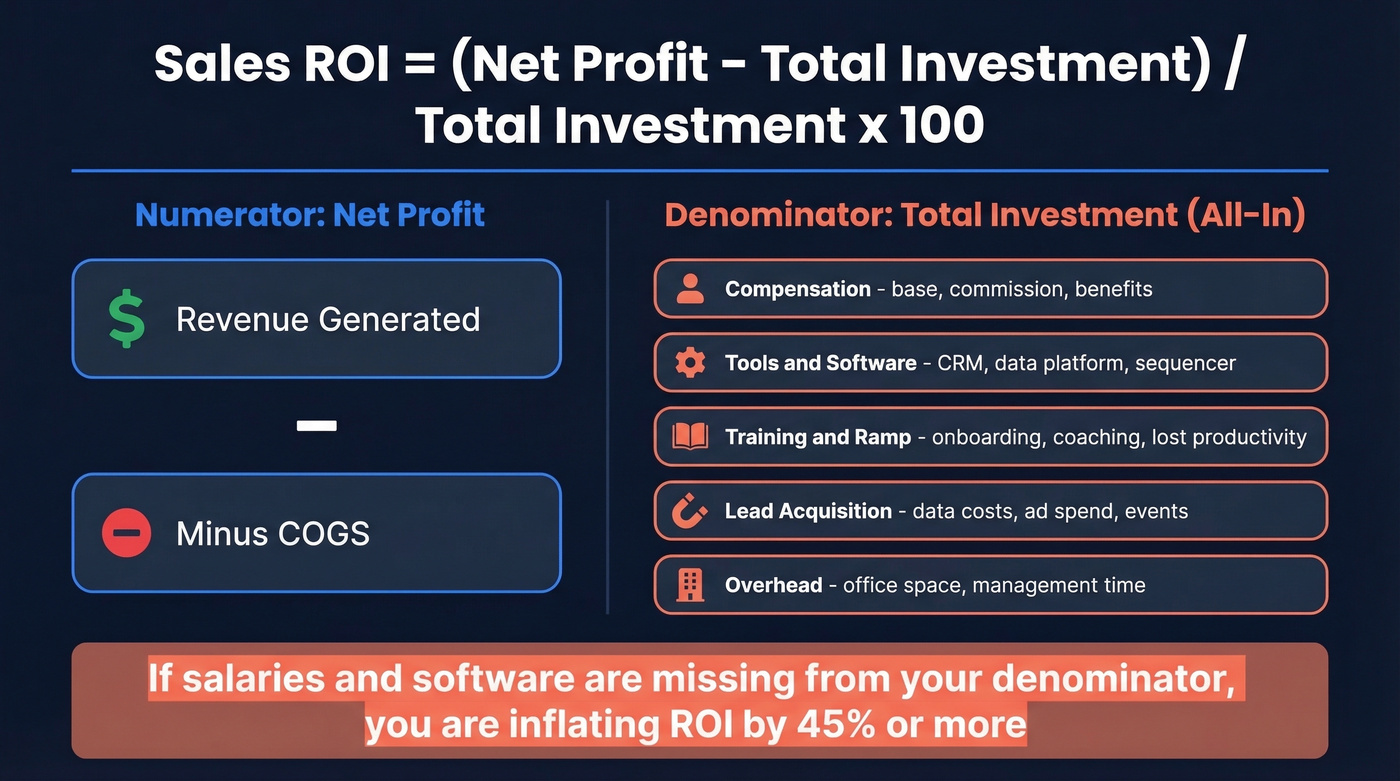
Sales ROI = (Net Profit from Sales Activity - Total Investment) / Total Investment x 100
The numerator is straightforward - revenue generated minus COGS. The denominator is where teams get sloppy. A practitioner on r/marketing described this exact problem: after rebuilding their company's marketing from scratch, basic ROI showed -85% because they weren't sure whether to include salary and tools in the calculation. They'd sourced 37% of deals directly and influenced 60%, but the single ROI number told none of that story.
Here's the thing: if a cost is required to generate the sale, it belongs in the denominator. No exceptions.
| Cost Category | Examples |
|---|---|
| Compensation | Base salary, commission, benefits |
| Tools & software | CRM, data platform, sequencer |
| Training & ramp | Onboarding, coaching, ramp period |
| Lead acquisition | Data costs, ad spend, events |
| Overhead allocation | Office, management time |
One useful budget allocation benchmark from OnRamp Funds: 40% ads, 30% salaries, 15% software, 10% content, 5% direct sales costs. Your mix will vary, but if salaries and software aren't in your denominator, you're inflating your ROI by 45% or more before you even start.
Two Worked Examples
ROI on a Sales Rep
Say you've got an AE with an all-in annual cost of $120,000 - $85K base, $15K in benefits, $10K in tools, and $10K in training and ramp-time productivity loss.
Over 12 months, that rep closes $400,000 in revenue. Your gross margin is 70%, so net profit attributable to the rep is $280,000.
ROI = ($280,000 - $120,000) / $120,000 x 100 = 133%
That's roughly a 2.3:1 return. Decent, but below the 3:1-5:1 "good salesperson ROI" range. Below 3:1, you're subsidizing activity. Above 5:1, you might be under-investing - you could add headcount and still maintain healthy returns.
ROI on a Data Verification Tool
Now let's run the math on a data verification tool. You're paying $100/month - $1,200/year. Your team sends 10,000 emails per month with a 22% bounce rate, meaning 2,200 wasted sends every month.
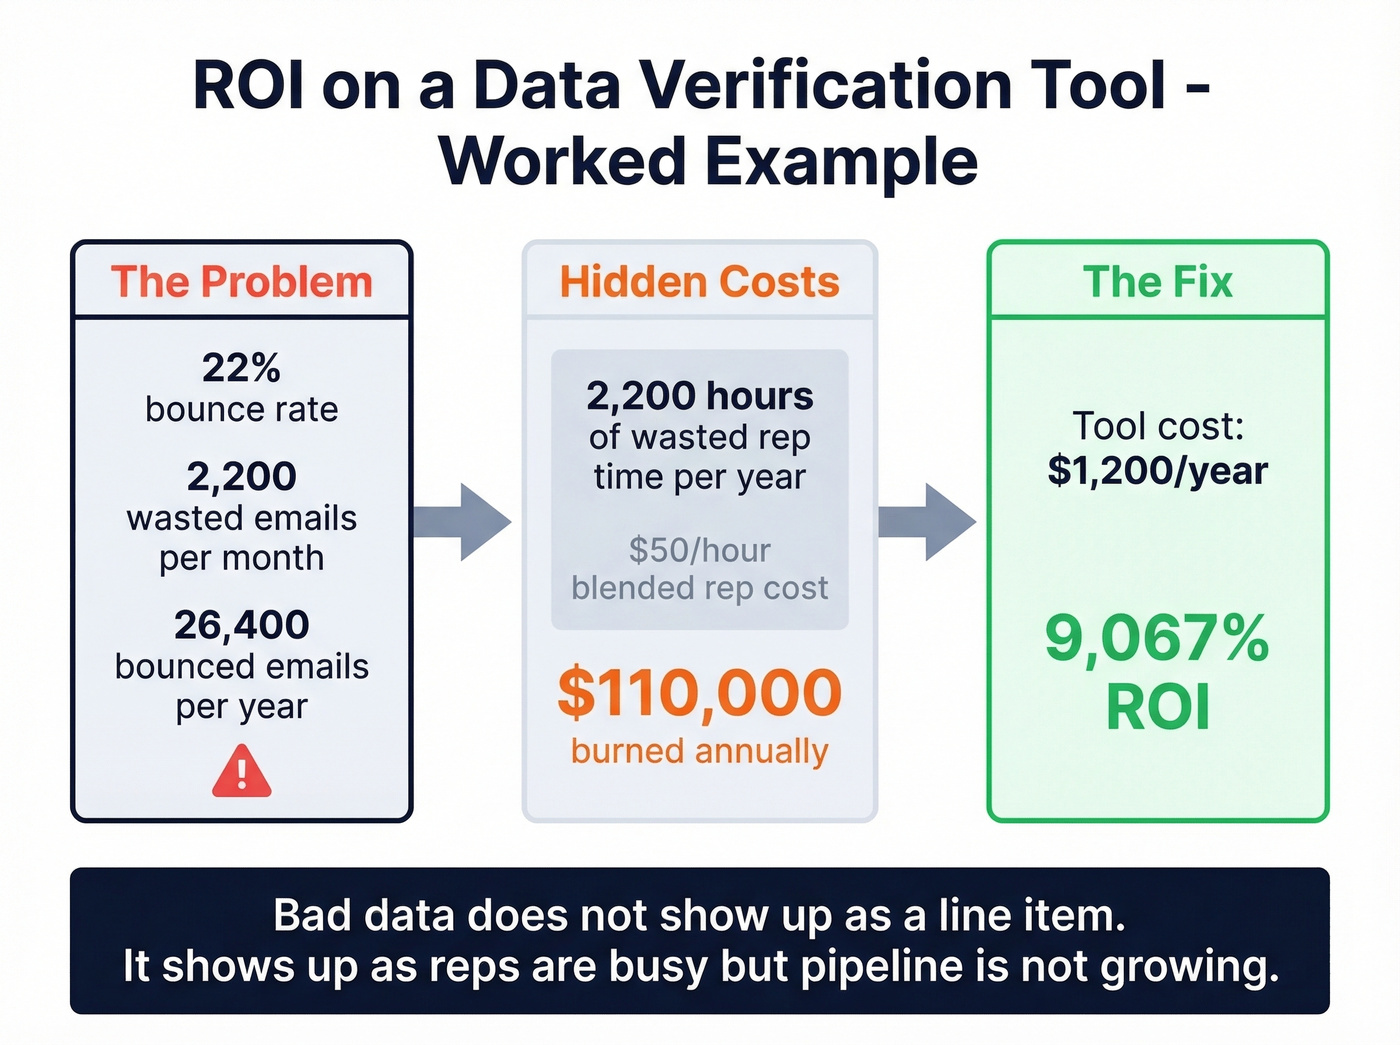
Each bounced email costs an estimated 5 minutes of rep follow-up, list cleanup, and domain reputation damage. That's 26,400 bounced emails per year, or 2,200 hours of wasted rep time. At a blended rep cost of $50/hour, you're burning $110,000 in hidden labor costs.
ROI = ($110,000 - $1,200) / $1,200 x 100 = 9,067%
That's before you count the pipeline impact of actually reaching 2,200 more valid prospects per month. The math on data quality tools is almost always absurd - which is exactly why bad data is such an insidious problem. It doesn't show up as a line item. It shows up as "reps are busy but pipeline isn't growing."
You just saw the math: a 22% bounce rate burns $110K/year in hidden rep costs. Prospeo delivers 98% email accuracy with a 7-day data refresh cycle, so your denominator stays lean and your reps spend time selling - not cleaning lists. At $0.01 per email, the ROI calculation is almost embarrassing.
Stop subsidizing bad data. Start tripling pipeline like Meritt did.
Benchmarks: What Good Looks Like in 2026
Knowing your formula is useless without context. Here's what the data says about where top-performing teams land, drawn from Outreach's sales benchmarks:
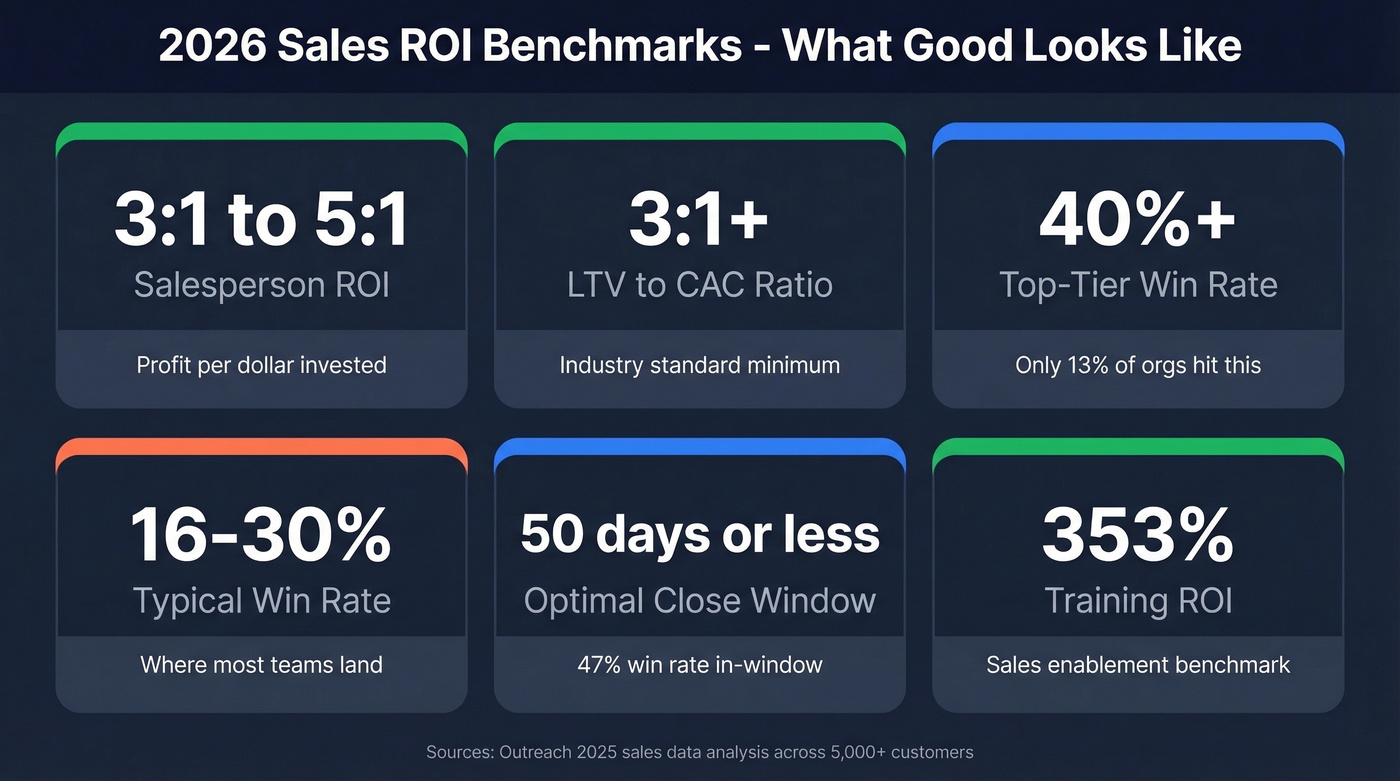
| Metric | Target Range | Context |
|---|---|---|
| Salesperson ROI | 3:1-5:1 | Profit per $ invested |
| LTV:CAC ratio | >= 3:1 | Industry standard |
| Win rate (top tier) | 40%+ | Only 13% of orgs hit this |
| Win rate (majority) | 16-30% | Where most teams land |
| Optimal close window | <= 50 days | 47% win rate in-window |
| Training ROI | 353% | Sales enablement benchmark |
The speed-to-close number is the one most teams overlook. Opportunities that close within 50 days convert at a 47% win rate. After that window, win rates drop to roughly 20% or lower. Every day you add to your sales cycle is money evaporating from your numerator.
The training ROI stat deserves attention too: companies that invest in formal sales enablement programs see a 353% return on training spend, and their teams hit a 49% win rate compared to 42.5% without structured enablement. That's a 6.5-percentage-point lift from training alone - one of the highest-leverage investments you can make.
The majority of organizations report win rates between 16% and 30%. If you're in that range, you're normal - not great. The 13% of teams hitting 40%+ aren't just better at selling. They're better at qualifying, which means they're spending their denominator dollars on higher-probability opportunities.
If your average deal size is under $10K, you probably don't need a $50K/year data platform or a 12-person SDR team. A lean stack with verified data and tight qualification will outperform a bloated one with bad targeting every time.
Beyond Basic ROI: LTV:CAC, Payback, and Sales Velocity
Basic ROI tells you whether an investment paid off. These metrics tell you whether your sales engine is healthy.
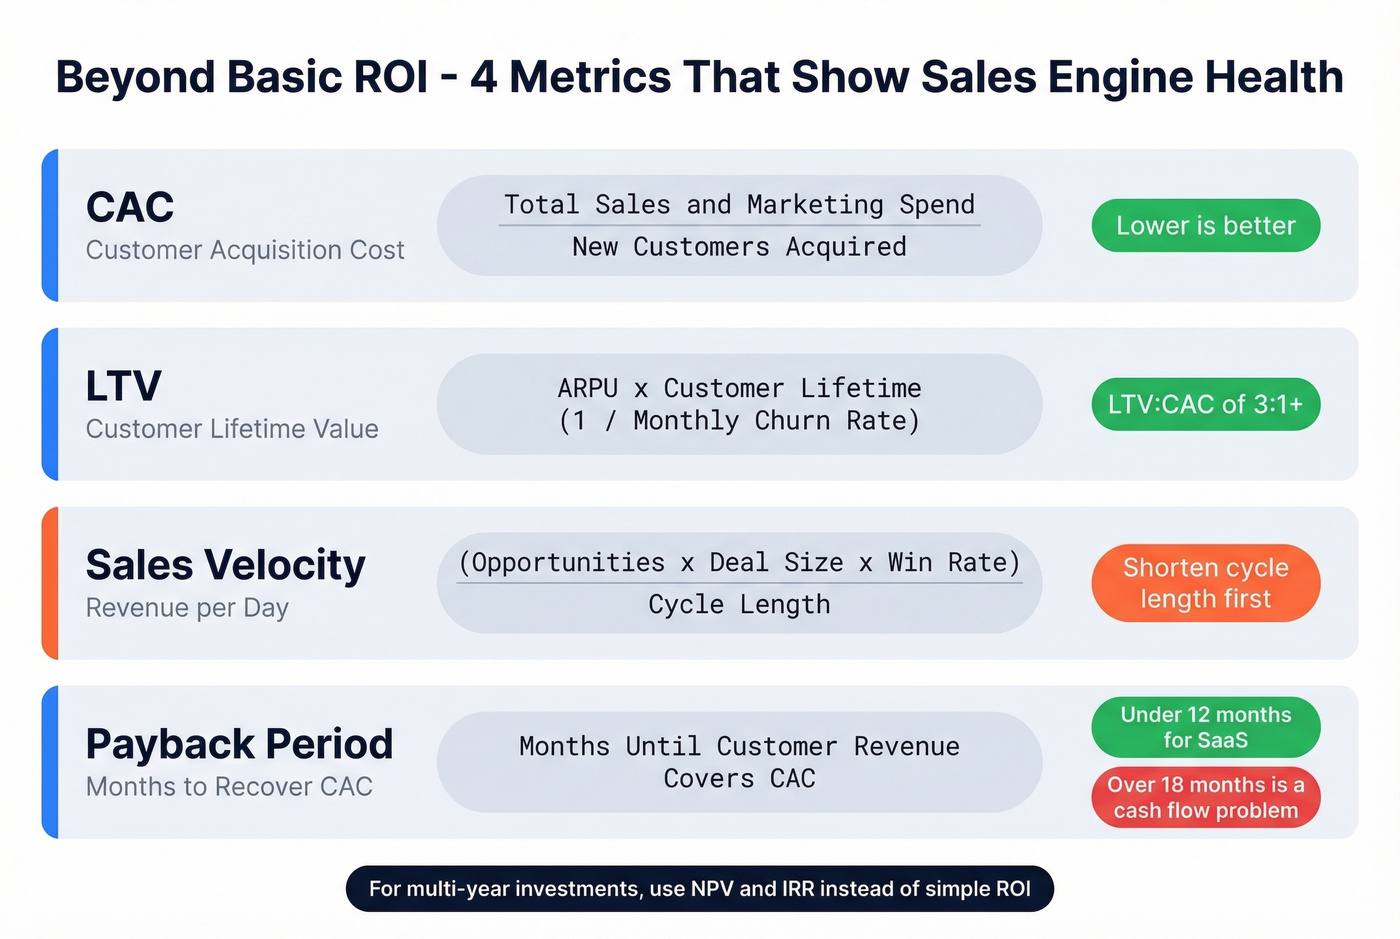
CAC (Customer Acquisition Cost)
Total Sales & Marketing Spend / New Customers Acquired. This is your complete cost per customer - ads, salaries, tools, everything. If you want a deeper breakdown, see our guide to CAC (Customer Acquisition Cost).
LTV (Customer Lifetime Value)
ARPU x Customer Lifetime. If you know your monthly churn rate, customer lifetime approximates to 1 / Monthly Churn Rate. A 3% monthly churn gives you ~33 months of customer lifetime. A 1:1 LTV:CAC ratio means you're spending a dollar to earn a dollar. At 3:1, you have room for error and reinvestment.
Sales Velocity
(Number of Opportunities x Average Deal Size x Win Rate) / Sales Cycle Length. This tells you how much revenue your pipeline generates per day. Improving any of the four variables improves velocity, but shortening cycle length is the highest-leverage move because it compounds across every deal. For multi-year investments like new market entry, NPV and IRR give you a more accurate picture than simple ROI - HBS has a solid primer on when to use which.
If you want to pressure-test the inputs, start with pipeline health and your sales conversion rate.
Payback Period
How many months until a customer's revenue covers their CAC. For SaaS, under 12 months is healthy. Over 18 months and you've got a cash flow problem regardless of what your LTV:CAC says.
The Hidden ROI Killer: Bad Data
We've seen this pattern repeatedly: a team invests $50K in a data platform, builds beautiful sequences, and then watches 20-40% of their emails bounce. Every bounced email inflates your CAC with invisible costs - wasted rep time, damaged sender reputation, and opportunities that never had a chance.
If you're diagnosing this, start by tracking your email bounce rate and tightening your email deliverability fundamentals.
The proof points are stark. Snyk's 50-person AE team was running bounce rates of 35-40%. After fixing their data quality with Prospeo, bounces dropped to under 5%, AE-sourced pipeline jumped 180%, and the team generated 200+ new opportunities per month. Meritt saw pipeline triple from $100K to $300K per week after addressing the same problem.
This is why data quality tools pay for themselves - often within the first month. At roughly $0.01 per verified email with 98% accuracy and a 7-day refresh cycle, the ROI math from our worked example isn't theoretical. It's what teams actually experience when they stop sending to dead addresses.
Look - you can optimize your sequences, refine your ICP, and train your reps. But if 25% of your emails never arrive, you're optimizing on top of a broken foundation.
Every day past 50 days kills your win rate. The fastest way to compress your sales cycle is reaching verified buyers on the first touch - not chasing bounced emails and dead numbers. Prospeo gives you 143M+ verified emails and 125M+ direct dials with 30% pickup rates, so reps connect with real decision-makers from day one.
Shrink your sales cycle by reaching the right people immediately.
Five Common Sales ROI Mistakes
1. Excluding total costs from the denominator. Your ROI looks amazing until someone asks why you left out salaries, tools, and overhead. Include everything required to generate the sale.
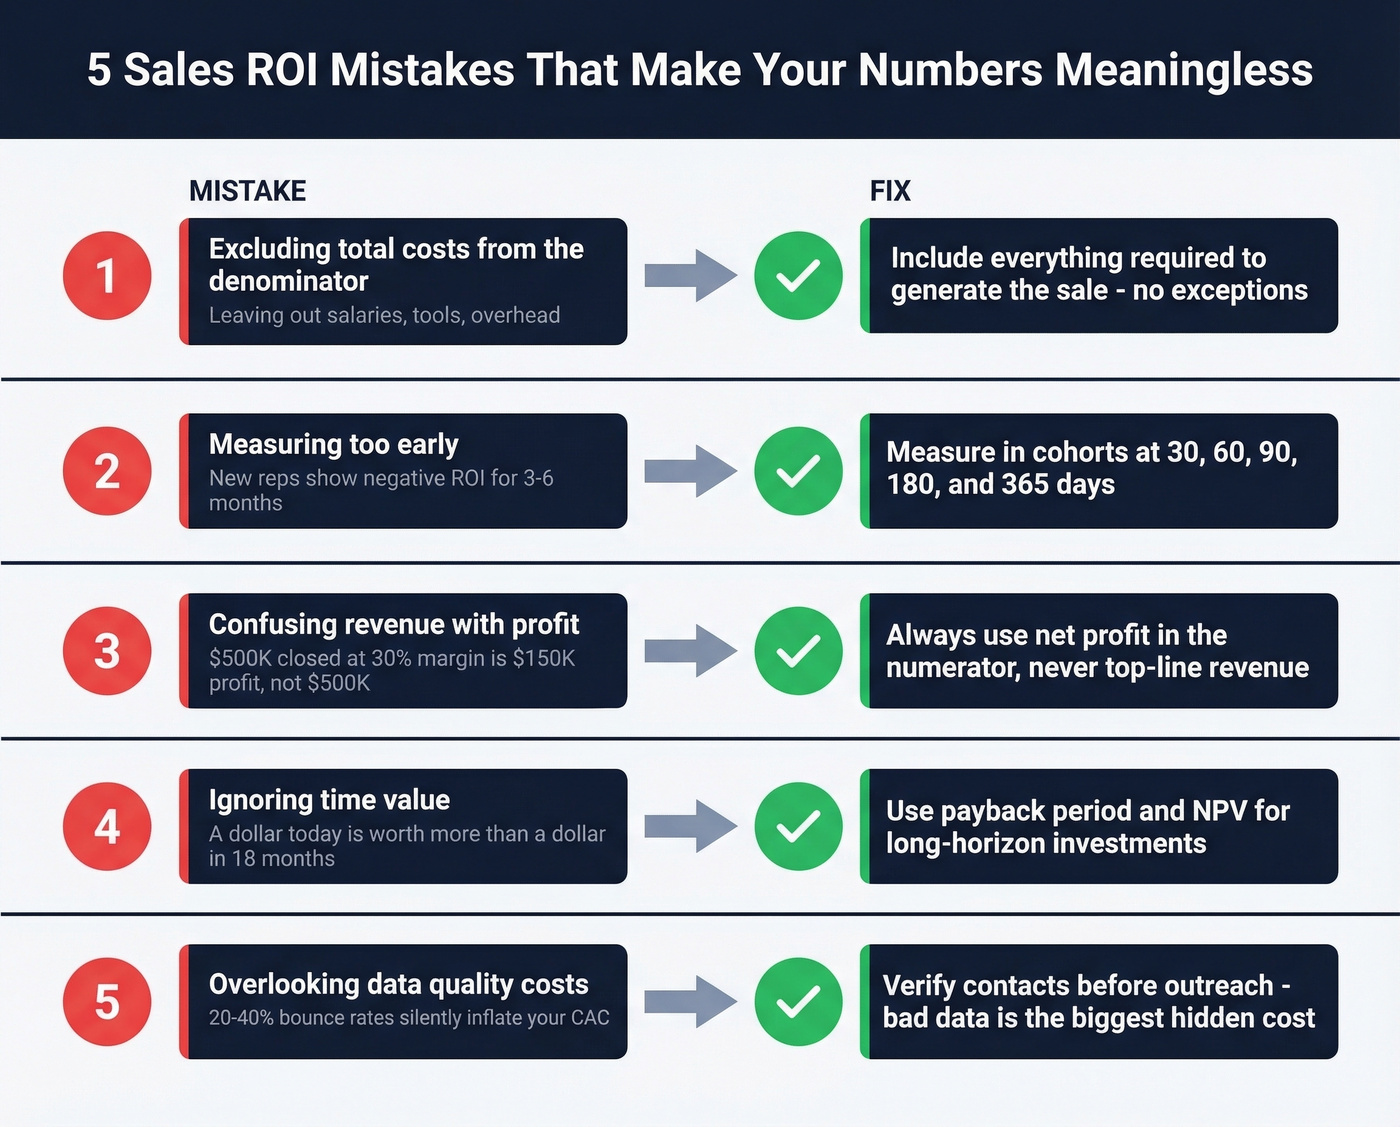
2. Measuring too early. New reps show negative ROI for 3-6 months. New tools take a quarter to reach adoption. In our experience, teams that measure in cohorts - 30, 60, 90, 180, and 365 days - catch problems 2-3 months earlier than those using annual snapshots. If you're onboarding new hires, a structured 30-60-90 day plan makes ROI measurement cleaner.
3. Confusing revenue with profit. A rep who closes $500K at 30% margin generated $150K in profit, not $500K. Your numerator is net profit, always. (If you need a refresher on margin math, see what is a sales margin.)
4. Single-touch attribution. If marketing influenced 60% of deals but only "sourced" 37%, a single-touch model will massively undercount marketing's contribution and overcount sales'. Skip this if your team doesn't have multi-touch attribution set up yet - you'll just be arguing over bad data.
5. Ignoring time value of money. A dollar of profit today is worth more than a dollar next year. For multi-year investments, NPV exists for a reason.
The contrarian take: stop calculating ROI annually. Cohort-based measurement gives you a trajectory, not just a snapshot - and trajectory is what actually informs decisions.
FAQ
What's a good ROI per salesperson?
A 3:1 to 5:1 return on total investment is the standard benchmark. Below 3:1, you're subsidizing activity. Above 5:1, adding headcount could still yield healthy returns.
Should I include salaries in my sales ROI calculation?
Yes, always. If a cost is required to generate the sale, it belongs in the denominator. Excluding salaries and tools inflates your numbers by 45%+ and leads to bad investment decisions.
How does data quality affect sales returns?
When 20-40% of emails bounce, reps waste hours on dead leads and your CAC balloons with invisible costs. Snyk cut bounces from 35% to under 5% and saw pipeline jump 180% after switching to verified data.
How long should I wait before measuring ROI on a new investment?
Minimum 90 days for tools and campaigns, six months for new hires. Use cohort-based measurement at 30, 60, 90, 180, and 365 days instead of a single annual snapshot. The trajectory matters more than the first data point.