SaaS Metrics: CAC - The Complete 2026 Guide
You're spending $2.00 to acquire every $1.00 of new ARR. That's the median CAC ratio across B2B SaaS right now - up 14% year-over-year. Of all SaaS metrics, CAC is the one most teams get wrong. If you don't know your number, you're flying blind. If you do know it but you're using blended averages, you're flying blind with a dashboard that lies to you.
The Short Version
The formula: Total Sales & Marketing spend / New customers acquired = CAC.
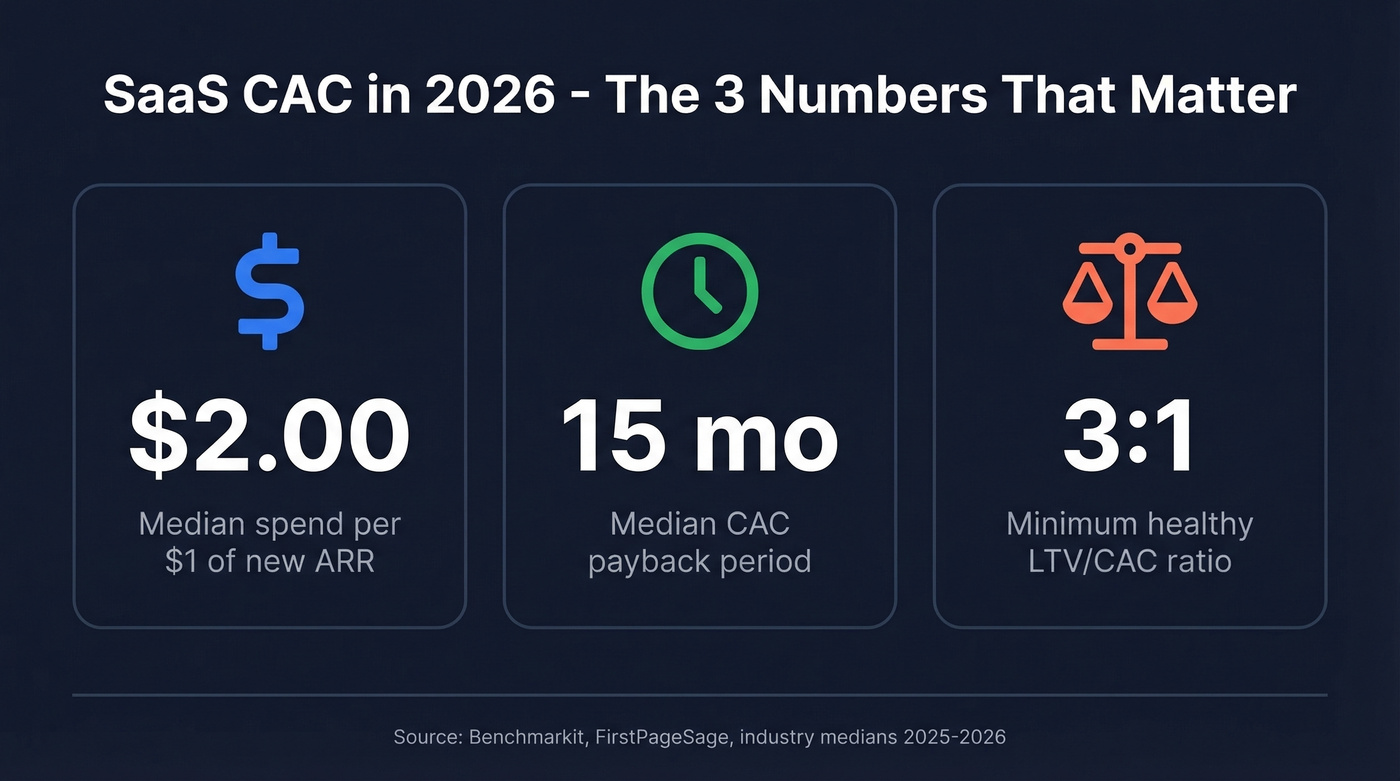
The benchmark: Median New CAC ratio is $2.00 per $1.00 of new ARR. Bottom quartile spends $2.82.
The three metrics to track: New CAC (not blended), gross-margin-adjusted payback period, and LTV/CAC ratio by cohort. Everything else is noise until these three are clean.
What Is Customer Acquisition Cost in SaaS?
Customer acquisition cost is the fully loaded cost of winning a new paying customer. The standard formula divides total sales and marketing expense by the number of new customers acquired in a given period. Simple in theory. Messy in practice - because what counts as "sales and marketing expense" is where most teams diverge.
The CAC ratio is the dollar-efficiency version: instead of dividing by customers, you divide by ARR acquired. Many teams calculate it as Sales & Marketing expense divided by new customer ARR, often called the New CAC Ratio. Others use a blended version that divides by new plus expansion ARR, and there are expansion-only variants too. Either way, it tells you how many dollars you spend to generate one dollar of recurring revenue.
Benchmarkit's latest data puts the median New CAC Ratio at $2.00, meaning half of SaaS companies spend more than two dollars for every dollar of new customer ARR they bring in.
How to Calculate CAC
The numerator needs to be fully loaded. Include salaries multiplied by 1.3x to account for benefits, taxes, and overhead. Add commissions, bonuses, software tools (CRM, sequencing, data providers, analytics), paid ads, SEO spend, content production, travel, events, and any contractors tied to acquisition.
Two critical rules. First, acquisition cost stops at the time of sale - anything post-close like onboarding, CS, and implementation is COGS, not CAC. Second, allocate between new business and expansion. A common heuristic is 60-80% of S&M to new acquisition, but if your reps handle both, split by lead flow (new vs. existing leads), not pipeline.
Use a 3-12 month analysis window that matches your sales cycle. A PLG company with a 14-day trial can use monthly windows. An enterprise team with 6-month cycles needs at least two quarters of data to get a number worth trusting.
New CAC vs. Blended CAC
Blended CAC is where the math breaks down. A practitioner on r/SaaS put it well: if your enterprise outbound motion runs $50K LTV / $15K CAC while self-serve organic runs $2K LTV / $200 CAC, averaging those produces a number that describes neither motion accurately.
The fix is cohorting by acquisition channel and pricing tier. It requires more discipline, but it's the only approach that gives you actionable numbers. Blended CAC is fine for a board slide. It's useless for deciding where to spend your next dollar.
2026 CAC Benchmarks
Acquisition costs are up 40-60% since 2023, driven by rising ad costs, privacy changes, and attribution fragmentation. Here's where the numbers land today.
By Industry
| Industry | Avg CAC |
|---|---|
| eCommerce SaaS | $274 |
| B2B SaaS | $536 |
| Higher Education | $1,143 |
| Fintech | $1,450 |
| Fintech (Enterprise) | Up to $14,772 |
By Segment
| Segment | CAC Range |
|---|---|
| SMB | $100-$400 |
| Mid-Market | $400-$800 |
| Enterprise | $800+ |
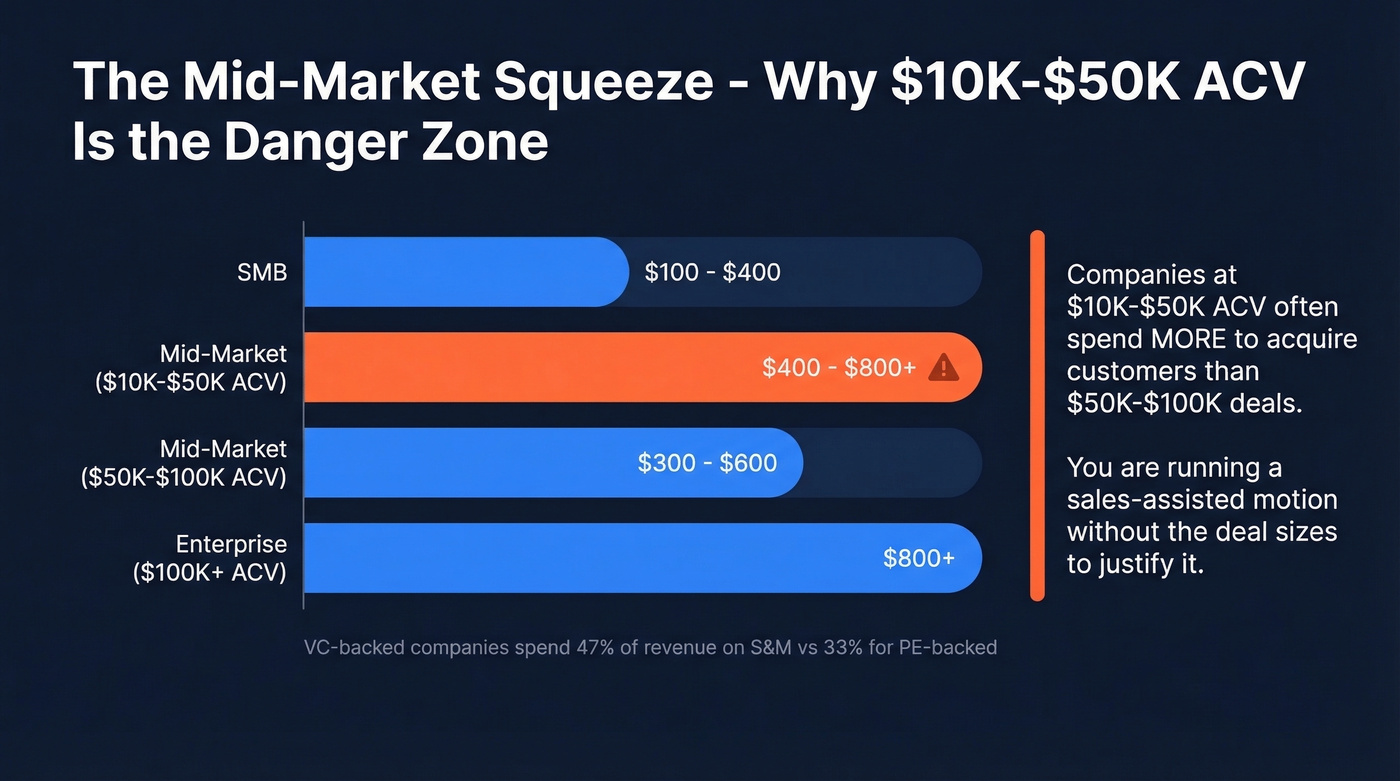
The mid-market squeeze is the most underappreciated dynamic in SaaS right now. Benchmarkit found that $10K-$50K ACV solutions are often more expensive to acquire than $50K-$100K ACV deals. You're running a sales-assisted motion without the deal sizes to justify it. If your ACV sits in that range, you need to either move upmarket or find a way to add PLG leverage. There's no comfortable middle ground.
For context, VC-backed companies spend a median 47% of revenue on S&M, versus 33% for PE-backed companies. That gap tells you a lot about what "efficient growth" actually looks like depending on your capital structure.
By Channel
| Channel | Avg CAC |
|---|---|
| Partner/Referral | $150 |
| Inbound | $200 |
| Paid Ads | $350 |
| Outbound | $400 |
| Events | $500 |
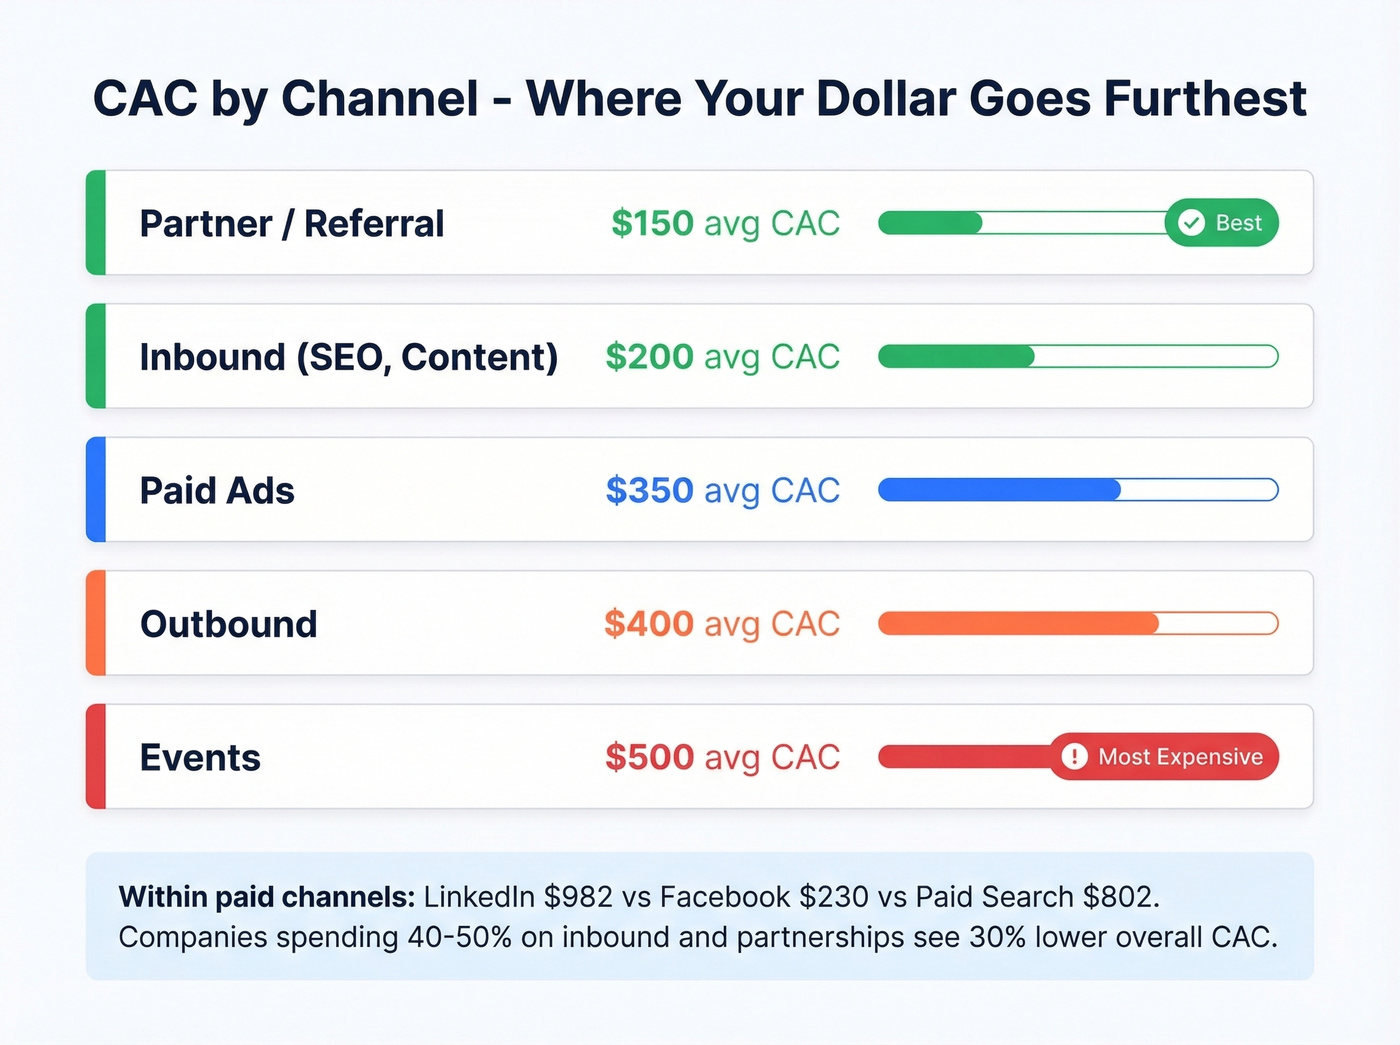
Within paid channels, the spread is dramatic. LinkedIn CAC runs roughly $982 versus Facebook at around $230 and paid search (B2B) at about $802. Companies allocating 40-50% of budget toward inbound and partnerships see roughly 30% lower overall acquisition cost than outbound-heavy strategies.
Outbound CAC averaging $400 per customer? Bad data is the hidden multiplier. Prospeo's 98% email accuracy and 30% mobile pickup rate mean fewer wasted touches, shorter sales cycles, and a payback period that actually shrinks. At $0.01 per verified email, your cost-per-acquired-dollar drops fast.
Fix your CAC at the source - start with data that connects.
CAC Payback Period
Payback tells you how many months of revenue it takes to recover what you spent acquiring a customer. The formula: CAC / MRR per customer = months to payback.
The median across SaaS is 15 months. Top quartile gets there in under 12. Anything above 18 months is a red flag unless you're running a high-ACV enterprise motion with strong retention.
| GTM Motion | Payback Range |
|---|---|
| PLG | 6-12 months |
| Sales-Led | 12-18 months |
| ABM | 18-24 months |
Payback also shifts by ACV band: SMB deals under $15K typically recover in 8-12 months, mid-market ($15K-$100K) in 14-18 months, and enterprise above $100K in 18-24 months.
Industry-specific targets from FirstPageSage's benchmarks:
| Industry | SMB (Avg / Good) | Mid-Mkt (Avg / Good) | Enterprise (Avg / Good) |
|---|---|---|---|
| Fintech | 12 / 7 mo | 18 / 12 mo | 23 / 18 mo |
| Security | 13 / 8 mo | 19 / 13 mo | 25 / 19 mo |
| Business Svcs | 14 / 8 mo | 20 / 14 mo | 30 / 20 mo |
One stat that reframes the whole conversation: around 40% of new ARR now comes from expansion revenue. For companies above $50M ARR, expansion exceeds 50% of total new ARR. If your payback calculation ignores upsells and expansions within the first year, you're overstating how long it actually takes to recover acquisition spend.
LTV/CAC Ratio
Lifetime value divided by customer acquisition cost. The 3:1 benchmark is the floor - below that, you're likely losing money after accounting for COGS and churn.
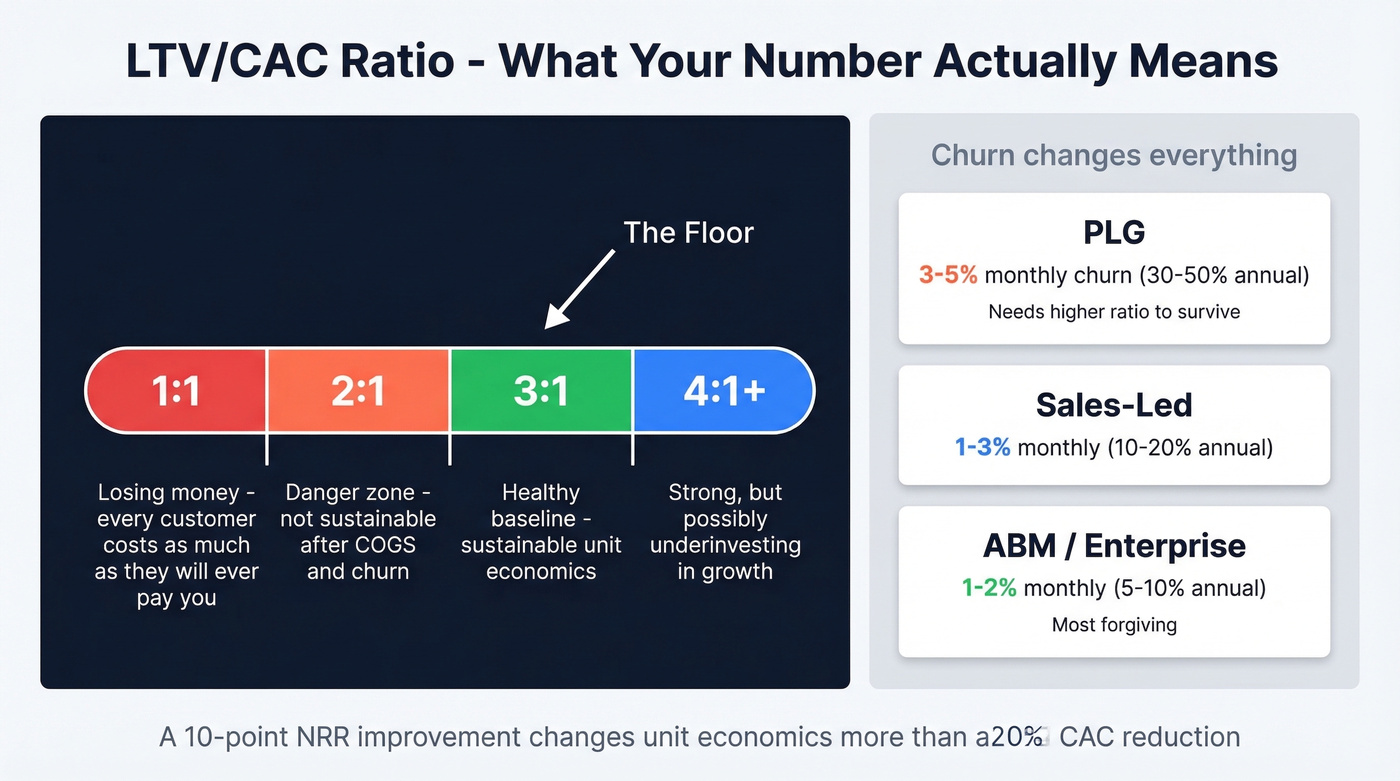
- 1:1 - You're losing money. Every customer costs as much as they'll ever pay you.
- 3:1 - Healthy baseline. Sustainable unit economics.
- 4:1+ - Strong, but you're potentially underinvesting in growth.
Here's the thing: 3:1 is a starting point, not a strategy. Churn is the denominator that makes LTV/CAC meaningful, and it varies wildly by GTM motion. PLG companies typically see 3-5% monthly churn (30-50% annual), sales-led motions run 1-3% monthly (10-20% annual), and ABM sits at 1-2% monthly (5-10% annual). A PLG company with 5% monthly churn needs a much higher ratio than an enterprise company with 95% annual retention.
We've seen teams celebrate a 3:1 ratio while hemorrhaging customers - the ratio looked healthy because they hadn't updated their churn assumptions in two quarters. Don't be that team. (If you want to pressure-test retention math, start with a proper churn analysis.)
Common CAC Mistakes
1. Using blended CAC across motions. One number across structurally different channels tells you nothing useful. Cohort by channel and pricing tier, or the number is decoration.
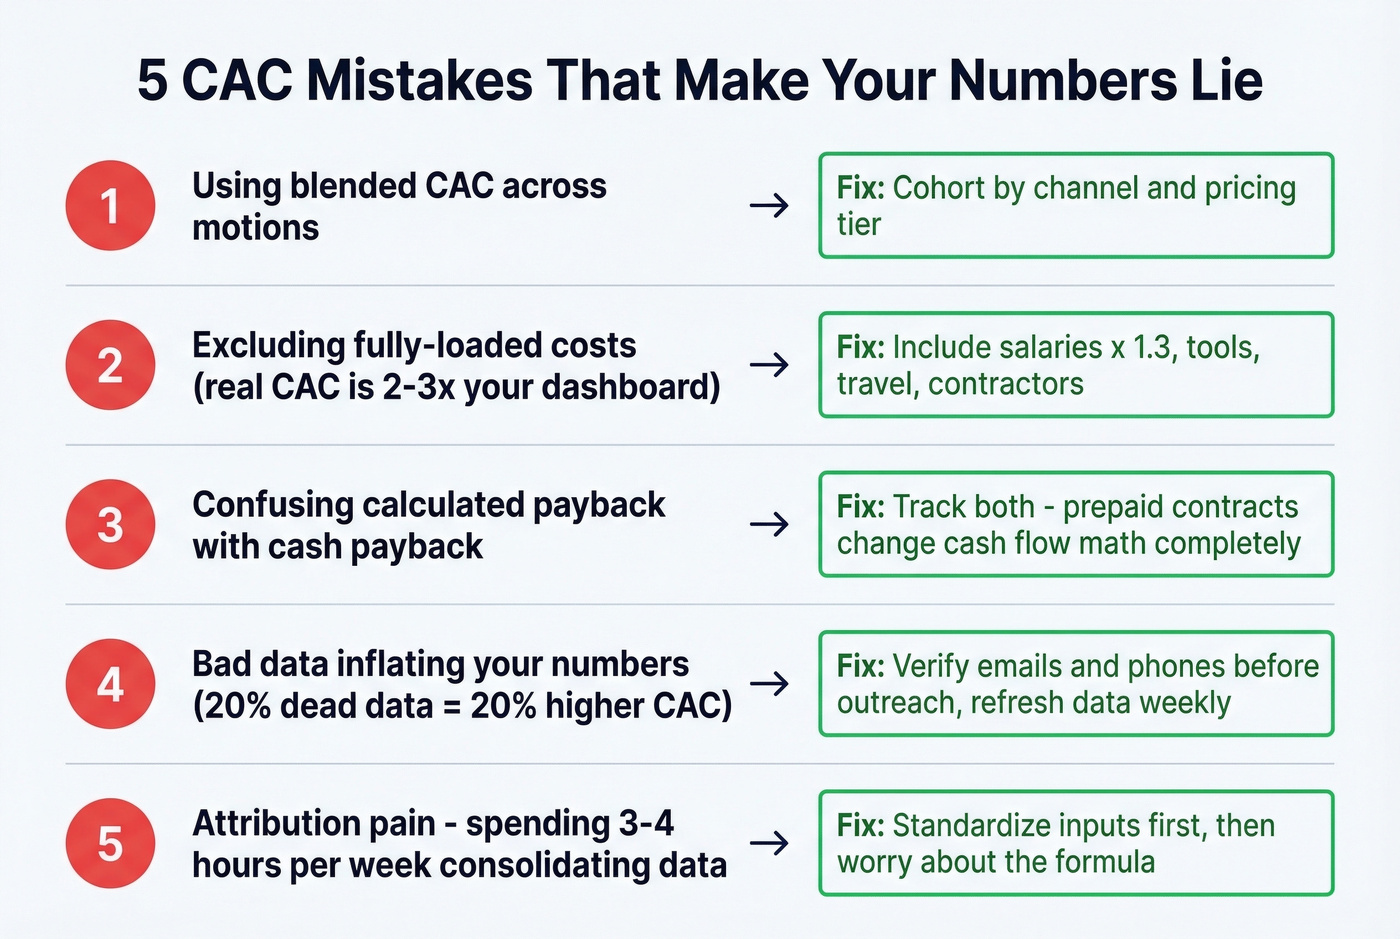
2. Excluding fully-loaded costs. Your real acquisition cost is 2-3x what your marketing dashboard shows. That dashboard tracks ad spend. It doesn't track the $180K SDR salary, the $40K in tooling, or the $15K conference booth.
3. Confusing calculated payback with cash payback. A company selling 3-year prepaid contracts can have a calculated payback of 18 months but a cash payback of essentially one day. The math is the same; the cash flow implications are completely different.
4. Bad data inflating your numbers. Every bounced email, wrong phone number, and disconnected dial is spend with no customer in the denominator. If 20% of your prospect list is dead data, your effective cost per acquisition is 20% higher than it should be. This is why we're obsessive about data quality in our own outbound - tools like Prospeo verify emails at 98% accuracy before outreach, with a 7-day refresh cycle versus the 6-week industry average, so every lead in your denominator is real. (If you're auditing your stack, compare data enrichment services and your sales prospecting database side-by-side.)
5. Attribution pain compounding everything. One Reddit user reported spending 3-4 hours per week manually consolidating data across platforms just to get a number they half-trust. If that sounds familiar, your problem isn't the formula - it's the inputs.
SaaS Metrics That Shape CAC
Magic Number measures sales efficiency: (Current quarter ARR - Prior quarter ARR) x 4 / prior quarter S&M spend. Above 0.75 is healthy, above 1.0 is ideal, below 0.5 signals inefficient growth. OpenView's benchmark reports are a solid reference for tracking this over time. (To diagnose where efficiency breaks, map it to funnel metrics and pipeline health.)
Net Revenue Retention is the metric that makes or breaks your acquisition math. Median NRR runs 101-102%. Top quartile exceeds 110%. If your NRR is above 110%, your CAC becomes dramatically more forgiving because existing customers grow faster than new ones churn.
Let's be honest: most teams obsess over reducing acquisition cost when they'd get more leverage from improving NRR. A 10-point NRR improvement changes your unit economics more than a 20% CAC reduction. Fix retention first, then optimize acquisition. ChartMogul's SaaS benchmarks back this up consistently. If you need a practical framework for expansion, start with cross selling vs up selling.
Your LTV/CAC ratio is only as good as the data feeding your pipeline. Teams using Prospeo book 35% more meetings than Apollo users - that's 35% more efficiency from the same sales headcount. With 300M+ profiles refreshed every 7 days, you stop paying to chase stale contacts.
Book 35% more meetings without adding a single rep.
CAC FAQ
What's a good CAC for SaaS in 2026?
SMB companies typically land at $100-$400 per customer, mid-market at $400-$800, and enterprise at $800+. The median New CAC ratio across B2B SaaS is $2.00 per $1.00 of new ARR. Spending above $2.82 per dollar puts you in the bottom quartile.
What's the difference between CAC and CAC ratio?
CAC divides total S&M spend by new customers acquired - a dollar cost per logo. CAC ratio divides S&M spend by ARR acquired, giving you cost per dollar of revenue. The ratio is more useful for comparing across companies with different deal sizes.
How do I reduce my SaaS customer acquisition cost?
Shift budget toward inbound and referral channels, which run roughly 30% lower than outbound-heavy strategies. Segment by channel to identify and kill underperformers. Verify prospect data before outreach so every dollar of spend targets a real contact - bad data is the silent CAC killer most teams ignore.
Should I use blended or new CAC?
Always use new CAC, segmented by channel and pricing tier. Blended CAC averages structurally different motions - enterprise outbound and self-serve organic - into a single misleading number. Cohort your data or the calculation is just decoration for a board deck.