Sales Cycle Length: Benchmarks, Formula, and How to Shorten It
Deals closed within 50 days carry a 47% win rate. Deals that drag past 50 days? That win rate craters to 20%. Speed isn't a nice-to-have - it's the single strongest predictor of whether a deal closes at all.
And yet, 58% of B2B professionals say their cycles got longer over the past year, with 34% of sales teams now operating with cycle lengths of one to two full quarters. Something's broken, and most teams are measuring it wrong. Sales cycle length is the most underrated metric in revenue operations - everyone tracks it, almost nobody diagnoses it properly, and fewer still act on what the data tells them.
The Quick Version
Your average cycle duration is the number of days from first contact to closed-won. Here's what matters:
- Median B2B cycle: 84 days. Varies wildly by deal size, industry, and company size.
- 82% of your cycle time is top-of-funnel - lead-to-opportunity, not the close itself.
- Three highest-impact compression tactics: multi-thread from day one (cuts 25-35%), deliver proposals within 24 hours of demo (cuts 15-25%), and use mutual action plans for every deal over $50K (cuts 20-30%).
These compound. A team running all three can realistically cut total deal duration in half.
What Is Sales Cycle Length?
Sales cycle length measures the number of days between a prospect's first meaningful interaction with your team and the moment the deal closes. The formula is straightforward:
Sales Cycle Length = Total Days to Close All Deals / Number of Closed Deals
The tricky part is deciding when the clock starts. Some teams count from lead creation. Others start at opportunity creation. We recommend starting from the first meeting or qualified touchpoint - the moment a human rep engages. Starting from lead creation inflates the number with marketing nurture time that sales can't control.
One quick distinction: "sales cycle" refers to the stages a deal moves through (prospecting, qualification, demo, proposal, close), while "sales process" is the methodology your team follows within those stages. They overlap, but measuring cycle duration means tracking stage timestamps, not process adherence (more on sales process optimization).
Don't include stalled or "no decision" deals in your calculation. They'll distort everything. Track them separately as a pipeline hygiene issue.
How to Calculate It Properly
Most teams calculate the mean and call it a day. That's a mistake.
Say you closed five deals last quarter: 22 days, 28 days, 35 days, 41 days, and 310 days. The mean is 87 days. The median is 35 days. Which number better represents your typical deal? The median, obviously. That 310-day enterprise deal is real, but it shouldn't define how you forecast or coach.
Report median + P25/P75. The 25th percentile shows how fast your best deals move. The 75th shows where deals start dragging. The gap between them tells you more about pipeline health than any single number, and you should set CRM alerts for any deal exceeding P75 duration in its current stage - that's your early warning system for stalls.
Beyond central tendency, segment your data. A blended average across all deal sizes is nearly meaningless. Split by ACV tier, by channel (inbound vs. outbound vs. referral), and by prospect company size. A 90-day cycle might be terrible for your SMB segment and excellent for enterprise. You won't know until you split the data.
We've seen teams realize their "slow" pipeline was actually two fast segments and one broken one - and the fix was surgical, not systemic.
2026 Benchmarks by Segment
These benchmarks draw from a 939-deal pipeline study by Optifai and industry benchmark data from Focus Digital.
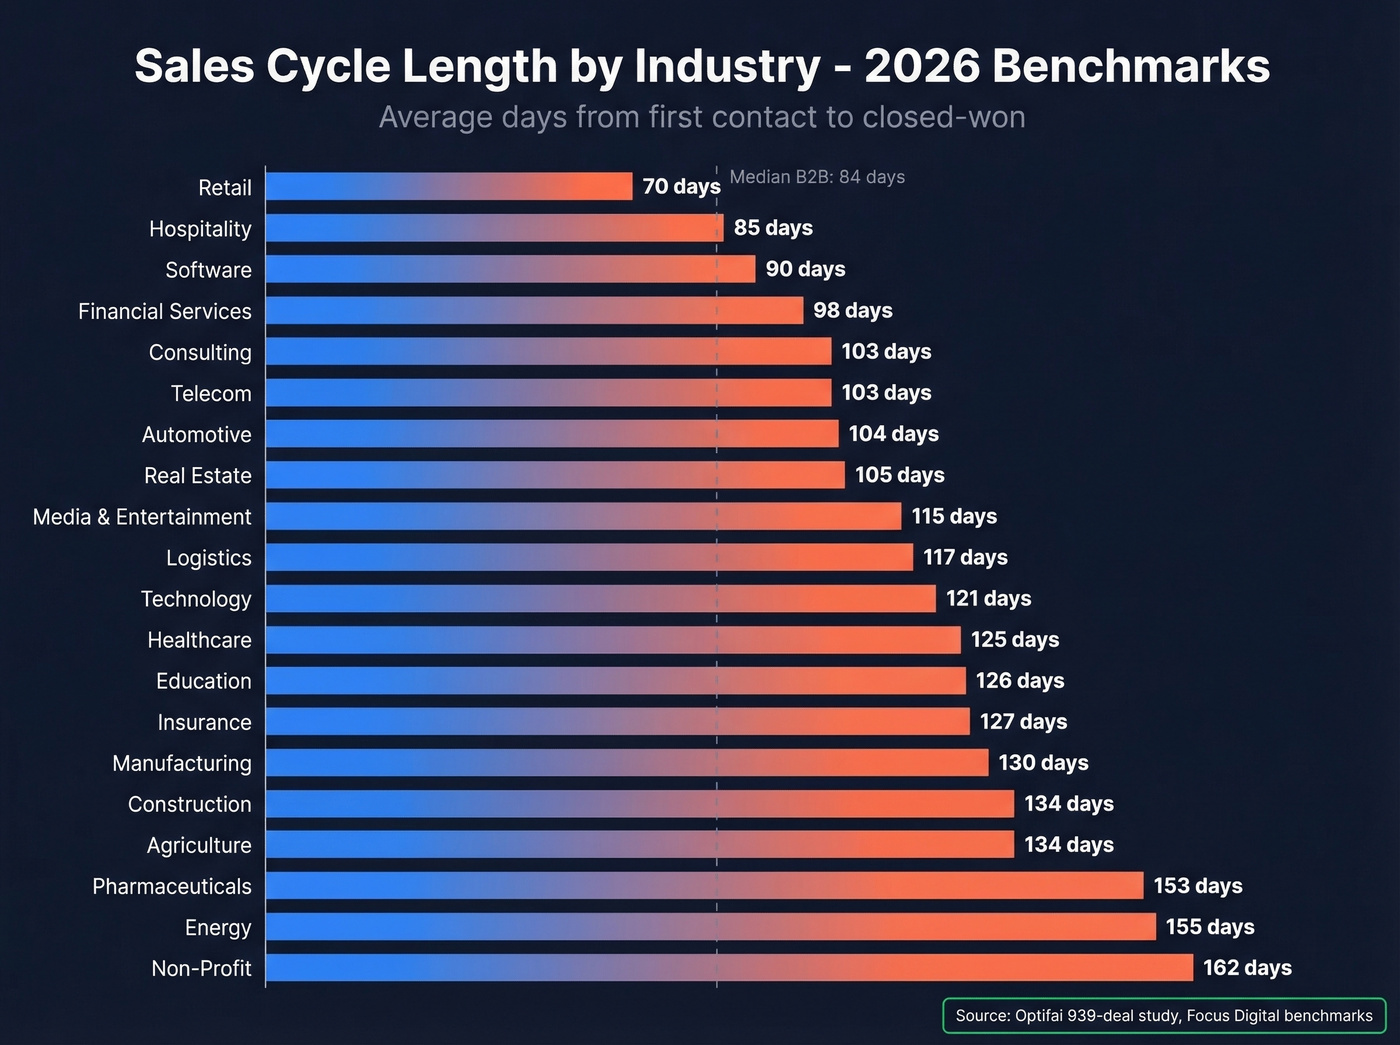
By Industry
| Industry | Avg Days |
|---|---|
| Retail | 70 |
| Hospitality | 85 |
| Software | 90 |
| Financial Services | 98 |
| Consulting | 103 |
| Telecom | 103 |
| Automotive | 104 |
| Real Estate | 105 |
| Media & Entertainment | 115 |
| Logistics | 117 |
| Technology | 121 |
| Healthcare | 125 |
| Education | 126 |
| Insurance | 127 |
| Manufacturing | 130 |
| Construction | 134 |
| Agriculture | 134 |
| Pharmaceuticals | 153 |
| Energy | 155 |
| Non-Profit | 162 |
The spread runs from 70 days for retail to 162 for non-profit. If you're benchmarking against a single "B2B average," you're comparing yourself to the wrong peer group.
By Company Size
| Prospect Employees | Avg Days |
|---|---|
| 1-10 | 38 |
| 11-50 | 57 |
| 51-200 | 77 |
| 201-500 | 95 |
| 501-1,000 | 115 |
| 1,001-5,000 | 135 |
| 5,001-10,000 | 158 |
| 10,001+ | 185 |
Every jump in company size adds procurement layers, more stakeholders, and longer legal reviews. Selling to a 10,000-person company takes nearly 5x longer than selling to a startup.
By Deal Size / ACV
| ACV Range | Avg Days |
|---|---|
| < $1K | 25 |
| $1K-$5K | 40 |
| $5K-$10K | 55 |
| $10K-$50K | 75 |
| $50K-$100K | 120 |
| $100K-$250K | 170 |
| $250K-$500K | 220 |
| > $500K | 270 |
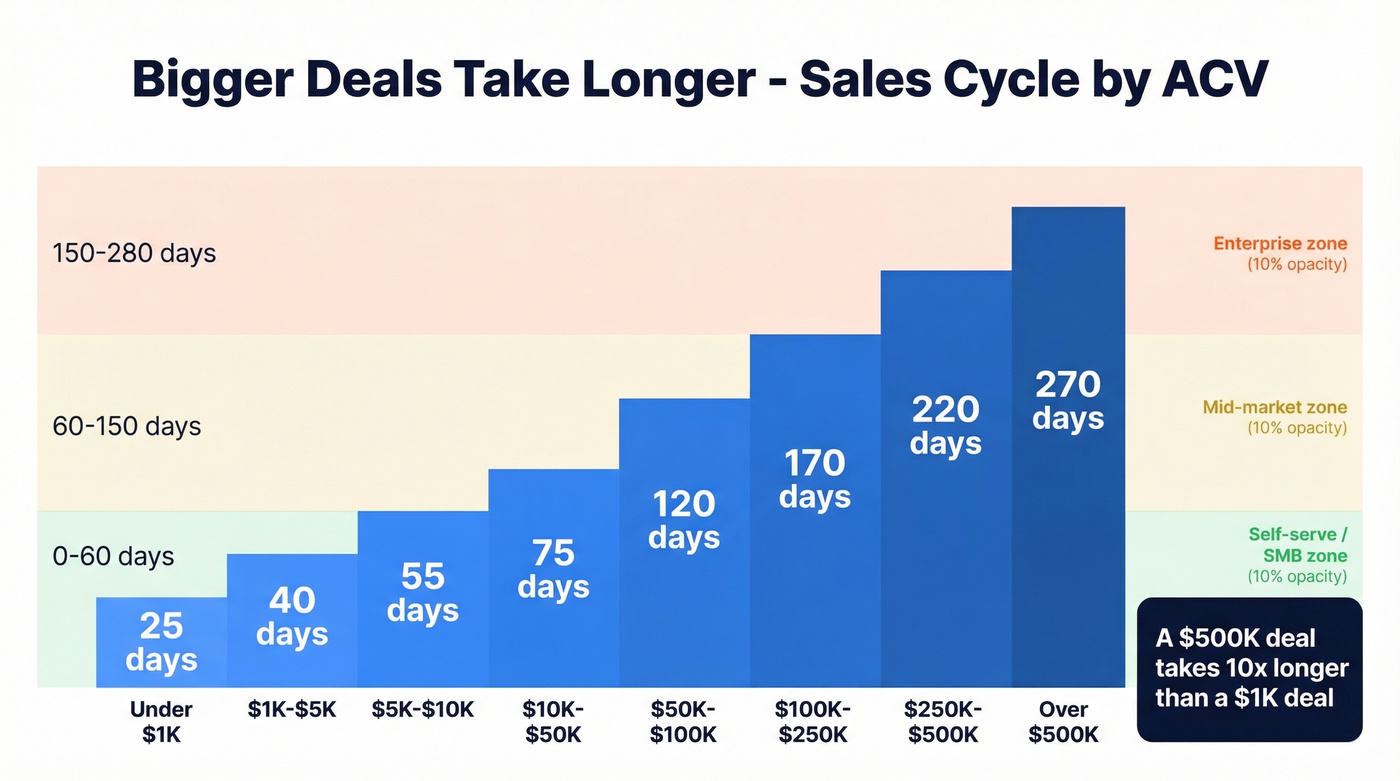
For SaaS specifically: SMB deals under $15K ACV close in 14-30 days, mid-market ($15K-$50K) in 30-60 days, and enterprise (>$100K) in 90-180+ days. These are the ranges your board cares about.
By Sales Channel
| Channel | Low Complexity | Medium | High |
|---|---|---|---|
| Referrals | 20 | 35 | 60 |
| SEO/Inbound | 28 | 50 | 75 |
| Trade Shows | 80 | 100 | 150 |
| Cold Calling | 60 | 85 | 110 |
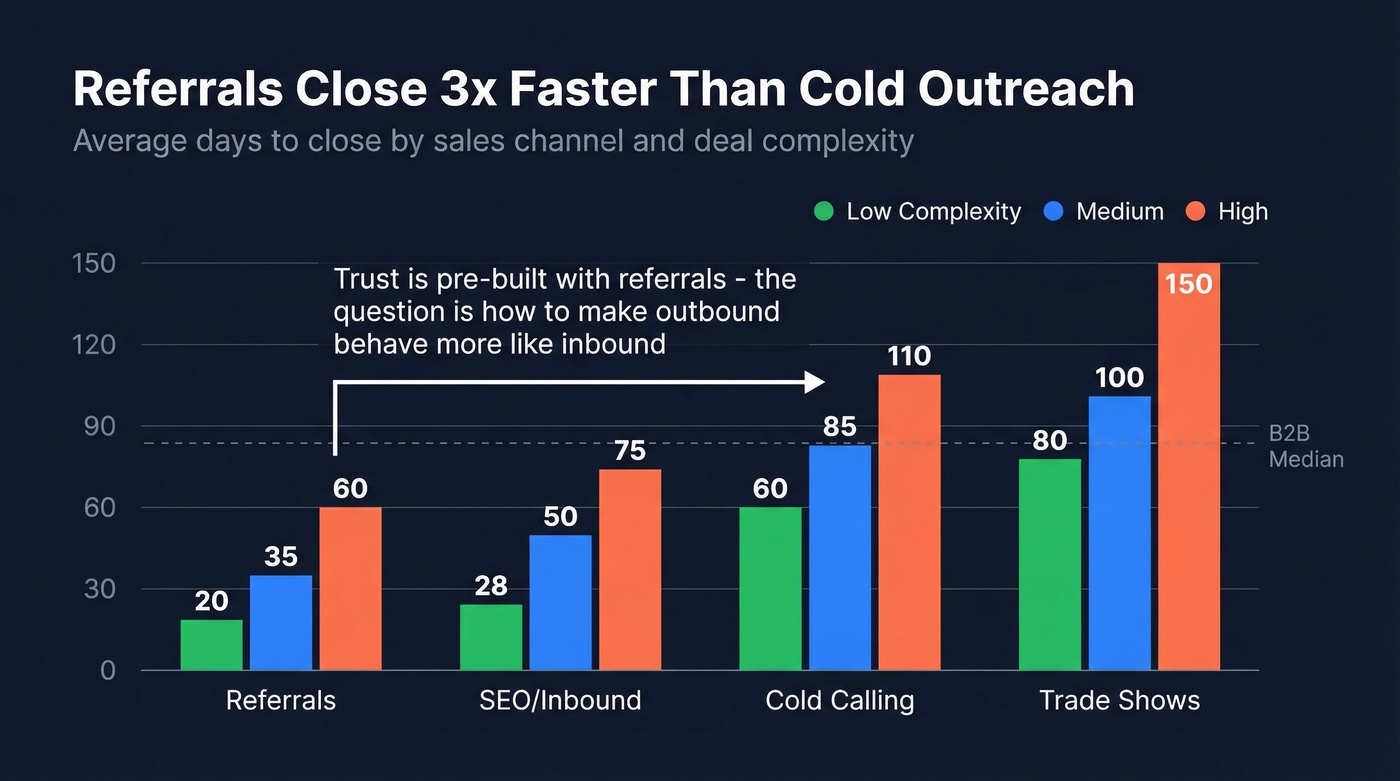
Referrals close 3x faster than cold outreach because trust is pre-built. But most teams can't scale referrals, so the real question is how to make your outbound channel behave more like inbound (see sales prospecting techniques).
Every extra day in your pipeline drops your win rate. Multi-threading from day one cuts cycles 25-35% - but only if you can actually reach every stakeholder. Prospeo gives you verified emails and direct dials for all 6.8 buying committee members, not just the one who replied to your cold email.
Stop losing deals to stakeholders you never contacted. Find the full committee in seconds.
Why Cycles Keep Getting Longer
The average B2B sales cycle has stretched to 6.5 months, up from 4.9 months in 2019. Cycles are up 22% since 2022 alone, and 86% of B2B purchases stall at some point before reaching a decision. Three forces are driving this.
Buying committees keep expanding. The average B2B purchase now involves 6.8 stakeholders, up from 5.4 in 2020. Every additional decision-maker adds scheduling delays, internal alignment meetings, and another person who can say no.
Security and compliance reviews have become a stage unto themselves. Security questionnaires and vendor risk assessments add 2-4 weeks to enterprise deals, and that's before legal gets involved with redlines.
Reps are drowning in admin. They spend only 28-30% of their time actually selling. The rest goes to CRM updates, tool juggling (the average rep uses 10 tools), and internal reporting. That's not cycle time the buyer controls - it's time your own org wastes.
On r/sales, enterprise AEs regularly report that new-territory cycles run 9-12 months - double the 3-6 month expectation in mature markets. If you're expanding into new segments, adjust your benchmarks accordingly.
Here's the thing, though - the "cycles always get longer" narrative isn't the whole story. A 6Sense study found that 49% of buyers say economic pressure actually shortened their cycles, with the average dropping from 11.3 months in 2024 to 10.1 months in 2025. Budget scrutiny can accelerate decisions when the alternative is losing budget entirely. The trend isn't linear.
Where Your Cycle Time Actually Goes
Stop trying to shorten the whole cycle. Diagnose which stage is broken.
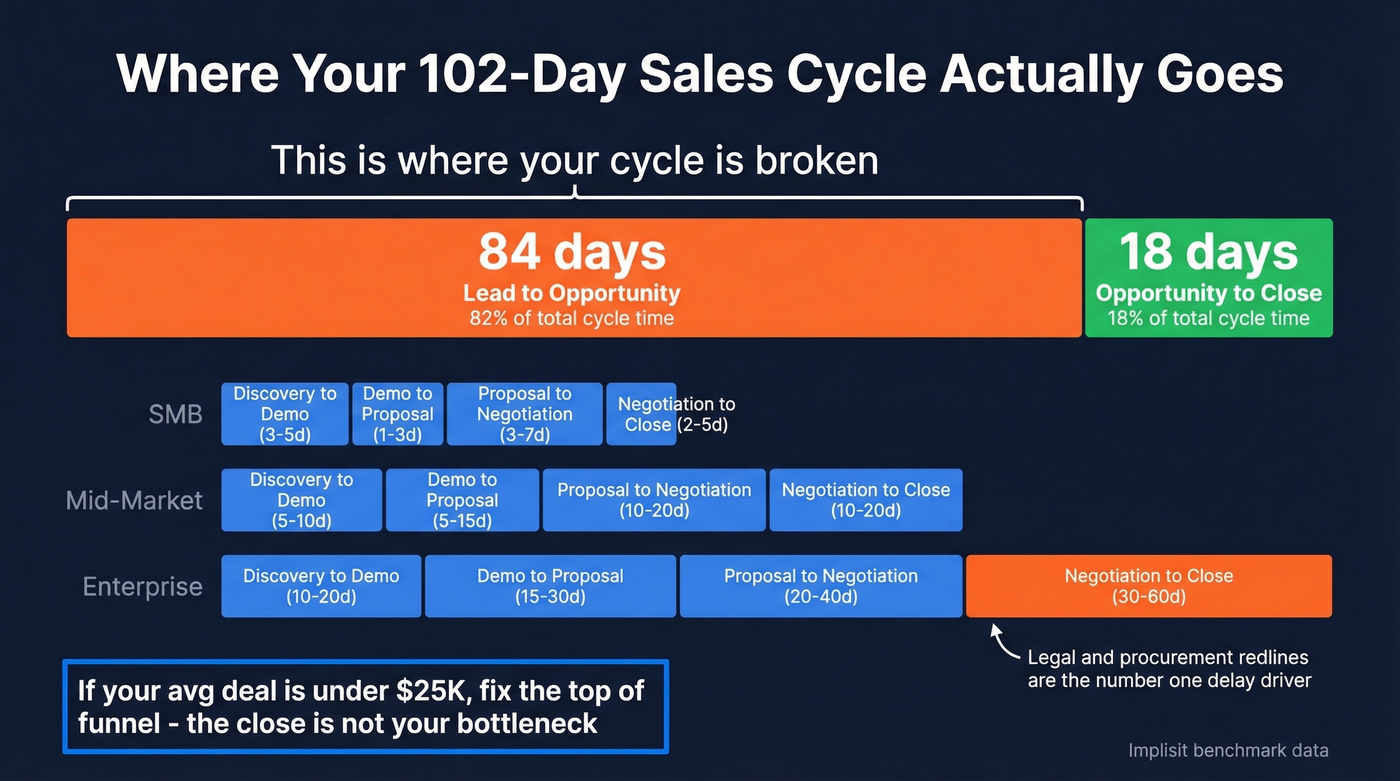
An Implisit benchmark found that Lead-to-Opportunity takes 84 days and Opportunity-to-Close takes just 18 days. Total: 102 days. That means 82% of cycle time is top-of-funnel - prospecting, qualifying, and getting to a real opportunity.
The stage breakdown shifts dramatically by segment:
| Stage | SMB | Mid-Market | Enterprise |
|---|---|---|---|
| Discovery to Demo | 3-5 days | 5-10 days | 10-20 days |
| Demo to Proposal | 1-3 days | 5-15 days | 15-30 days |
| Proposal to Negotiation | 3-7 days | 10-20 days | 20-40 days |
| Negotiation to Close | 2-5 days | 10-20 days | 30-60 days |
In enterprise deals, negotiation-to-close alone accounts for 35-40% of total cycle time - legal and procurement redlines are the number-one delay driver. For SMB teams, the leverage is overwhelmingly in the top of funnel. Different problems, different fixes.
If your average deal is under $25K, you should spend zero time optimizing your close process and 100% of your energy on getting to the first meeting faster. The close isn't your bottleneck - reaching the right person is.
How to Shorten Your Sales Cycle
Every tactic below has a quantified impact range based on CRM timestamp analysis across 939 deals.
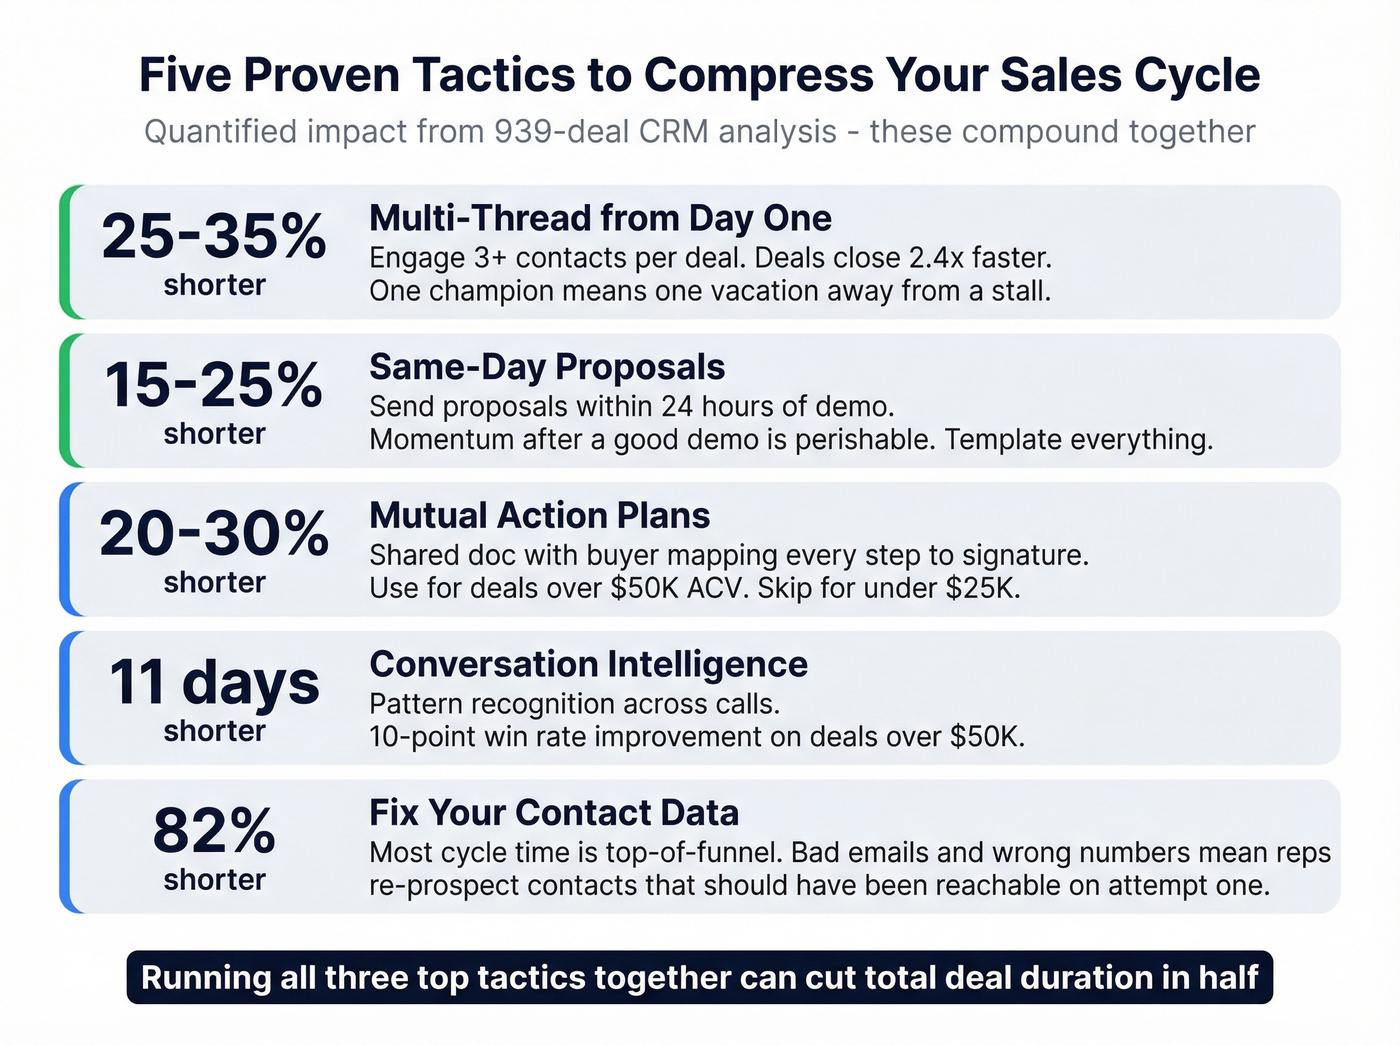
Multi-Thread from Day One
Deals with 3+ contacts engaged close 2.4x faster. Impact: 25-35% shorter cycles. This is the single highest-leverage tactic available. When you're single-threaded to one champion, you're one vacation or job change away from a stalled deal. Multi-threading builds consensus in parallel instead of sequentially, and it forces you to map the buying committee early rather than discovering stakeholders at the eleventh hour when they torpedo the deal.
Same-Day Proposals
Proposals sent within 24 hours of demo close 35% faster. Impact: 15-25% shorter cycles. The momentum after a good demo is perishable. Every day you wait, the buyer's attention drifts. We've watched teams cut a full week off their cycle just by templating proposals and having pricing pre-approved.
Mutual Action Plans
Impact: 20-30% shorter cycles. For every deal over $50K ACV, create a shared document with the buyer mapping every step from demo to signature - including their internal approvals, security review, and legal timeline. It forces the buyer to confront their own process and gives you visibility into where things will stall. Skip this for deals under $25K. The overhead isn't worth it at that price point.
Conversation Intelligence
Teams using conversation intelligence close deals 11 days faster on average, with a 10-point improvement in win rates on deals over $50K. The value isn't the recording - it's the pattern recognition. When you can see that deals stall after the third call because reps aren't addressing procurement concerns, you fix the talk track once and every deal benefits (pair this with better talk track examples).
Fix Your Contact Data
Look, 82% of cycle time is top-of-funnel. Bounced emails and wrong phone numbers mean reps are re-prospecting and re-qualifying contacts that should've been reachable on the first attempt. Every bad email adds days to every deal before it even becomes an opportunity.

Snyk's 50-person AE team was dealing with 35-40% bounce rates. After switching to Prospeo, bounces dropped below 5%, AE-sourced pipeline grew 180%, and they were generating 200+ new opportunities per month. That's not a marginal improvement - it's a structural compression of the prospecting stage that shaved weeks off their effective deal timeline (see email bounce rate benchmarks and fixes).
Pre-Wire Procurement and Legal
Security questionnaires add 2-4 weeks to enterprise deals. Don't wait until negotiation to discover this. Send your security packet, SOC 2 report, and standard DPA proactively after the second call. When the buyer's security team has already reviewed your materials before the deal hits procurement, you skip the queue.
Outbound cycles run 2-3x longer than inbound because trust starts at zero. Prospeo's intent data tracks 15,000 topics so you reach buyers already researching your category - turning cold outbound into warm conversations that close like referrals.
Reach buyers while they're actively in-market. Cut weeks off every deal.
Sales Cycle Length and Pipeline Velocity
This metric doesn't exist in isolation. It's one of four inputs to pipeline velocity - the metric that tells you how much revenue your pipeline generates per day.
Pipeline Velocity = (Opportunities x Avg Deal Size x Win Rate) / Sales Cycle Length
Worked example: 100 qualified opportunities x $10,000 average deal x 20% win rate / 90-day cycle = $2,222/day, roughly $67K/month. SaaS pipeline velocity benchmarks range from $743 to $2,456/day depending on segment.
The key insight is mathematical. Cutting your cycle in half has the exact same revenue impact as doubling your win rate. Most teams obsess over win rate and ignore deal duration. That's backwards - cycle compression is often easier to achieve and the impact applies to every deal in the pipeline simultaneously (tie this into your sales operations metrics dashboard).
FAQ
What's a good sales cycle length?
For SMB deals under $15K ACV, target 14-30 days. Mid-market ($15K-$50K) should close in 30-60 days. Enterprise deals over $100K typically run 90-180 days. Always benchmark against your ACV segment and industry, not a blended B2B average.
How do you calculate sales cycle length?
Sum the total days from first contact to closed-won for all deals in a period, then divide by the number of closed deals. Use the median instead of the mean to avoid skew from outlier deals. Report P25 and P75 alongside the median for a complete picture.
Why are B2B sales cycles getting longer?
Buying committees have expanded to 6.8 stakeholders on average, security reviews add 2-4 weeks, and reps spend only 28-30% of their time selling. Deal timelines are up 22% since 2022, though economic pressure has shortened them in some segments.
What's the fastest way to shorten a sales cycle?
Multi-threading - engaging 3+ contacts from day one - cuts cycle time by 25-35%. Combine it with same-day proposals and mutual action plans for compounding impact. These three tactics together can halve a typical deal timeline.
How does bad contact data affect deal timelines?
Bounced emails and wrong numbers waste the prospecting and qualification stages, which account for 82% of total cycle time. Verified data ensures outreach reaches prospects on the first attempt instead of adding days of re-prospecting to every deal.