Sales Data Analysis: The Benchmarks and Frameworks Nobody Else Gives You
It's Monday morning. You're staring at a pipeline review deck that says you've got $2.1M in open opportunities. The VP asks: "Are we going to hit the number?" You don't actually know - because your "analysis" is a filtered Salesforce view someone built six months ago.
Teams that track sales data ad-hoc hit 52% forecast accuracy and 11% revenue growth. Teams that do rigorous sales data analysis hit 87% and 34%, respectively. The difference isn't talent. It's discipline.
What You Need (Quick Version)
- Five metrics that matter most: pipeline velocity, win rate, sales cycle length, MQL-to-SQL conversion (benchmark: 15%), and CAC payback period. If you're only tracking revenue, you're flying blind.
- Weekly tracking cadence: teams reviewing pipeline data weekly see 34% revenue growth vs. 11% for ad-hoc trackers. That's not a marginal improvement - it's a different trajectory.
What Is Sales Data Analysis?
Sales data analysis is the practice of collecting, cleaning, and interpreting data from your sales process to make better decisions. That's the textbook answer. The practical answer: it's how you stop guessing and start knowing why deals close, stall, or die.
There are four types, and most teams never get past the first one. Descriptive tells you what happened - last quarter's revenue. Diagnostic explains why - conversion dropped at the demo stage. Predictive forecasts what's coming - pipeline-weighted revenue for Q3. Prescriptive recommends action - shift reps from Territory A to Territory B based on win-rate data. The jump from descriptive to diagnostic is where 80% of teams stall. They have the dashboards but never ask the second question.
Organizations that adopt data-driven sales transformation see a 5-10% revenue lift. That's meaningful, but only if the underlying data is clean enough to trust.
Why Sales Analytics Matters
Sellers who partner with AI sales tools are 3.7x more likely to meet quota. But AI is only the accelerant - the fuel is clean, structured sales data. Without it, you're feeding garbage into a very expensive machine.
The tracking frequency correlation is striking. Teams that review pipeline data weekly achieve 34% revenue growth and 87% forecast accuracy. Ad-hoc trackers? 11% growth and 52% accuracy. Same reps, same market - different analytical discipline.
Reps currently spend just 28% of their time actually selling. The rest goes to admin, CRM updates, and internal meetings. Rigorous analysis doesn't just improve forecasting - it tells you where reps are wasting time so you can give them hours back.
Metrics That Actually Matter
Your team closed 18% last quarter. Is that good? You can't answer that without context - and context comes from tracking the right metrics in the right categories.
Revenue Metrics
MRR/ARR is your baseline. Track month-over-month and year-over-year growth rates, not just the absolute number. Average deal size matters because a 5% increase in deal size compounds faster than a 5% increase in volume. Revenue growth rate - current period revenue minus prior period revenue, divided by prior period revenue - is the metric your board cares about most.
Pipeline Metrics
This is where you find the most actionable insights. Pipeline velocity is the single most diagnostic metric in B2B sales:
Pipeline Velocity = (# of Opportunities x Average Deal Value x Win Rate) / Sales Cycle Length
It tells you how much revenue moves through your pipeline per day. We've benchmarked this by industry and company size in the next section.
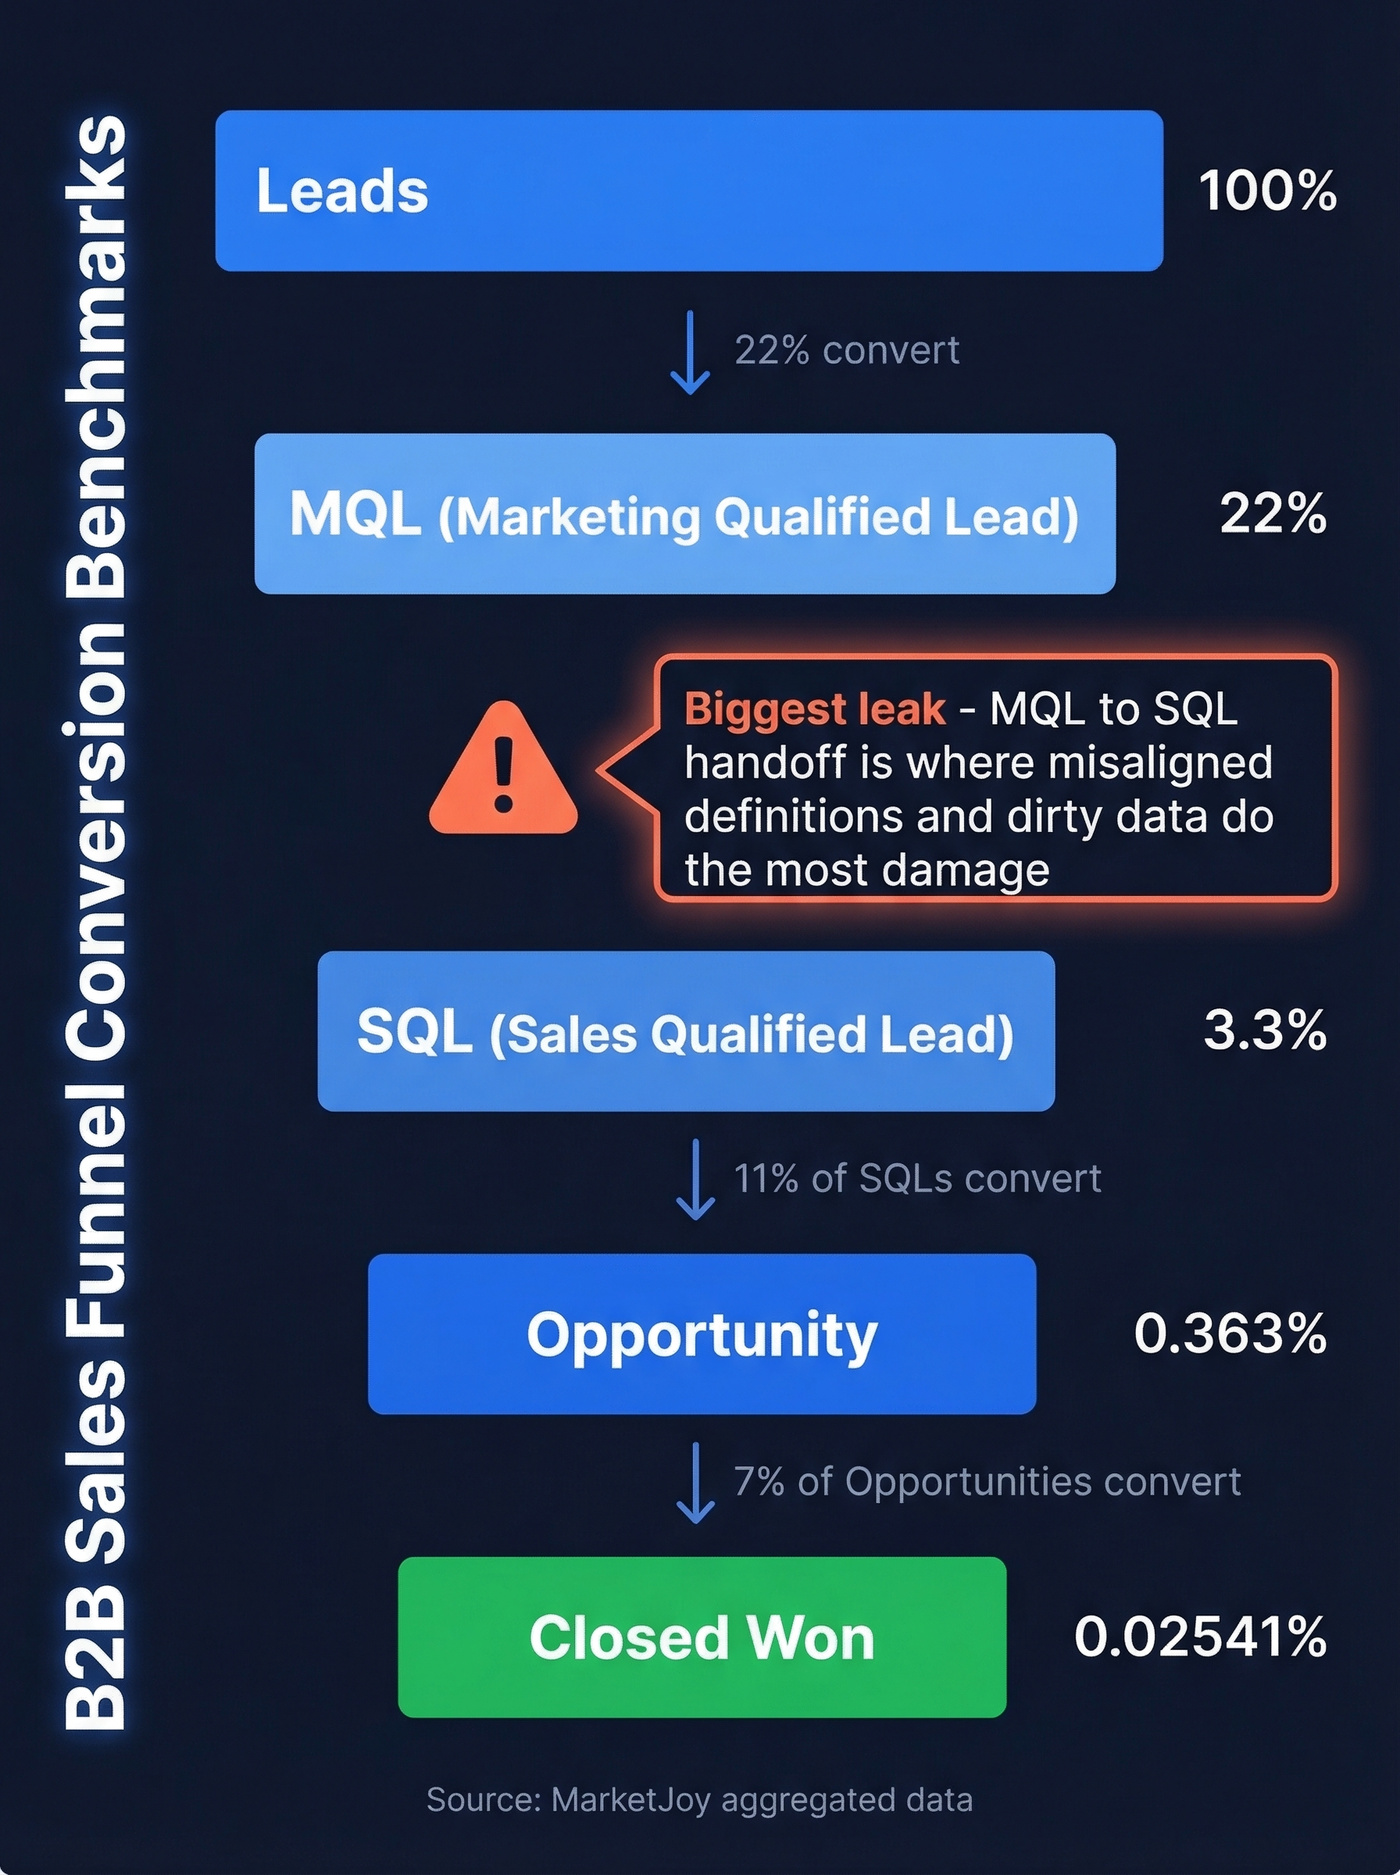
Funnel conversion rates are where you find the leaks. MarketJoy's aggregated data gives us stage-by-stage benchmarks:
- Lead to MQL: 22%
- MQL to SQL: 15%
- SQL to Opportunity: 11%
- Opportunity to Closed-Won: 7%
The biggest drop-off happens at MQL to SQL. In our experience, that handoff between marketing and sales is where misaligned definitions and dirty data do the most damage. Ask any sales ops manager on r/salesops about their MQL-to-SQL handoff and you'll get horror stories about phantom pipeline and leads that were never qualified in the first place.
Activity Metrics
Calls made, emails sent, meetings booked, touches per opportunity - these are leading indicators that tell you what's happening before the revenue shows up. 80% of deals require five or more touches, yet 44% of reps give up after one. Activity data exposes that gap fast.
If you need a clean starting point, use these sales activities as your baseline set.
Customer Metrics
CAC equals total sales and marketing spend divided by new customers acquired. CLV equals average revenue per customer times average customer lifespan. The CLV:CAC ratio should be at least 3:1. Below that, you're spending more to acquire customers than they're worth.
Churn rate is the silent killer. Even 2% monthly churn compounds to 22% annual loss.
Benchmarks - What Good Looks Like
You've read five articles that say "track your KPIs" without telling you what a good KPI number actually is. Let's fix that.
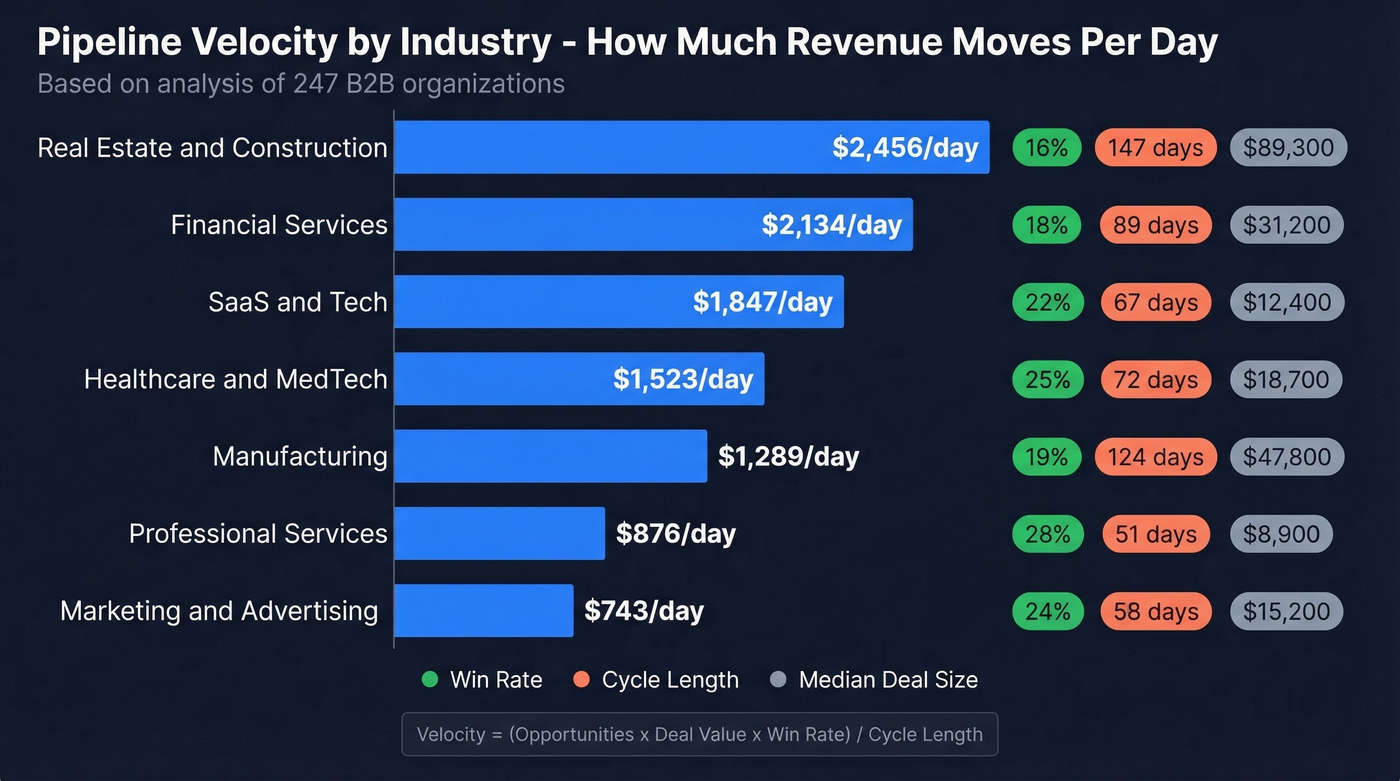
Pipeline Velocity by Industry
This data comes from a First Page Sage analysis of 247 B2B organizations:
| Industry | Median Deal | Win Rate | Cycle (Days) | Velocity/Day |
|---|---|---|---|---|
| SaaS & Tech | $12,400 | 22% | 67 | $1,847 |
| Financial Services | $31,200 | 18% | 89 | $2,134 |
| Healthcare/MedTech | $18,700 | 25% | 72 | $1,523 |
| Manufacturing | $47,800 | 19% | 124 | $1,289 |
| Professional Svcs | $8,900 | 28% | 51 | $876 |
| Real Estate/Constr. | $89,300 | 16% | 147 | $2,456 |
| Marketing/Advertising | $15,200 | 24% | 58 | $743 |
Professional services wins on win rate (28%) and cycle speed (51 days) but has the lowest velocity because deal sizes are smaller. Manufacturing has the opposite profile - big deals, long cycles, middling win rates. Your industry context matters enormously when you're evaluating whether your own numbers are healthy or a five-alarm fire.
If you want more context beyond velocity, use these sales pipeline benchmarks to sanity-check stage-by-stage performance.
Pipeline Velocity by Company Size
| Company Revenue | Win Rate | Cycle (Days) | Velocity/Day |
|---|---|---|---|
| $1M-$5M | 26% | 43 | $687 |
| $5M-$25M | 23% | 61 | $1,303 |
| $25M-$100M | 21% | 78 | $3,484 |
| $100M-$500M | 19% | 95 | $6,919 |
| $500M+ | 17% | 118 | $12,945 |
Smaller companies close faster with higher win rates but lower absolute velocity. As companies scale, cycles lengthen, win rates compress, and velocity grows through deal size alone. If you're a $10M company with a 95-day cycle, something's broken.

Outbound Performance
Here's the thing about outbound: speed kills - in a good way.
Opportunities closed within 50 days carry a 47% win rate. After 50 days, that drops to roughly 20%. Your analysis cadence should flag aging opportunities before they cross that line.
For outbound-specific numbers, cold email reply rates run 1-5%, with 0.2-2% converting to closed deals. Cold calling success averages 2.3%. Multichannel outreach - email, phone, and social combined - increases response rates by 287% versus single-channel. The recommended pipeline-to-quota coverage ratio is 3:1.
If you're building outbound from scratch, start with these sales prospecting techniques and then measure what actually moves reply rate and meetings booked.
Contacting leads within 24 hours increases conversion by 5x. Speed-to-lead isn't a nice-to-have. It's the single highest-ROI operational change most teams can make.
Dirty data is why your MQL-to-SQL conversion sits below 15% and your pipeline velocity stalls. Prospeo's 5-step verification delivers 98% email accuracy and refreshes every 7 days - so every metric you track reflects reality, not phantom pipeline.
Fix the data and every downstream metric improves automatically.
How to Analyze Sales Data in 5 Steps
1. Define Your Questions First
Don't start with a dashboard. Start with a question. "Why did Q2 pipeline drop 18% versus Q1?" is an analytical question. "Show me a pipeline chart" is decoration. Every analysis session should begin with a specific decision you're trying to make or a specific anomaly you're trying to explain.
If you need a framework for what to ask in reviews, borrow from this QBR questions list and adapt it to weekly pipeline.
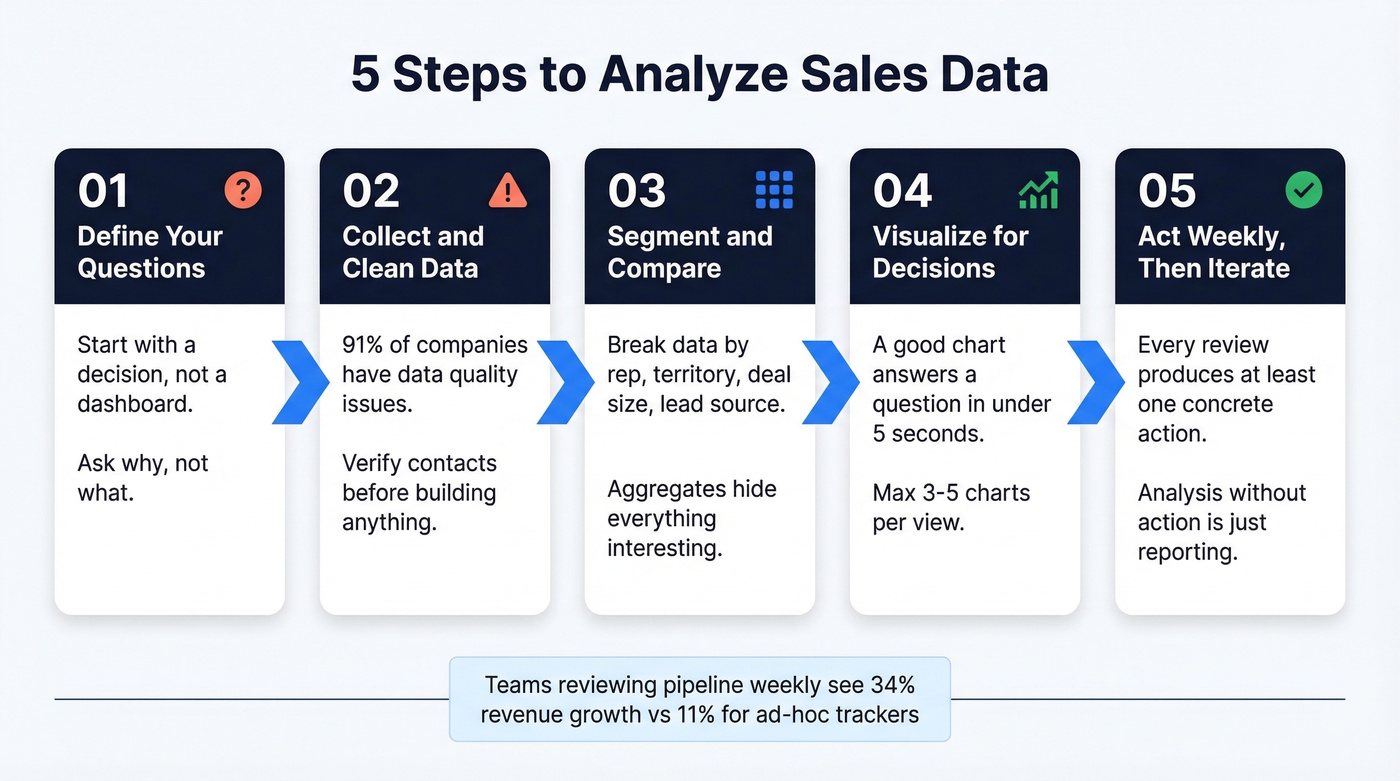
2. Collect and Clean Your Data
This is where most teams fail before they even begin. 91% of companies have data quality issues that affect their analytics. Duplicate records, outdated emails, wrong titles, dead phone numbers - all of it corrupts every metric downstream.
Before you build anything, run your contact database through a verification pass. We've found that teams who clean their data before building dashboards save themselves weeks of backtracking when the numbers don't add up.
If you're evaluating vendors, compare data enrichment services and your verification workflow before you touch BI.
3. Segment and Compare
Raw aggregates hide everything interesting. Segment your data by rep, territory, deal size, lead source, industry vertical, and product line. Then compare.
"Our overall win rate is 21%" is useless. "Win rate for enterprise deals sourced from events is 34%, versus 12% for inbound SMB leads" - that's actionable. The segmentation is where the insight lives.
If you want segmentation that actually predicts outcomes, build a simple lead scoring model and track conversion by score band.
4. Visualize for Decisions
A good visualization answers a question in under five seconds. If someone has to study your dashboard to understand it, it's too complex.
Build around fact tables like sales transactions and returns, dimension tables for products, reps, and regions, and a calendar table that extends five years beyond your last actual date so forecast periods render correctly. Three to five charts per view, max. More than that and nobody looks at any of them.
5. Act Weekly - Then Iterate
Every pipeline review should produce at least one concrete action. "Move these 12 deals to closed-lost because they've been stale for 60+ days." "Shift two reps to Territory B where win rates are 8 points higher." "Increase demo-to-proposal follow-up cadence from 5 days to 2."
Analysis without action is just reporting with extra steps.
If your follow-up is inconsistent, standardize it with these sales follow-up templates so your activity metrics reflect a real process.
Analysis Cadence That Drives Revenue
The data on tracking frequency is unambiguous:
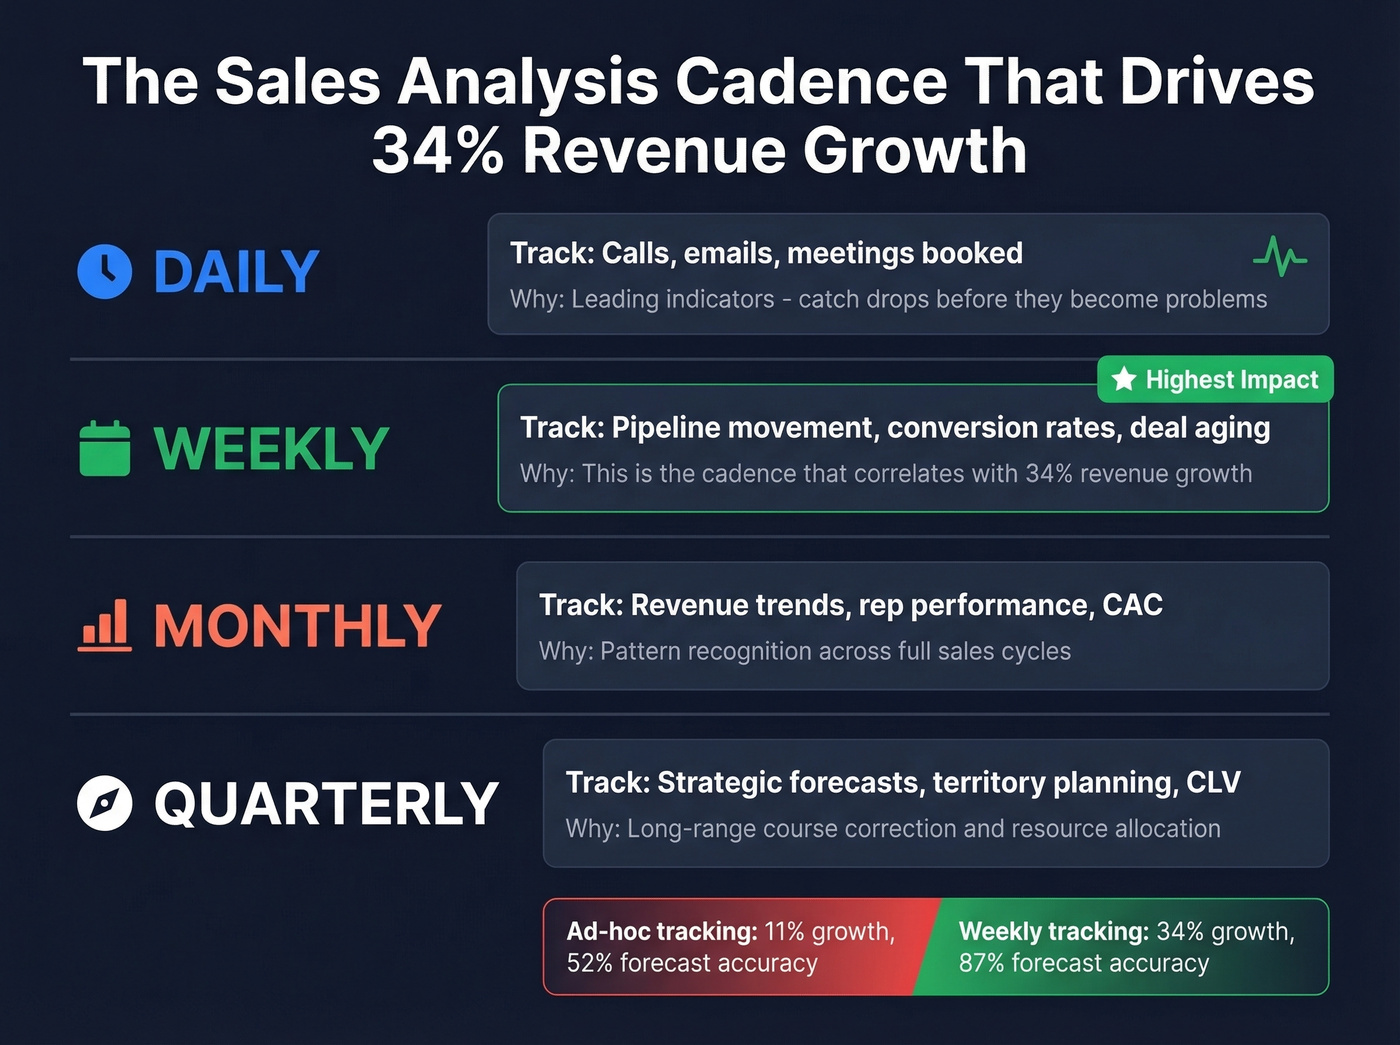
| Cadence | What to Track | Why |
|---|---|---|
| Daily | Activity metrics: calls, emails, meetings | Leading indicators; catch drops fast |
| Weekly | Pipeline movement, conversion rates, deal aging | 34% revenue growth correlation |
| Monthly | Revenue trends, rep performance, CAC | Pattern recognition across cycles |
| Quarterly | Strategic forecasting, territory planning, CLV | Long-range course correction |
We've seen teams dramatically improve forecast accuracy just by moving from monthly to weekly reviews. The gap between 87% and 52% forecast accuracy justifies building a weekly 30-minute pipeline review into your operating rhythm. Stop building more dashboards. Start acting on the three you have.
If forecasting is still a mess, you may need dedicated sales forecasting solutions rather than more reports.
Seven Mistakes That Wreck Your Numbers
Using spreadsheets as your system of record. Over 70% of small businesses still track sales in spreadsheets or notebooks. It works until it doesn't - and "doesn't" usually means a formula error that overstates pipeline by $500K. If your average contract value is modest and your team is under five reps, a spreadsheet is fine. Everyone else needs a real CRM.
If you're still deciding what "real CRM" means, start with these examples of a CRM and pick based on your reporting needs.
Letting CRM data rot. CRM data decays faster than most teams realize. Bad emails, outdated titles, people who changed jobs six months ago - all of it corrupts your metrics. One customer, Meritt, saw bounce rates drop from 35% to under 4% after switching their contact verification to Prospeo, with pipeline tripling from $100K to $300K per week. That's the difference between analyzing reality and analyzing fiction.
Tracking too many metrics without acting on any. If your dashboard has 30 KPIs, you have zero KPIs. Pick five. Act on them weekly. Add more only when you've mastered those five.
Ignoring returns and refunds. If your revenue analysis doesn't net out returns, you're overstating performance. Simple as that.
Inconsistent data entry. "Acme Corp," "ACME," "Acme Corporation" - three records for one company. Duplicate accounts destroy segmentation and inflate pipeline counts.
Using the wrong tools for your scale. A 5-rep team doesn't need Clari. A 200-rep org can't run on spreadsheets. Match the tool to the team size and analytical maturity.
Having no benchmarks to compare against. "We closed 22% this quarter" means nothing without context. Use the industry and company-size benchmarks above to calibrate whether your numbers are strong, average, or a problem.
Reps spend 72% of their time not selling. Prospeo's 30+ search filters - intent data, technographics, job changes, headcount growth - let you build pipeline-ready lists in minutes, not hours. That's how teams hit 34% revenue growth instead of 11%.
Give your reps hours back and your pipeline the accuracy it deserves.
Best Tools for 2026
73% of sales organizations still struggle to extract meaningful insights from their data fast enough to impact deal outcomes. The right tool stack closes that gap. Here's what's worth your budget this year.
| Tool | Category | Starting Price | Best For |
|---|---|---|---|
| Prospeo | Data Quality | Free; ~$0.01/email | CRM data accuracy |
| Salesforce | CRM Analytics | Custom pricing | Enterprise reporting + forecasting |
| HubSpot | CRM Analytics | Free CRM; paid tiers vary | SMB to mid-market |
| Pipedrive | CRM Analytics | ~$14/user/mo | Small sales teams |
| Power BI | BI Platform | Low-cost per user | Cost-effective visualization |
| Tableau | BI Platform | ~$75/user/mo | Advanced analytics |
| Gong | Revenue Intel | Typically $100+/user/mo | Conversation insights |
| Clari | Revenue Intel | ~$30-50K/yr | Forecasting at scale |
CRM-Native Analytics
Salesforce Einstein, HubSpot's reporting suite, and Pipedrive Insights all offer built-in analytics that cover 80% of what most teams need. Salesforce is the deepest but most complex. HubSpot is the easiest to get running - their free CRM includes basic reporting that's genuinely useful for teams just getting started with structured sales data analysis. Pipedrive at ~$14/user/month is the budget pick for teams under 20 reps.
BI Platforms
When CRM-native reporting isn't enough, Power BI and Tableau let you build custom dashboards pulling from multiple data sources. Power BI wins on price and Microsoft ecosystem integration. Tableau wins on visualization flexibility and handles complex datasets more gracefully. Looker is a third option for teams already deep in the Google ecosystem.
Revenue Intelligence
Gong and Clari analyze conversations and pipeline signals to surface risks your CRM can't see. Gong is the standard for conversation intelligence - it records calls, flags deal risks, and gives managers coaching data they'd never get from CRM fields alone. Clari is the forecasting layer for teams with 50+ reps who need pipeline inspection at scale.
Let's be honest though: most teams under $5M ARR don't need revenue intelligence tools. A well-maintained CRM, a BI layer, and clean underlying data will get you 90% of the way there at a tenth of the cost. Skip the Gong budget until your team is big enough that you can't personally listen to every deal call.
AI and Sales Analytics in 2026
94% of sales leaders with AI agents say they're essential for meeting business demands. 88% of reps with AI agents say it increases their odds of hitting targets. Since 2024, sales data analysis has shifted from manual spreadsheet work to AI-assisted workflows - and the pace of that shift is only accelerating.
But here's the uncomfortable truth: reps still spend 60% of their time on non-selling tasks, and 84% of data leaders acknowledge that AI outputs are only as good as the inputs. Sales leaders estimate 19% of their company data is completely inaccessible, and 70% say their most valuable insights are locked in unstructured formats like call recordings and email threads.
The teams getting real value from AI in sales analytics solved data quality first. 74% of sales teams using AI prioritize data hygiene as a prerequisite - not an afterthought. AI won't fix a CRM full of bad emails and outdated titles. It'll just give you confident-sounding forecasts built on fiction. Clean the data first. Then let the models do their work.
FAQ
What's the difference between sales analytics and sales reporting?
Reporting shows what happened - it's descriptive. Analytics explains why it happened, predicts what's coming, and recommends action. Reports are the raw input; analysis is the decision-ready output. If your "analytics" is just a dashboard no one acts on, you're doing reporting with extra steps.
How often should I review sales data?
Weekly for pipeline metrics and conversion rates, monthly for revenue trends and rep performance, quarterly for strategic forecasting. Teams that track weekly see 34% revenue growth versus 11% for ad-hoc reviewers - cadence matters as much as the metrics themselves.
What tools do I need to start?
At minimum: a CRM (HubSpot's free tier works), a data quality tool to keep contacts accurate, and a BI layer for visualization. Most mid-market teams can start for under $25/user/month total. Add revenue intelligence tools once you've outgrown CRM-native reporting.