Sales Forecast Examples You Can Actually Copy - By Business Model (2026)
It's the last week of Q2. Your VP of Sales swears the number's going to land. The CRM says $2.1M in pipeline. Finance already built the board deck around it. Then the quarter closes at $1.6M, and everyone spends the first week of Q3 explaining what happened.
You're not alone. Four in five sales and finance leaders missed a quarterly forecast in the past year, according to a 400-person Xactly survey. One RevOps leader on r/salestechniques described getting "burned" by forecasts that "looked solid on paper" but ended "way off the mark once the quarter closed."
The problem isn't that teams don't forecast. It's that they forecast with the wrong method for their business model - or the right method fed by terrible data. Only 7% of sales organizations achieve 90%+ forecast accuracy. The median sits at 70-79%. That's a lot of missed quarters.
Here's our take after watching dozens of teams struggle with this: a simple weighted pipeline model with clean contacts will outperform a complex regression built on stale CRM records every single time. The method matters less than the data feeding it.
Pick the Model That Matches How You Sell
Don't reach for the most impressive-looking model. Reach for the one that fits your sales motion:
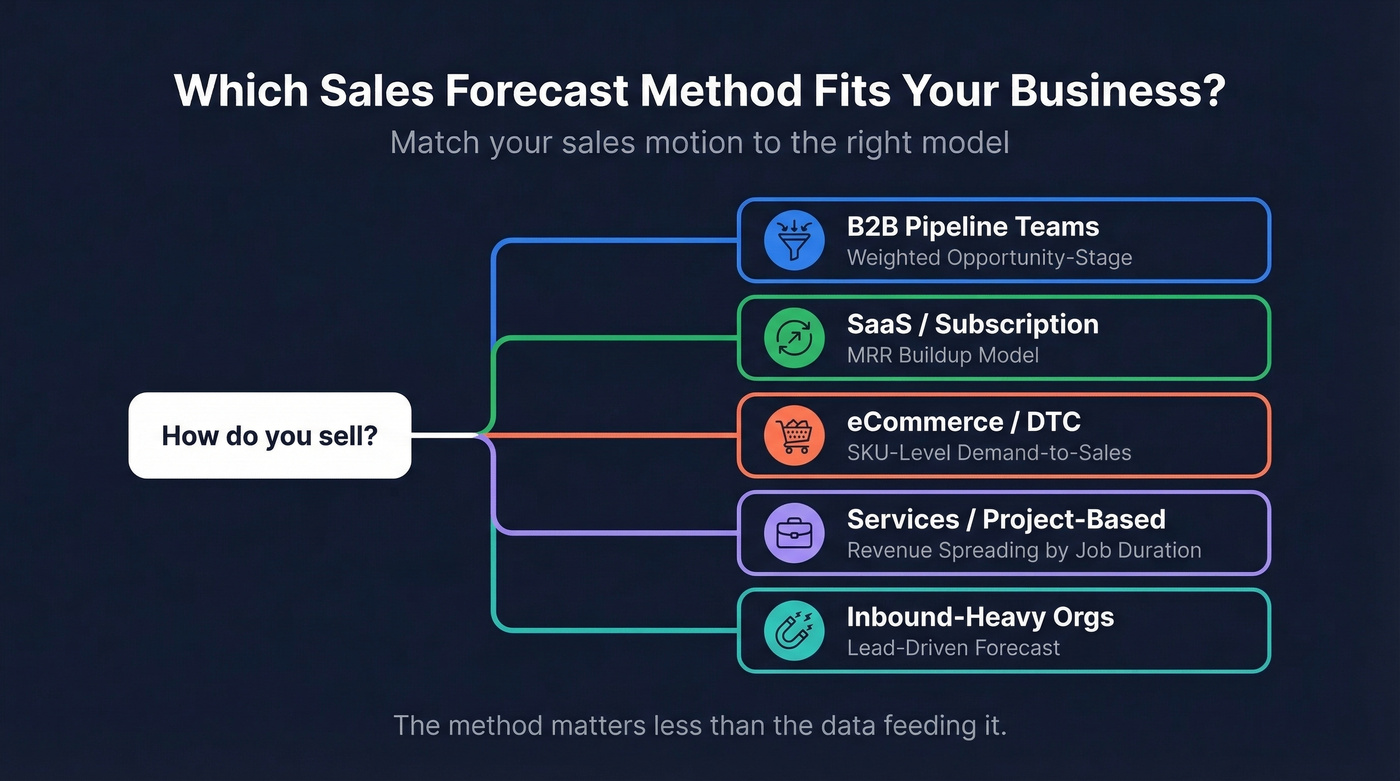
- B2B pipeline teams - Weighted opportunity-stage forecast. Assign probabilities by deal stage, multiply, sum.
- SaaS - MRR buildup model with churn and expansion. Stop forcing pipeline templates onto recurring revenue.
- eCommerce - SKU-level demand-to-sales model. Category averages will mislead you.
- Services / project-based - Revenue spreading across job duration. Most templates lump revenue into the close month. That's wrong for any job lasting more than 30 days.
- Inbound-heavy orgs - Lead-driven forecast. Multiply monthly leads by conversion rate and average deal size.
Forecasting Methods at a Glance
| Method | Complexity | Accuracy Range | Best For |
|---|---|---|---|
| Weighted pipeline | Low | 70-85% | B2B with defined stages |
| Historical trend | Low | 65-80% | Stable, mature markets |
| Exponential smoothing | Medium | 75-85% | Seasonal businesses |
| Bottom-up | Medium | 70-80% | New businesses, SMBs |
| Top-down | Low | 60-75% | Market-sizing, board decks |
| Regression | High | 75-90% | Multi-variable environments |
| MRR buildup | Medium | 75-85% | SaaS / subscription |
| Lead-driven | Medium | 70-80% | Inbound-heavy orgs |
Complexity here means how much data and Excel skill you need. Accuracy ranges are directional - your results depend entirely on data quality and how well the method fits your sales motion.
Sales Forecast Examples by Business Model
B2B Pipeline Forecast (Weighted Opportunity-Stage)
This is the workhorse for any B2B team with a CRM and a defined sales process. Every deal in your pipeline gets weighted by its probability of closing based on its current stage.
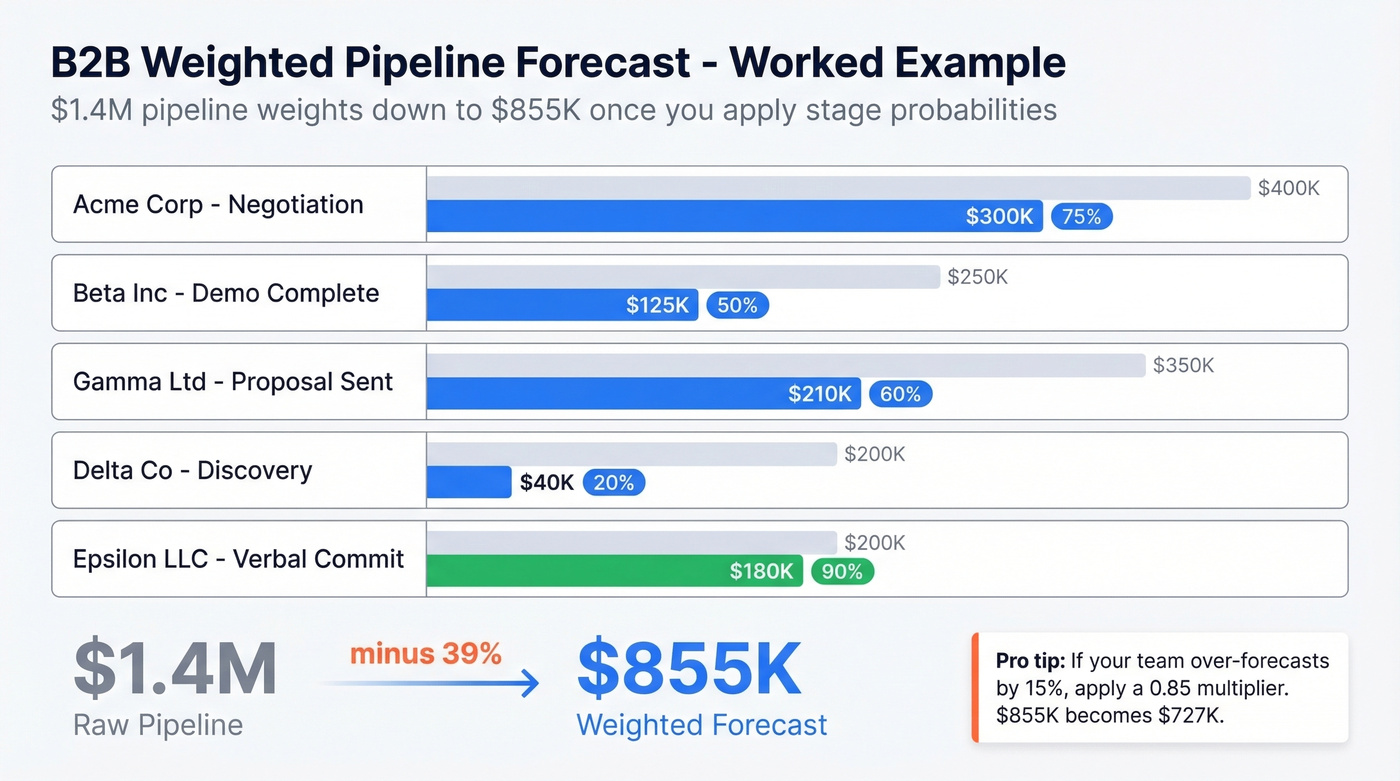
Here's a worked example. Say you're running a $1.4M pipeline heading into Q3:
| Opportunity | Stage | Amount | Probability | Weighted |
|---|---|---|---|---|
| Acme Corp | Negotiation | $400K | 75% | $300K |
| Beta Inc | Demo Complete | $250K | 50% | $125K |
| Gamma Ltd | Proposal Sent | $350K | 60% | $210K |
| Delta Co | Discovery | $200K | 20% | $40K |
| Epsilon LLC | Verbal Commit | $200K | 90% | $180K |
| Total | $1.4M | $855K |
Your $1.4M pipeline weights down to $855K once you account for stage-based close rates. That's a much more honest number to give finance.
The spreadsheet structure you need: Opportunity Name, Sales Phase, Sales Rep, Sales Region, Probability %, Projected Close Month, and Weighted Forecast Amount. Those seven columns are the minimum.
The calibration factor most teams skip. If your team consistently over-forecasts by 15%, apply a 0.85 multiplier to your weighted total. In the example above, $855K x 0.85 = roughly $727K. Track this multiplier quarterly and adjust. We've seen teams improve forecast accuracy by 10+ percentage points just by adding this single correction - no new tools, no new process, just honest math applied to historical bias.
Here's the thing: the critical mistake teams make is letting reps self-assign probabilities. A deal sitting in "Negotiation" at 90% because the rep has happy ears is a different animal than one sitting there because a redline came back from legal. Use stage-based defaults, then let managers override - not the other way around.
If you're trying to pressure-test your pipeline assumptions, start with pipeline health metrics before you change the model.
SaaS Forecast (MRR Buildup)
SaaS forecasts aren't pipeline forecasts. They're retention models. If you're jamming recurring revenue into an opportunity-stage template, you're missing the mechanics that actually drive your number: churn, expansion, and net revenue retention.
Here's a three-month MRR buildup starting at $150K MRR with 12% monthly growth and 1% gross churn:
| Month | Starting MRR | Additions | Churn (1%) | Ending MRR |
|---|---|---|---|---|
| January | $150,000 | $18,000 | -$1,500 | $166,500 |
| February | $166,500 | $19,980 | -$1,665 | $184,815 |
| March | $184,815 | $22,178 | -$1,848 | $205,145 |
Additions combine new logo MRR and expansion revenue, totaling 12% of starting MRR each month. The Stripe SaaS forecasting framework lays out the key inputs: MRR, churn rate for both customer and revenue, expansion/contraction, NRR, LTV, and CAC.
The NRR line is the one most teams underweight. If your NRR is 110%, existing customers are growing your revenue even without new logos. If it's 85%, you're on a treadmill. Build both scenarios into your model.
If churn is driving your miss, pair this with a simple churn analysis so you can separate logo churn from revenue churn.
eCommerce Forecast (SKU-Level)
eCommerce forecasting has a distinction most sales teams miss: demand forecasting and revenue forecasting aren't the same thing. Demand is what the market wants. Sales is what you can actually fulfill given inventory, pricing, and marketing spend. A demand forecast that ignores stockouts or ad budget constraints will overpredict every time.
Here's a simplified SKU-level projection for a Q4 plan:
| SKU | Units Forecast | Sell-Through Rate | Avg Price | Revenue |
|---|---|---|---|---|
| BLK-TEE-M | 4,200 | 78% | $29 | $95,004 |
| WHT-SNK-10 | 1,800 | 85% | $89 | $136,170 |
| GRY-HOOD-L | 2,500 | 62% | $59 | $91,450 |
Your forecast needs to operate at the SKU and warehouse level, not category averages. A "20% growth in apparel" forecast is useless if your bestselling SKU is out of stock in your East Coast warehouse for three weeks during the holiday rush. Key inputs beyond seasonality: supplier lead times, purchase order visibility, ROAS and CAC by channel, and velocity across each marketplace or DTC storefront.
Services & Project-Based Forecast
This is where most templates completely fail. A $10K consulting engagement that starts in March and ends in April doesn't generate $10K in one month. It gets recognized across the life of the job - roughly $5,000 in March and $5,000 in April.
The fix is revenue spreading. Build a secondary table with each month listed, then use a SUMIF approach: for each month, sum the proportional revenue from every active job where that month falls between the job's start and end dates. A thread on r/Airtable nails this problem - the poster needed exactly this logic because "every monthly sales forecast I've seen lumps all the revenue into 1 month."
The formula logic in Excel:
=SUMPRODUCT((Start<=MonthEnd)*(End>=MonthStart)*Amount*
(MIN(End,MonthEnd)-MAX(Start,MonthStart)+1)/(End-Start+1))
Not glamorous, but accurate. Skip this if your average engagement closes within a single month - you won't need the complexity.
Every forecast example above assumes one thing: your pipeline data is accurate. Stale contacts, bad emails, and outdated job titles inflate your weighted pipeline and wreck your close rates. Prospeo refreshes 300M+ profiles every 7 days - so the deals in your CRM reflect reality, not last quarter's org chart.
Stop forecasting on ghost pipeline. Start with data that's 7 days fresh.
Quantitative Methods Worth Knowing
Historical Trend Forecast
The simplest quantitative method. Take your past revenue, calculate the growth rate, project forward. Works best with 3+ years of data in a stable market.
- Year 1: $1.2M -> Year 2: $1.44M -> Growth rate: 20%
- Year 3 projection: $1.44M x 1.20 = $1.73M
Formula: Next Period = Current Period x (1 + Growth Rate)
This is a valid starting point for a board-level forecast. The danger is assuming past growth rates continue indefinitely. If you grew 20% when you had 50 customers and now have 500, that rate isn't sustainable without a fundamentally different go-to-market motion. Layer in market saturation assumptions for a more honest number.
If you need to sanity-check targets vs. reality, align this with the difference between a sales forecast vs sales goal.
Exponential Smoothing in Excel
When you need something beyond a straight trend line - especially for seasonal businesses - Exponential smoothing weights recent data more heavily than older data. Excel handles this with FORECAST.ETS.
=FORECAST.ETS(target_date, values, timeline, [seasonality], [data_completion], [aggregation])
Put your historical sales in one column and dates in another, set your target date, and choose a seasonality parameter: 12 for monthly data with annual patterns, 52 for weekly data, or 1 for auto-detect. The smoothing constant alpha ranges from 0.1 to 1 - lower values smooth aggressively for noisy data, higher values react faster to recent shifts.
One caveat worth flagging: accuracy degrades the further out you project. A 30-day ETS forecast will be meaningfully more accurate than a 180-day one. Beyond one quarter, combine ETS with qualitative pipeline intelligence.
How to Measure Forecast Accuracy
The standard metric is MAPE - Mean Absolute Percentage Error:
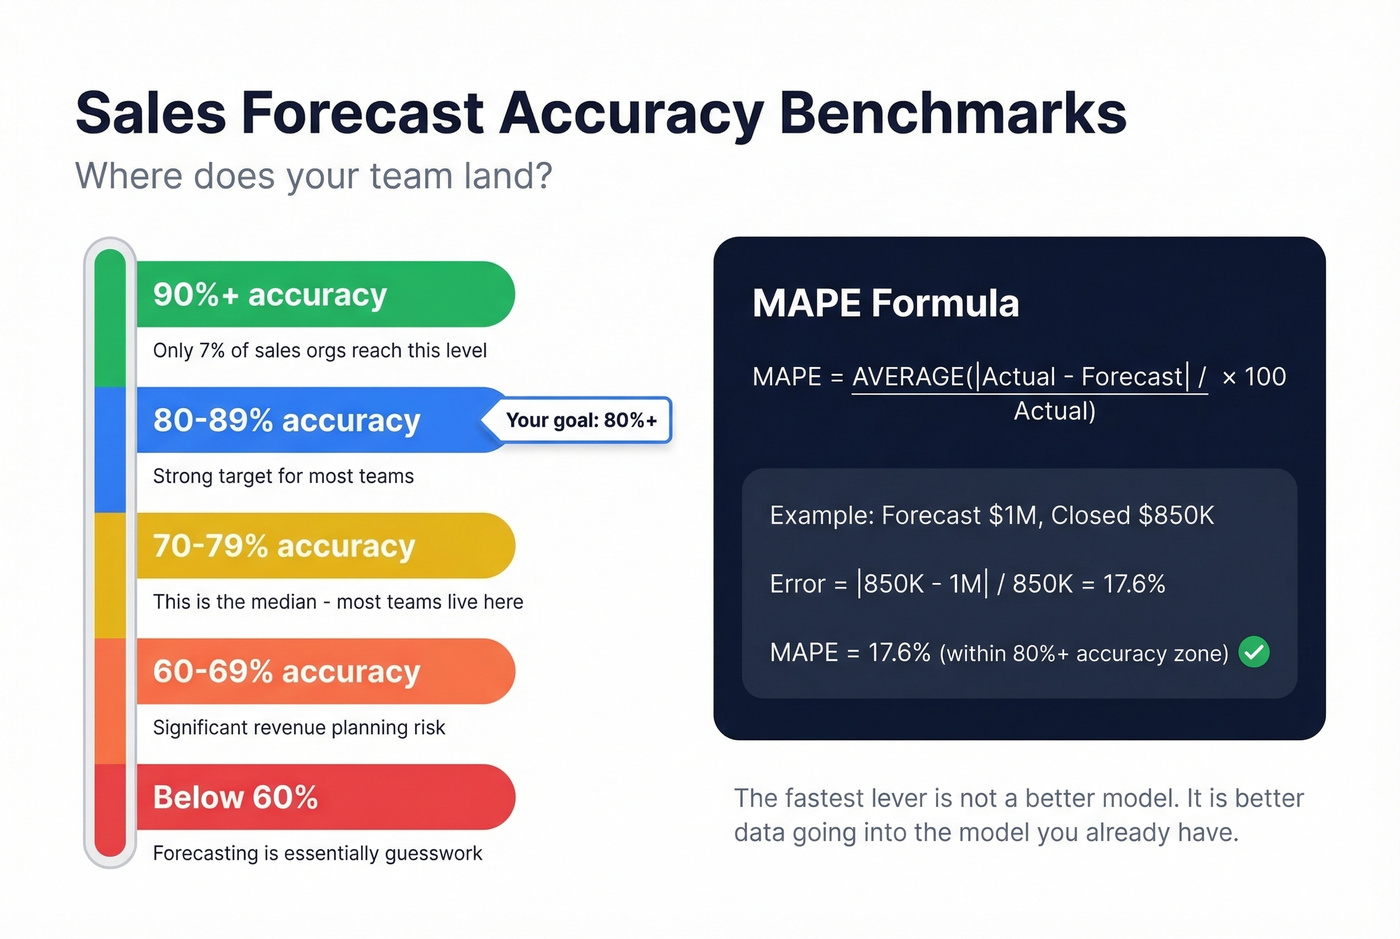
MAPE = AVERAGE(|Actual - Forecast| / Actual) x 100
If you forecasted $1M and closed $850K, your error for that period is 17.6%. Track this quarter-over-quarter and you'll see whether your process is improving or just getting lucky.
Only 7% of sales orgs hit 90%+ accuracy. The median is 70-79%. Aim for 80%+ as your initial target - MAPE under 20%. The fastest lever isn't a better model. It's better data going into the model you already have.
To make that improvement repeatable, document your sales operations metrics and review them every month.
Mistakes That Kill Forecast Accuracy
We've watched the same mistakes tank forecasts across dozens of teams. Let's break down the checklist:
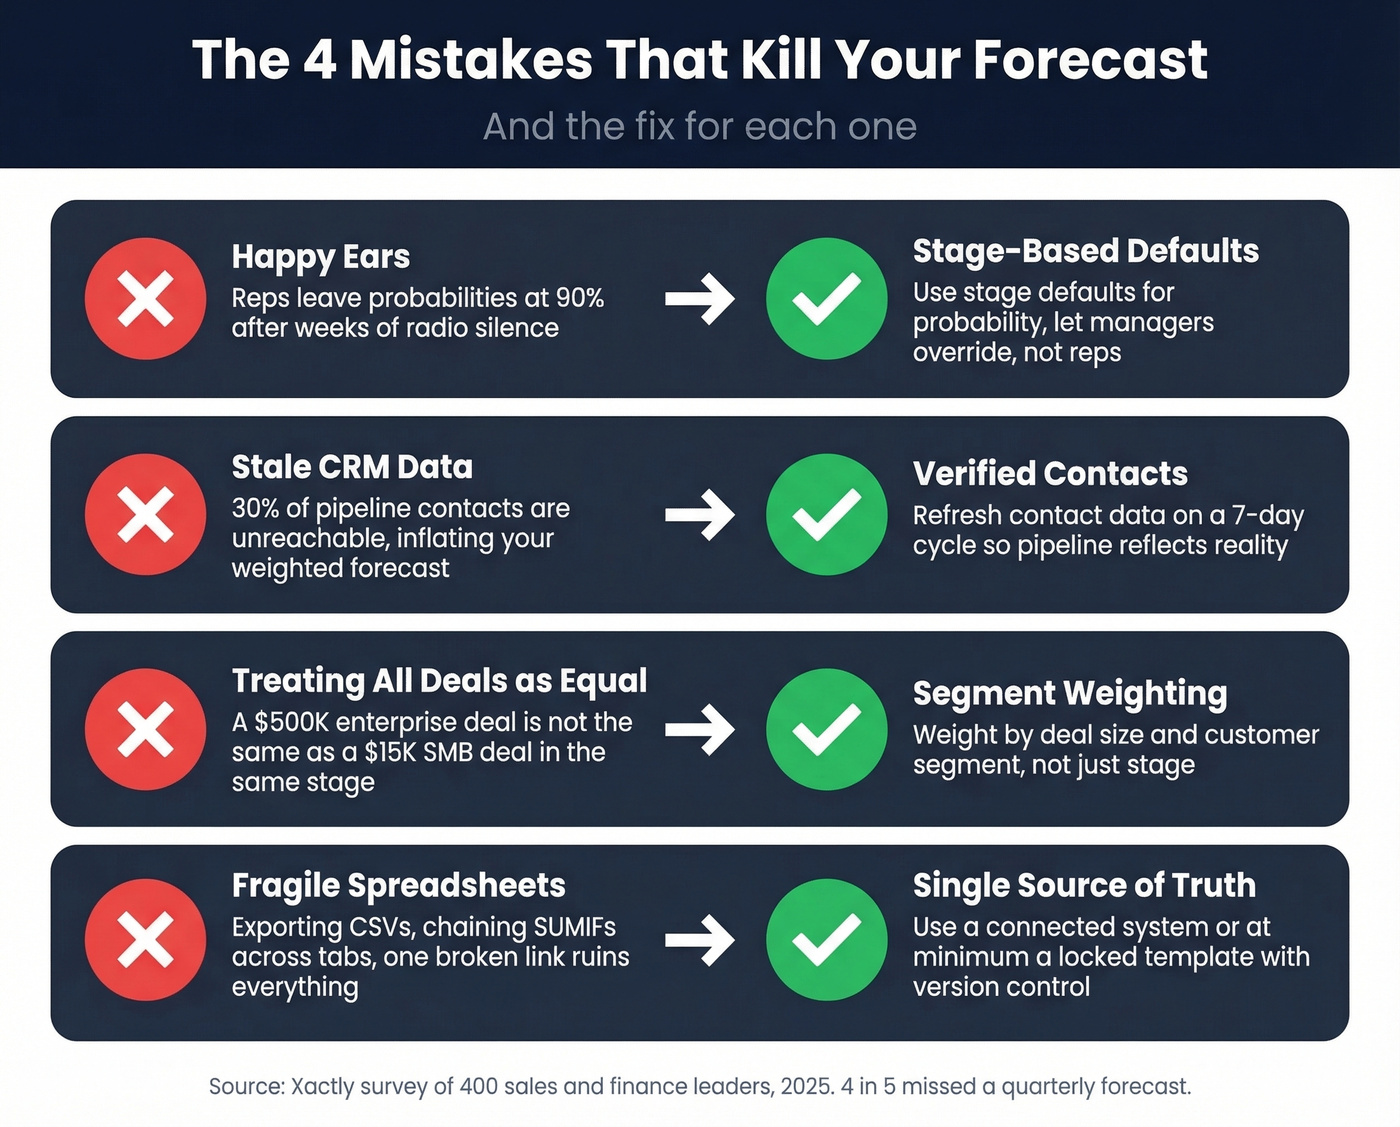
Happy ears. Reps leave probabilities at 90% after weeks of radio silence. Stage-based defaults with manager overrides fix this.
Stale CRM data. 66% of leaders cite reporting systems that can't access historical CRM/performance data as their top forecasting roadblock. When 30% of pipeline contacts are unreachable, a meaningful chunk of your weighted forecast is built on deals you can't actually close. Prospeo verifies emails at 98% accuracy on a 7-day refresh cycle, which means your weighted pipeline reflects real, reachable contacts instead of last quarter's ghost records.
If you're seeing this pattern, it usually shows up alongside other sales pipeline challenges (like stage rot and missing next steps).
Treating all deals in a stage as equal. A $500K enterprise deal in "Proposal Sent" is not the same as a $15K SMB deal in the same stage. Weight by deal size and segment.
Fragile spreadsheet pipelines. One Reddit user on r/excel described their rolling forecast workflow as "time-consuming and prone to error" - and that's the norm. If you're exporting CSVs, building pivot tables, and chaining SUMIFs across tabs, the problem isn't your model. It's your data infrastructure.
If you're rebuilding lists and fields every quarter, consider tightening your contact management software setup before you add more forecasting complexity.
Using lagging indicators only. Closed-won data tells you what happened. Activity data and pipeline velocity tell you what's about to happen.
If you want a clean way to standardize rep inputs, define a short list of sales activities examples that correlate with stage progression.
Siloing forecasting in sales. The Xactly survey found 97% of leaders agree Sales and Finance need to work better together on forecasting. That's near-unanimous for a reason.
If you’re formalizing that collaboration, a lightweight monthly cadence modeled on QBR questions to ask can keep assumptions aligned.
Not learning from wins and losses. If you aren't running a post-quarter analysis of which deals closed vs. slipped, you're repeating the same errors every cycle.
Tools & Templates
You don't need expensive software to forecast well. Here's what's worth your time:
| CRM | Starting Price | Free Tier |
|---|---|---|
| HubSpot | $15/user/mo | Yes (2 users) |
| Pipedrive | $14/user/mo | No |
| Zoho CRM | $14/user/mo | Yes (3 users) |
| Salesforce | $25/user/mo (Starter) | No |
If you're evaluating options, it helps to compare a few examples of a CRM side-by-side before you commit.
For free templates, Smartsheet offers the most complete option with Excel and Google Sheets templates for opportunity-based, SaaS, and 12-month forecasts. FitSmallBusiness has 9 free templates with worked examples across multiple models. SCORE provides a clean 12-month template designed for small businesses.
If you want to go beyond spreadsheets, start with these sales forecasting solutions and pick based on your data maturity.
For pipeline data quality, Prospeo's free tier gives you 75 email verifications per month at 98% accuracy with a 7-day refresh. Clean data in, accurate forecast out.
That $855K weighted forecast means nothing if 15% of your contacts bounce. Teams using Prospeo's 98% verified emails cut bounce rates from 35% to under 4% - and tripled pipeline. Your forecast accuracy starts with reaching real buyers at real addresses.
Hit your number by actually reaching the people in your pipeline.
FAQ
What's the simplest forecast method for a new business?
Bottom-up forecasting: estimate how many leads your team can generate, multiply by your expected conversion rate and average deal size. It's imprecise early on, but it forces realistic assumptions instead of top-down guesses that collapse on contact with reality.
How often should I update my sales forecast?
Weekly for pipeline-based forecasts, monthly for trend-based models. Rolling forecasts that auto-update as actuals come in are ideal - but only if your underlying data is current. Stale data makes frequent updates meaningless.
What's a good forecast accuracy target?
Aim for 80%+ accuracy with MAPE under 20%. Only 7% of sales orgs hit 90%+. If you're consistently in the 70-79% range, you're at the median - improving data quality is the fastest lever before upgrading your model.
How does bad contact data affect forecasts?
Directly. If 30% of pipeline emails bounce, your weighted forecast is inflated by roughly that much. Keeping CRM data current with verified emails on a regular refresh cycle ensures pipeline-based projections reflect real opportunities, not contacts who left the company two quarters ago.
Can I use a revenue forecast in a marketing plan?
Absolutely. A revenue projection in a marketing plan ties projected sales to campaign spend, helping you justify budget and set realistic lead-gen targets. Use the lead-driven model from this guide - multiply expected leads by conversion rate and average deal size - then align your marketing calendar to months where the forecast shows the biggest gaps between target and pipeline.