Sales Funnel Optimization: Data-Backed Playbook for 2026
A SaaS founder posted on r/IndieHackers last quarter with a story that stopped us mid-scroll. They'd doubled MRR from $8,140 to $16,280 - with nearly flat traffic. Visitors went from 2,847 to 2,963. Basically a rounding error. The entire revenue lift came from fixing conversion leaks between funnel stages: visitor-to-signup climbed from 11% to 16%, signup-to-trial from 41% to 55%, trial-to-paid from 18% to 25%. Same traffic, same product, same market. Just better plumbing.
Most teams stare at dashboards obsessing over traffic volume when the real gains hide in the gaps between stages. If you want to know how to optimize your sales funnel, the answer starts with those gaps - not with buying more ads.
The Short Version
Most funnel optimization fails because people skip diagnosis. Before testing anything: benchmark your conversion rates by stage against industry data, identify your single biggest leak, and fix the bottom of the funnel first. Close-rate improvements compound faster than top-of-funnel traffic increases. A 5-point lift in a mid-funnel stage can increase closed revenue 12-18%.
What Does Funnel Optimization Actually Mean?
Sales funnel optimization is the practice of diagnosing and fixing conversion leaks between stages - not just "getting more traffic." Every funnel maps to some version of the AIDA framework), which translates to the stages most B2B teams actually use: TOFU (top of funnel), MOFU (middle of funnel), and BOFU (bottom of funnel).
Each transition between stages has its own conversion rate, and each can be measured, benchmarked, and improved independently. You don't optimize "the funnel." You optimize the specific stage where you're losing the most people relative to what's normal for your industry and company size.
What "Good" Looks Like
Every funnel guide gives you the same generic tips without a single benchmark. How are you supposed to know if your 2% visitor-to-lead rate is a crisis or par for the course?
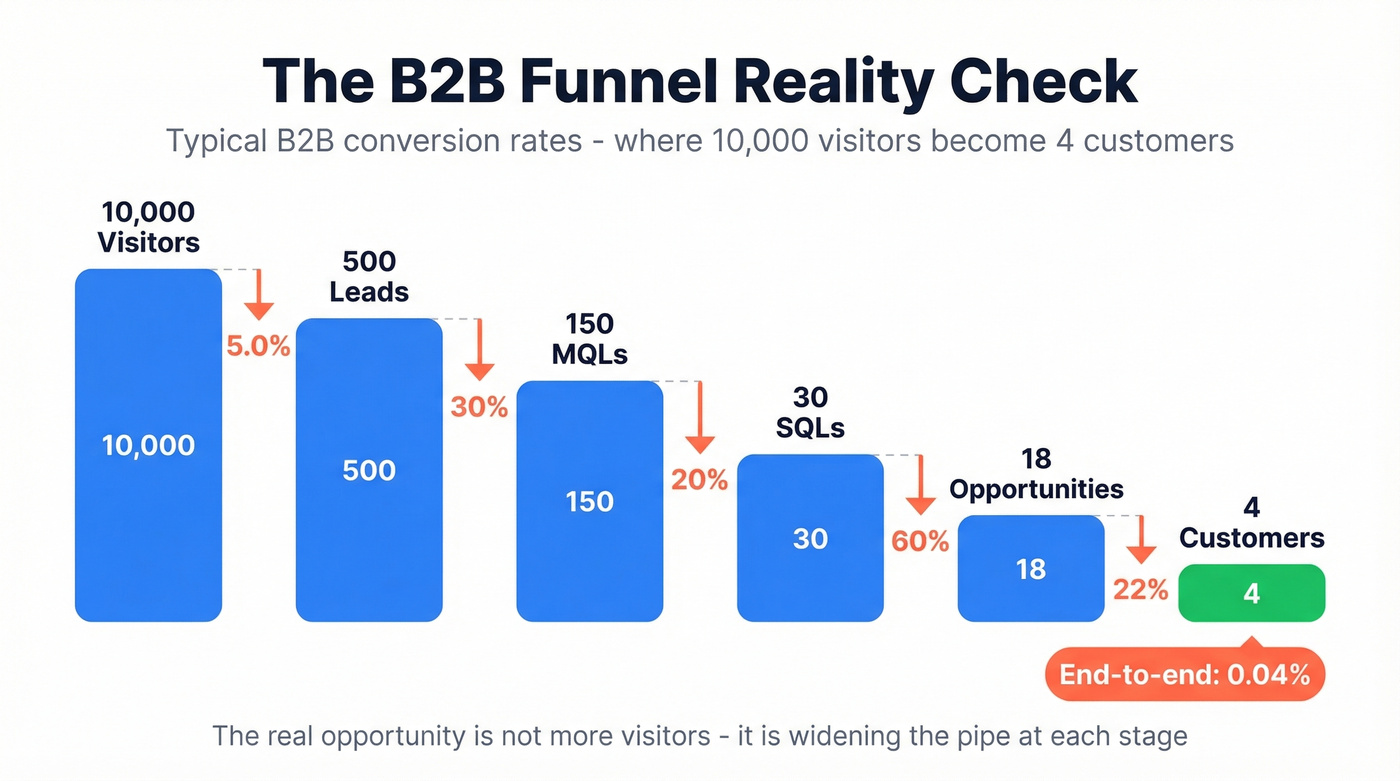
Here's the waterfall math that makes the concept click. Start with 10,000 website visitors. At typical B2B rates, you'll get roughly 500 leads, 150 MQLs, 30 SQLs, 18 opportunities, and 4 closed customers. That's a 0.04% end-to-end conversion rate - and it's normal. The real opportunity isn't pouring more visitors into the top. It's widening the pipe at each stage.
B2B Funnel Benchmarks by Industry
| Industry | Lead-MQL | MQL-SQL | SQL-Opp | SQL-Closed |
|---|---|---|---|---|
| B2B SaaS | 39% | 38% | 42% | 37% |
| Cybersecurity | 24% | 40% | 43% | 46% |
| eCommerce | 23% | 58% | 66% | 60% |
| IT & Managed Svcs | 19% | 38% | 41% | 46% |
Based on First Page Sage benchmark data with a client mix that's ~65% B2B.
Now let's zoom into B2B SaaS specifically, because company size changes everything.
B2B SaaS Benchmarks by Company Size
| Stage | SMB / Mid-Market | Enterprise |
|---|---|---|
| Visitor-Lead | 1.4% | 0.7% |
| Lead-MQL | 41% | 39% |
| MQL-SQL | 39% | 31% |
| SQL-Opp | 42% | 36% |
| Opp-Close | 39% | 31% |
Enterprise funnels convert at lower rates across every stage. That shouldn't surprise anyone who's dealt with a 13-person buying committee - more people who can say no, longer deliberation cycles, and more internal politics to navigate. That's not a problem to fix; it's a structural reality to plan around.
One more number worth bookmarking: the median landing page conversion rate across all industries is 6.6%, based on 41,000+ landing pages and 464 million unique visitors. If your landing pages convert below 4%, treat it as a clear TOFU problem. Above 8%? Your attention usually belongs further down the funnel.
The Pipeline Velocity Formula
If you only memorize one formula from this guide, make it this one:
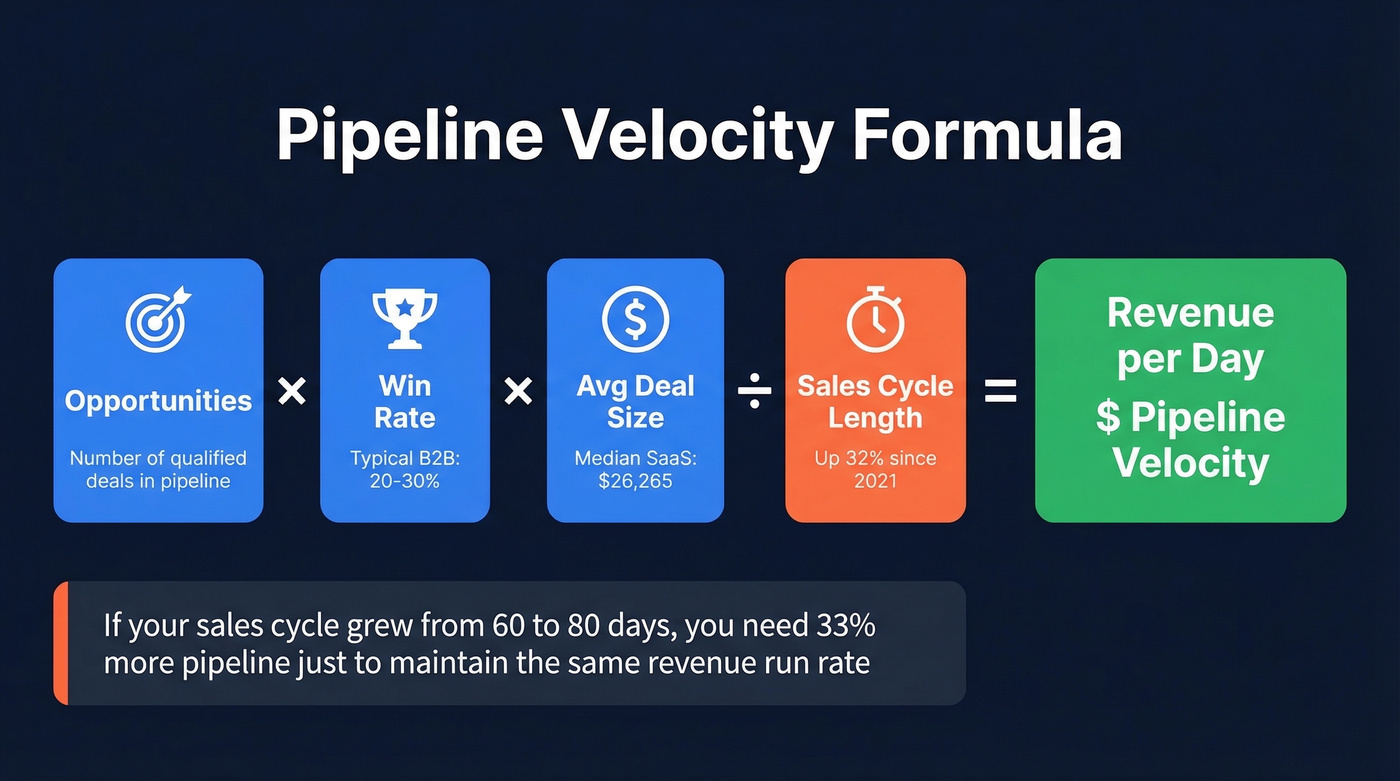
(Opportunities x Win Rate x Avg Deal Size) / Sales Cycle Length = Pipeline Velocity
Pipeline velocity tells you how much revenue moves through your funnel per day. Improving any single variable - more opportunities, higher win rate, larger deals, or shorter cycles - improves the whole equation.
For context: the median deal size for private SaaS companies is $26,265, and sales cycles have lengthened 32% since 2021. That cycle-length creep is quietly destroying pipeline velocity for teams that aren't tracking it. If your cycle went from 60 to 80 days, you need 33% more pipeline just to maintain the same revenue run rate.
How to Diagnose Your Funnel
Here's the thing most optimization guides get backwards: they tell you to start at the top. Don't.
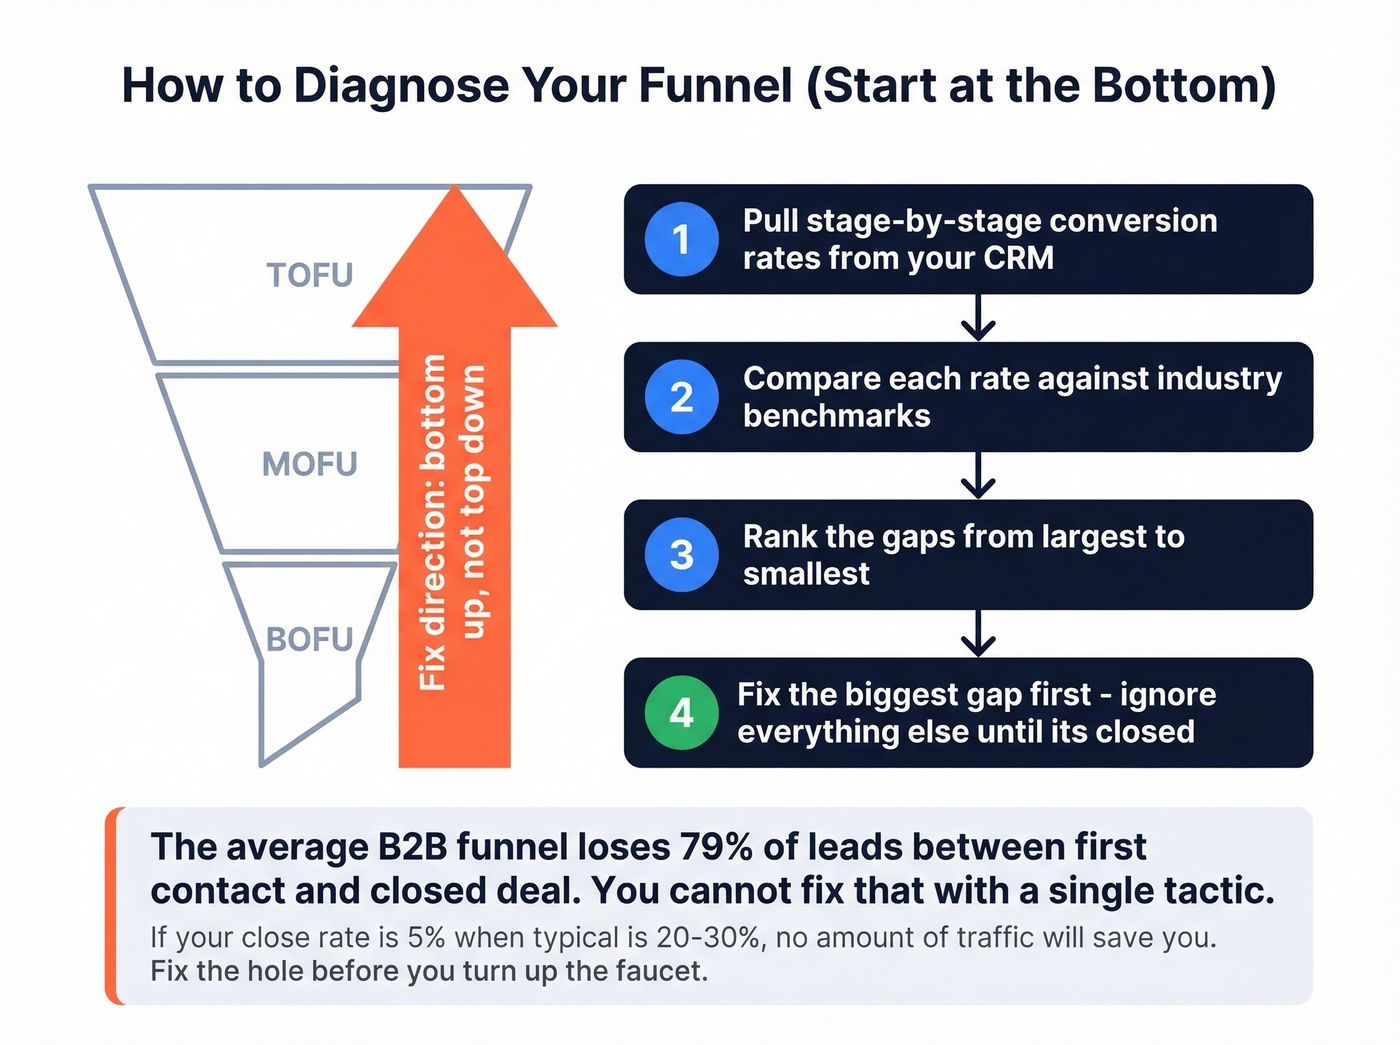
If your close rate is 5% when typical B2B win rates are 20-30%, no amount of top-of-funnel traffic will save you. You're pouring water into a bucket with a hole in the bottom. Fix the hole first, then worry about the faucet.
Let's be honest: if your average deal is under $15k and your close rate is below 15%, you probably don't have a lead gen problem - you have a qualification or sales process problem. We've watched teams spend six figures on demand gen while their bottom-of-funnel leaked like a sieve. Stop buying traffic until you can convert the traffic you already have.
The diagnostic process itself fits on a sticky note:
- Pull stage-by-stage conversion rates from your CRM.
- Compare each against the benchmark tables above.
- Rank the gaps from largest to smallest.
- Start fixing the biggest gap. Ignore everything else until it's closed.
The average B2B funnel loses 79% of leads between first contact and closed deal. You can't fix that with a single tactic. You fix it by finding the one stage where you're bleeding the most and applying concentrated effort there.
You just saw the math: a 5-point lift in mid-funnel conversion can boost closed revenue 12-18%. But none of that matters if your TOFU data is rotten. Prospeo's 98% email accuracy and 30% mobile pickup rate mean more of your leads are real people who actually pick up - so every stage downstream converts higher.
Stop optimizing a funnel built on bad data. Start with contacts that convert.
Stage-by-Stage Strategies
Top of Funnel: Awareness to Lead
Cold outreach is still the primary TOFU engine for most B2B teams, and the numbers are humbling. Cold email reply rates run 1-5%, with only 0.2-2% converting into actual sales. Cold calling averages 2.3%. Eighty percent of deals require five or more touches, yet 44% of reps give up after one follow-up. That persistence gap is one of the easiest TOFU leaks to fix - it's not a strategy problem, it's a discipline problem.
Multichannel outreach - combining email, phone, and social - increases response rates by 287% compared to single-channel. That stat alone should kill any "email-only" or "cold-call-only" strategy.
If your visitor-to-lead rate is below the 1.4% SMB benchmark, look at your inbound messaging first. The IndieHackers founder shifted their landing page from feature-focused copy to outcome-based value propositions with customer testimonials. Visitor-to-signup jumped from 11% to 16%. No redesign, no new traffic source - just better messaging. Channel matters too: SEO-sourced visitors convert to leads at roughly 2.1%, while PPC visitors convert at just 0.7%. The traffic source shapes the funnel math before a single optimization is applied.
Middle of Funnel: Lead to Opportunity
The MQL-to-SQL transition is where most B2B funnels choke. Compare your MQL-to-SQL rate against the 38% B2B SaaS benchmark above - if you're significantly below that, this section is for you. Broader benchmark data puts this conversion at 15-21% across all B2B, making it the single biggest bottleneck in the entire pipeline.
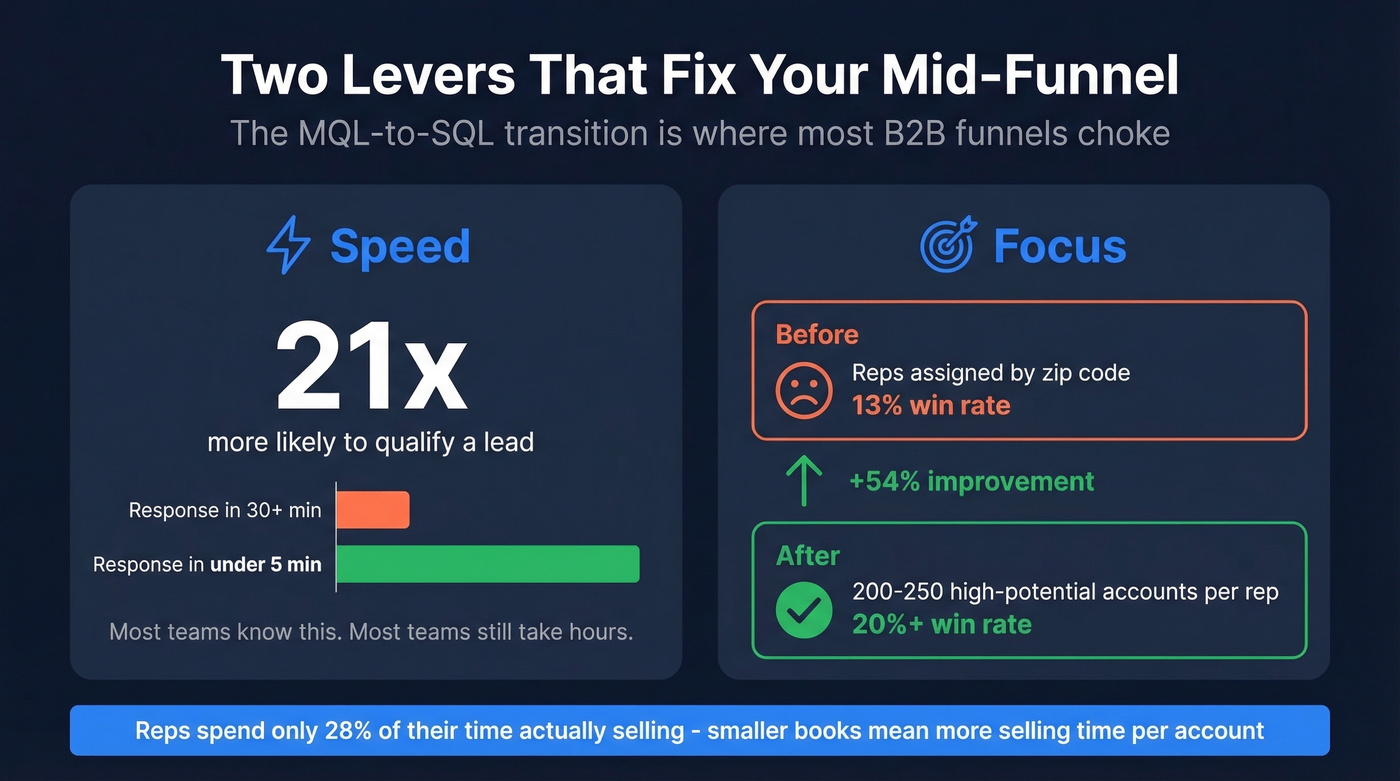
Two things move this number more than anything else: speed and focus.
Speed-to-lead is brutal in its simplicity. Responding within five minutes makes you 21x more likely to qualify a lead than waiting 30 minutes. Most teams know this. Most teams still take hours.
Focus means giving reps fewer, better accounts. Box moved from handing reps zip codes to giving them 200-250 high-potential accounts. A Gradient Works customer reduced books to 300-400 accounts and watched win rates jump from 13% to over 20% in under a year. Reps spend only 28% of their time actually selling - the rest is admin, internal meetings, and CRM hygiene. Smaller books mean more selling time per account.
The IndieHackers founder attacked MOFU by expanding their email sequence and making it value-focused rather than product-focused - tailoring content to where each prospect was in their evaluation. Signup-to-trial conversion climbed from 41% to 55%. MOFU isn't about pushing harder. It's about proving value before asking for commitment.
If you're tightening qualification, consider formalizing your lead scoring so MQLs and SQLs stop drifting.
Bottom of Funnel: Opportunity to Close
This is where revenue lives. Typical B2B win rates run 20-30%, which means even well-qualified opportunities fail to close more often than not. Small improvements here have outsized impact because they multiply everything above them.
The IndieHackers case nailed this stage with guided onboarding and personal outreach, lifting trial-to-paid from 18% to 25% - a 39% improvement in the metric that directly drives MRR.
CTA copy matters more than most teams realize. Going.com changed their button text from "Sign up for free" to "Trial for free" and saw a 104% increase in premium trial starts. Two words. Double the conversions.
For eCommerce funnels, the BOFU playbook is different but equally data-driven. Two-step checkout flows improve conversions 20-40% compared to single-page checkout, and cart abandonment recovery sequences at 1-hour, 2-hour, 24-hour, and 48-hour intervals recapture meaningful lost revenue. Don't ignore device either - New Balance Chicago saw 200% more in-store sales after building mobile-optimized landing pages.
If your team struggles to consistently close, tighten your steps to close a sale and standardize your product demo flow.
The Invisible Leak: Bad Data
Your SDR team is making 200 calls a day and booking three meetings a week. Leadership thinks it's a skills problem. But 30% of the phone numbers in your CRM are disconnected, and your email bounce rate is hovering around 35%. That's not a rep problem - it's a data problem silently destroying every downstream metric in your funnel.
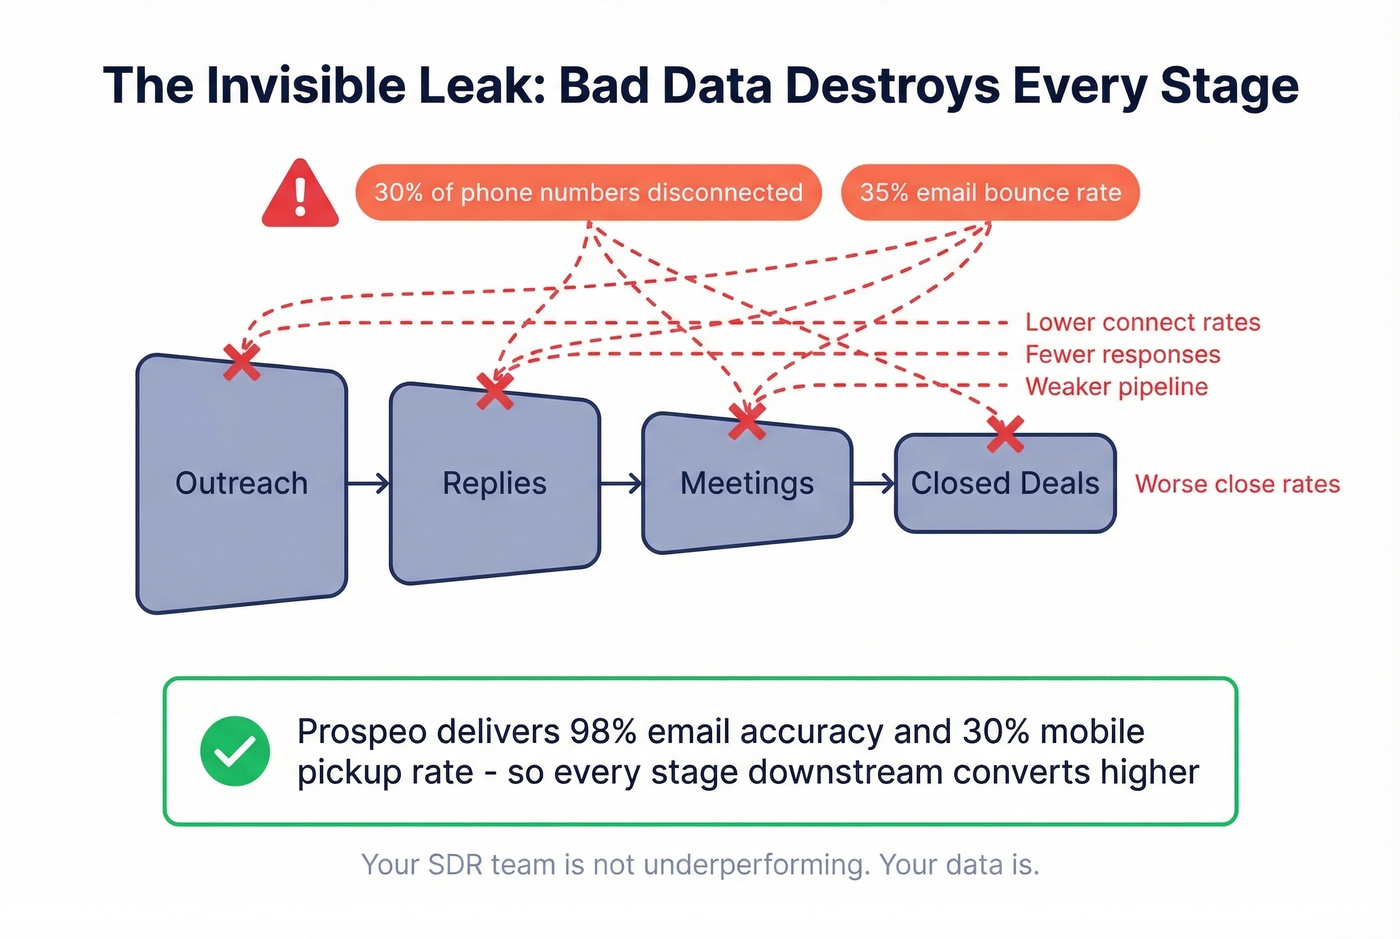
Bad contact data doesn't show up in any single stage's conversion rate. It shows up everywhere: lower reply rates, fewer meetings, weaker pipeline, worse close rates. We've seen this pattern repeatedly - teams optimize landing pages and email sequences while their CRM is full of dead contacts. No amount of funnel tuning overcomes outreach that never reaches a human.
If your bounce rate is spiking, start with email bounce rate diagnosis before you touch copy.

Pipeline velocity = opportunities × win rate × deal size ÷ cycle length. Prospeo attacks all four variables: 300M+ profiles with 30+ filters to build more qualified opportunities, intent data across 15,000 topics to shorten cycles, and verified direct dials that skip the gatekeeper entirely. At $0.01 per email, the ROI math is embarrassing.
Multiply your pipeline velocity without multiplying your budget.
AI-Era Funnel Strategies
Sales teams using AI grew revenue at 83% vs 66% for those without, per Salesforce's State of Sales report. The gap is widening. And 81% of reps say AI helps reduce manual work, which directly addresses the "reps only sell 28% of the time" problem.
The highest-impact AI applications right now sit in three areas. Predictive lead scoring with tools like Salesforce Einstein (~$50/user/month) replaces gut-feel MQL definitions with models trained on your actual close data. Chatbot qualification through Intercom Fin (~$29/mo plus $0.99 per resolution) handles speed-to-lead at scale - no human can respond in under five minutes to every inbound lead, but a bot can. Automated follow-up sequences ensure the 5+ touches that 80% of deals require actually happen.
World of Wonder saw nearly a 20% conversion boost using AI optimization tools on their streaming funnel. That's not a marginal gain.
One warning: don't stuff AI-generated content into lead magnets and gated resources. Buyers can tell. Low-quality AI content is becoming a funnel killer at the TOFU stage because it erodes trust before a prospect ever talks to a rep.
If you're building an AI-heavy workflow, map it to your sales funnel automation tools so you don't create new leaks.
Five Mistakes That Waste Your Budget
1. Testing too many variables at once. The IndieHackers founder called this out explicitly - they wasted weeks running simultaneous tests that made it impossible to attribute results. Change one thing. Measure it. Move on.
2. Optimizing micro-conversions instead of revenue. A 50% lift in email open rates means nothing if it doesn't move pipeline. Tie every test back to a revenue-stage metric: meetings booked, opportunities created, deals closed. Vanity metrics are comfortable. Revenue metrics are useful.
3. Deep-funnel tracking that starves your ad algorithms. If you're running Google Ads and optimizing for a conversion event that only fires 5 times a month, the algorithm can't learn. Aim for 30-50 conversions per month per campaign minimum. When your deep-funnel event doesn't hit that threshold, optimize for a mid-funnel action and qualify downstream.
4. Ignoring mobile. The majority of your traffic is probably mobile. If your forms, checkout flows, and landing pages aren't built mobile-first, you're optimizing a funnel that most visitors never experience as intended. New Balance's 200% in-store sales lift from mobile-optimized pages isn't an outlier - it's what happens when you stop ignoring the device your buyers actually use.
5. Optimizing top-down instead of bottom-up. This is the most expensive mistake on the list. Doubling your traffic when your close rate is 5% gives you twice as many lost deals. Tripling your close rate from 5% to 15% triples revenue from existing pipeline immediately. Always start from the bottom.
The Funnel Optimization Tool Stack
You don't need 10 tools. You need four: analytics, behavior tracking, testing, and a CRM. Everything else is a nice-to-have that you add once the core stack is producing data you actually act on.
| Category | Tool | Starting Price | Best For |
|---|---|---|---|
| Analytics | GA4 | Free | Every funnel |
| Behavior | Hotjar | Free | Heatmaps, recordings |
| Behavior | Mixpanel | Free | Event-level funnels |
| A/B Testing | Unbounce | Paid plans | Landing page tests |
| A/B Testing | VWO | Free + paid plans | Site-wide experiments |
| Email (eComm) | Klaviyo | Free + paid plans | eCommerce nurturing |
| Email (B2B) | ActiveCampaign | Paid plans | B2B SaaS automation |
| CRM | HubSpot Sales Hub | $100/seat/mo (Professional) | Mid-market B2B |
| CRM | Salesforce | From $25/user/mo (billed annually) | Enterprise |
| Landing Pages | ClickFunnels | $81/mo | Full funnel builder |
| Data Quality | Prospeo | Free (75 emails/mo) | Verified emails + mobiles |
The consensus on r/analytics is that Crazy Egg works well as a Hotjar alternative for heatmaps - worth testing if you want a second opinion on user behavior data.
The biggest tool mistake we see is teams buying an expensive all-in-one platform and using 20% of it. Start with free tiers, prove the workflow, then upgrade. GA4 plus Hotjar plus your existing CRM covers 80% of what you need for diagnosis. Skip the $50k/year platform until you've outgrown the free stack.
If you're evaluating systems, start with a clear list of examples of a CRM and the best contact management software for your stage.
FAQ
How do I optimize a sales funnel effectively?
Start by pulling stage-by-stage conversion rates from your CRM and comparing each against the industry benchmarks in this guide. Identify your single biggest leak, fix it from the bottom up, and measure the impact before moving to the next stage. One focused fix at the right stage beats ten scattered improvements.
What's a good funnel conversion rate?
Most B2B funnels convert 2-5% of visitors to leads and 20-30% of opportunities to closed deals. The median landing page conversion rate across industries is 6.6% based on 41,000+ pages analyzed. Compare your stage-by-stage rates against industry benchmarks to find your biggest leak.
How do I know where my funnel is broken?
Map your conversion rate at every stage and compare each against the benchmarks in this guide. The stage with the biggest gap between your rate and the benchmark is where to focus first.
How does bad contact data affect my funnel?
If 30%+ of your emails bounce or phone numbers are disconnected, every downstream metric suffers - reply rates, meetings booked, pipeline generated. Verified data with 98% accuracy and a weekly refresh cycle ensures your outreach reaches real people instead of dead inboxes.
Should I optimize from the top or bottom?
Start from the bottom. Improving your close rate from 5% to 15% triples revenue from existing pipeline immediately. Top-of-funnel improvements take longer to compound and waste budget if the bottom is leaking. Fix the bucket before you turn up the faucet.