Build a Sales Funnel Template in Excel That Actually Works
You downloaded a template last week. It looked great - color-coded stages, a nice funnel chart, clean layout. Then you tried to add a "Disqualified" status to Stage 3, and the whole sheet broke. Formulas pointing nowhere, the chart mangled, zero documentation. This is a common complaint on r/excel about prebuilt sales funnel templates: they look polished until you need to change anything.
84% of reps missed quota last year. A broken spreadsheet isn't helping. For teams with fewer than 50 active deals, though, a spreadsheet is still the right call - no CRM needed yet. What follows is a funnel template you can actually modify, built on four formulas you'll understand well enough to fix yourself.
Free Template Download
Every cell is unlocked, every formula is annotated with a comment explaining what it does. No email required. Open it, duplicate it, break it, rebuild it - that's the point.
→ Download the Excel template | Google Sheets version
How to Structure Your Funnel Spreadsheet
A single-sheet funnel template falls apart fast. Use a three-sheet architecture:
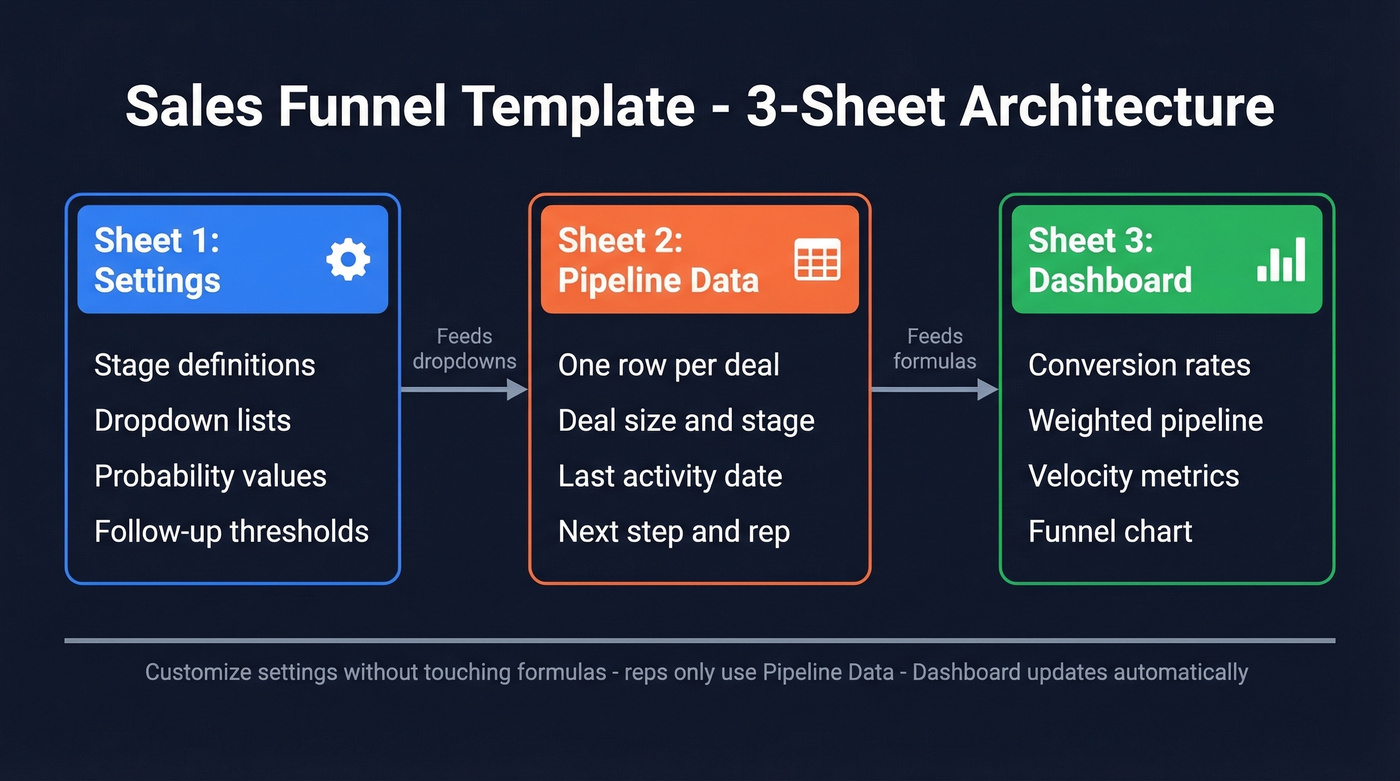
- Settings / Instructions - stage definitions, dropdown lists, probability values, follow-up reminder thresholds. Customize here without touching formulas.
- Pipeline Data - one row per deal. The raw input sheet your reps actually use.
- Dashboard - auto-updating conversion rates, weighted pipeline, velocity metrics, and your funnel chart.
Here are the columns your Pipeline Data sheet needs:
| Column | Why It Matters |
|---|---|
| Deal Name | Identification |
| Company | Account-level grouping |
| Contact | Who you're talking to |
| Stage | Current funnel position |
| Deal Size | Revenue at stake |
| Probability | Win likelihood (%) |
| Weighted Value | Deal Size x Probability |
| Close Date | Forecast timing |
| Last Activity | Staleness detection |
| Next Step | Forces accountability |
| Rep | Performance tracking |
| Days in Stage | Flags stuck deals |
Choosing Your Funnel Stages
B2B and B2C funnels aren't the same animal. B2B deals involve multiple stakeholders and longer evaluation cycles; B2C funnels are shorter and more linear.
A common B2B setup runs 6-8 stages: Lead, MQL, SQL, Discovery, Proposal, Negotiation, Closed Won, Renewal. SaaS funnels emphasize trial and demo stages, while consulting funnels weight discovery and proposal more heavily. A B2C or ecommerce funnel can work with a simple buyer-journey flow: Awareness, Interest, Consideration, Purchase.
You don't need 10 stages. Five to seven that your whole team defines the same way will do more for you than a granular model nobody updates consistently. Here's the critical design choice most templates get wrong: leads can become disqualified at any stage, not just the first one. Add a flexible outcome column (Won / Lost / Disqualified / Stalled) that works at every stage - this is easiest when you standardize your Lead Status definitions.
The 4 Formulas Behind Every Sales Funnel Spreadsheet
Every Excel-based pipeline tracker - no matter how fancy - runs on these four calculations. Learn them once and you'll never be locked into someone else's template again.
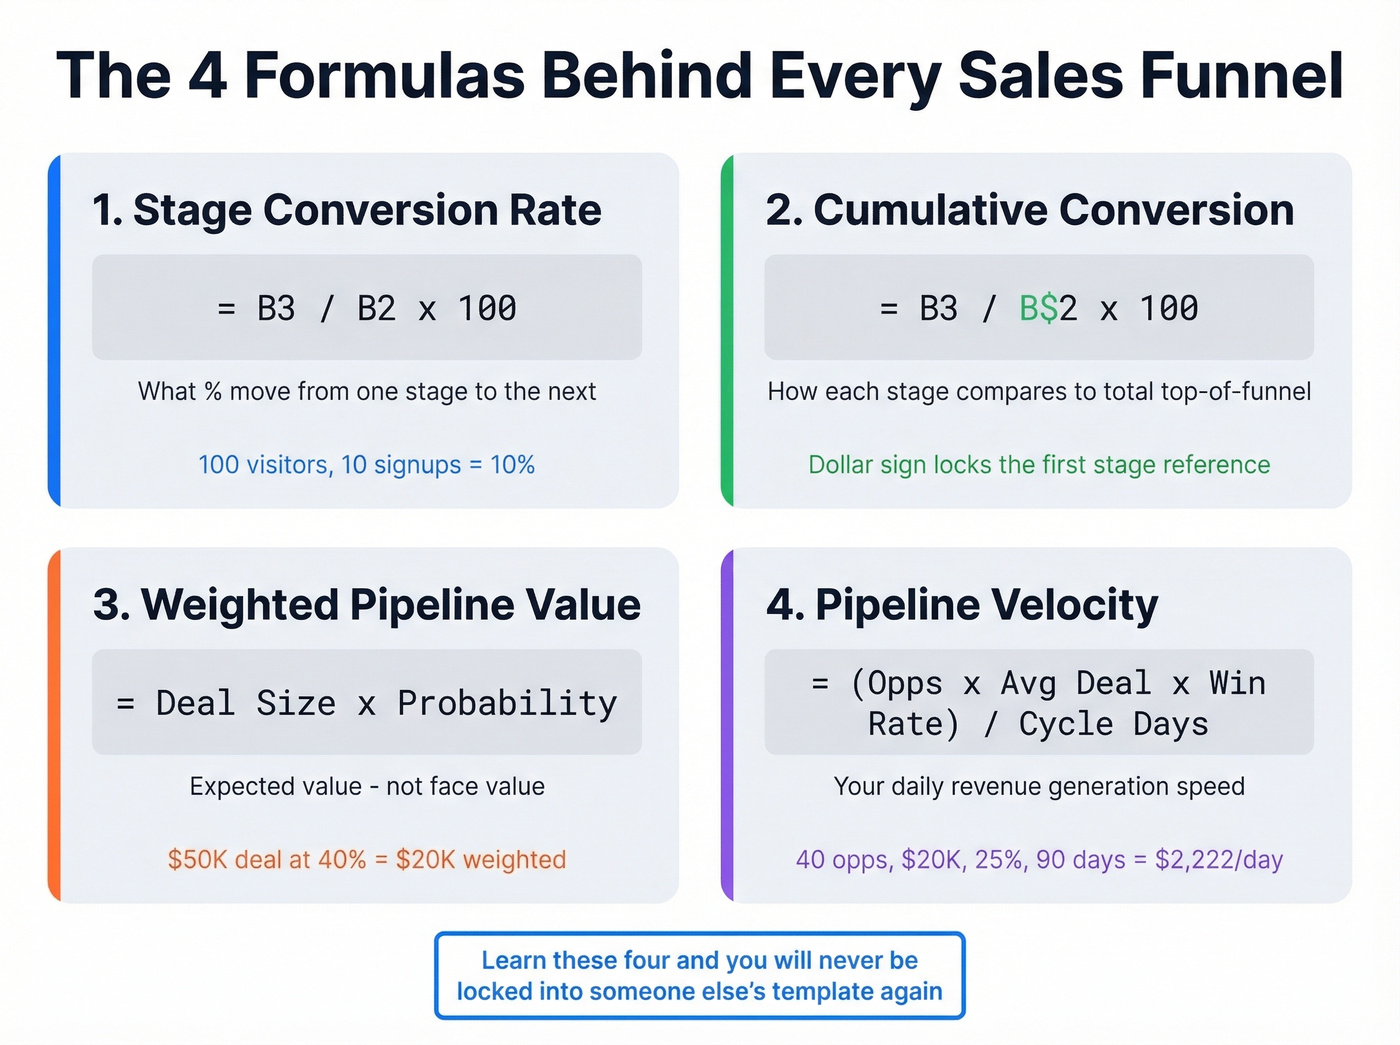
Stage Conversion Rate
=B3/B2*100
What percentage of people move from one stage to the next. If 100 visitors hit your landing page (B2) and 10 sign up (B3), your visitor-to-signup conversion is 10%. Simple division, but it's the foundation of everything else - and it’s one of the core funnel metrics you should track consistently.
Cumulative Conversion
=B3/B$2*100
The dollar sign locks the reference to your first stage. This shows how each stage compares to your total top-of-funnel volume - not just the stage above it. It answers: "Of everyone who entered the funnel, how many made it here?"
Weighted Pipeline Value
=DealSize*Probability
A $50K deal at 40% probability is worth $20K in your forecast. That's expected value math, and it's how you avoid counting every open deal at face value. Sum this column for your total weighted pipeline - then sanity-check it against your pipeline health signals (staleness, stage aging, next steps).
Pipeline Velocity
=(Opportunities x Avg Deal Value x Win Rate) / Cycle Length in Days
This gives you daily revenue velocity. A SaaS company with 40 opportunities, $20K average deal, 25% win rate, and a 90-day cycle generates roughly $2,222/day. Industry benchmarks put mid-market SaaS at ~$1,847/day and Financial Services at ~$2,134/day - your velocity depends entirely on your inputs. If you want a deeper comparison set, use these sales pipeline benchmarks to spot where you’re off.
How to Build a Funnel Chart in Excel
If you're on Excel 2019 or Microsoft 365, select your stage names and counts, go to Insert, Charts, Funnel Chart. Done.
On older versions, you'll need the stacked bar workaround. Create a helper column:
=(MAX($B$2:$B$6)-B2)/2
This centers each bar by calculating the padding needed on each side. Insert a stacked bar chart using both your data column and the helper column, then reverse the category order (right-click axis, Format Axis, Categories in reverse order). Set gap width to 0%, format the helper series as No Fill, strip out axes and gridlines, and add data labels. Five minutes, identical result.
A funnel template is only as good as the data feeding it. Prospeo gives you 300M+ verified contacts with 30+ filters - buyer intent, technographics, headcount growth - so every row in your Pipeline Data sheet is a real opportunity, not a guess.
Stop tracking empty stages. Fill your funnel with verified leads.
Benchmarks - What Good Looks Like
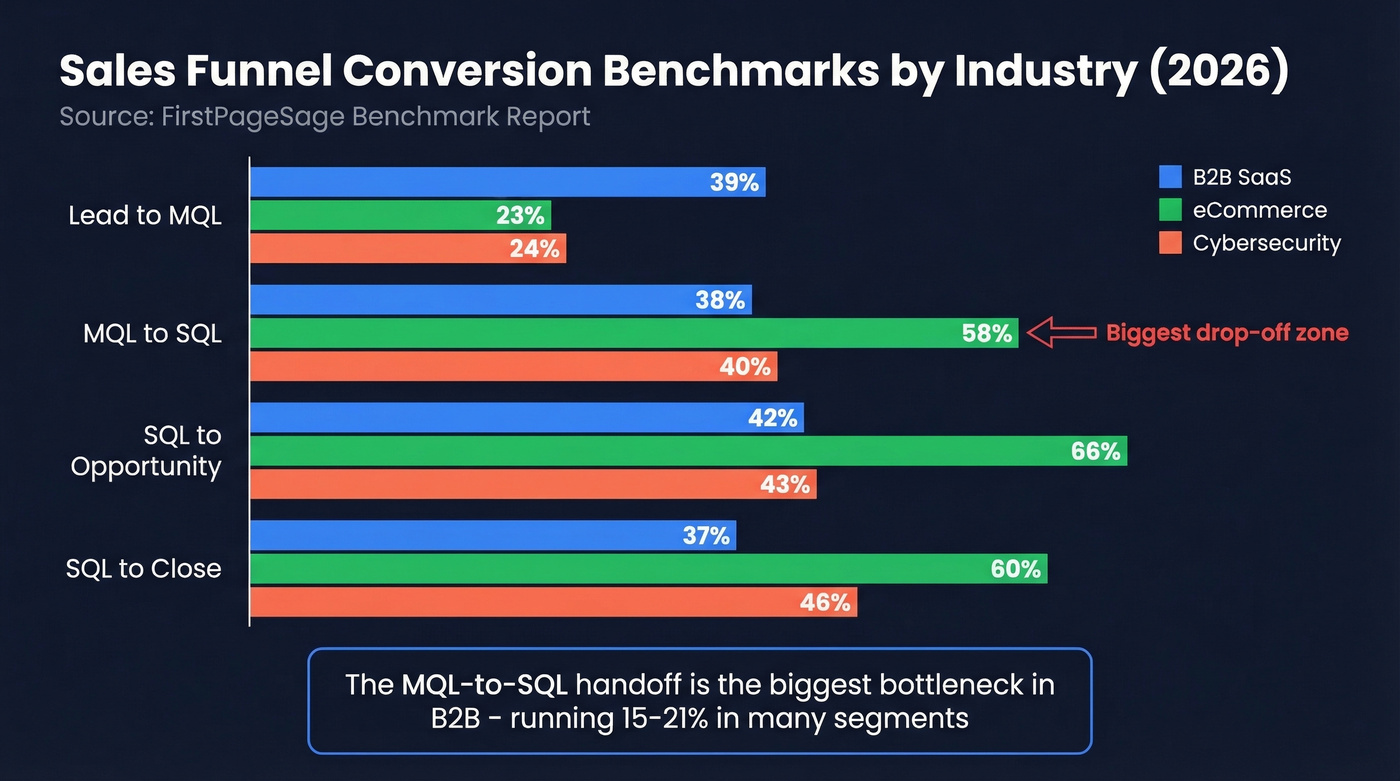
Conversion rates mean nothing without context. Here's what FirstPageSage's 2026 benchmark report shows:
| Industry | Lead to MQL | MQL to SQL | SQL to Opp | SQL to Close |
|---|---|---|---|---|
| B2B SaaS | 39% | 38% | 42% | 37% |
| eCommerce | 23% | 58% | 66% | 60% |
| Cybersecurity | 24% | 40% | 43% | 46% |
The MQL-to-SQL handoff is consistently the biggest bottleneck across B2B verticals, running 15-21% in many segments. We've watched teams agonize over top-of-funnel volume when the real problem was a leaky handoff in the middle. If your numbers look dramatically different from these, either your stage definitions don't match or you've found a genuine outlier worth investigating. (If you need more context, compare against the average B2B lead conversion rate by channel and segment.)
80% of B2B interactions now happen through digital channels, and buyers use an average of 10 different channels during their journey. Your funnel spreadsheet captures one slice of a messier reality. Track it anyway - imperfect data beats no data.
5 Mistakes That Break Your Template
1. Locked stages with no flexible outcome column. If a lead can only be "disqualified" at Stage 1, you're forcing reps to lie about where deals actually die. Add a status dropdown at every stage.
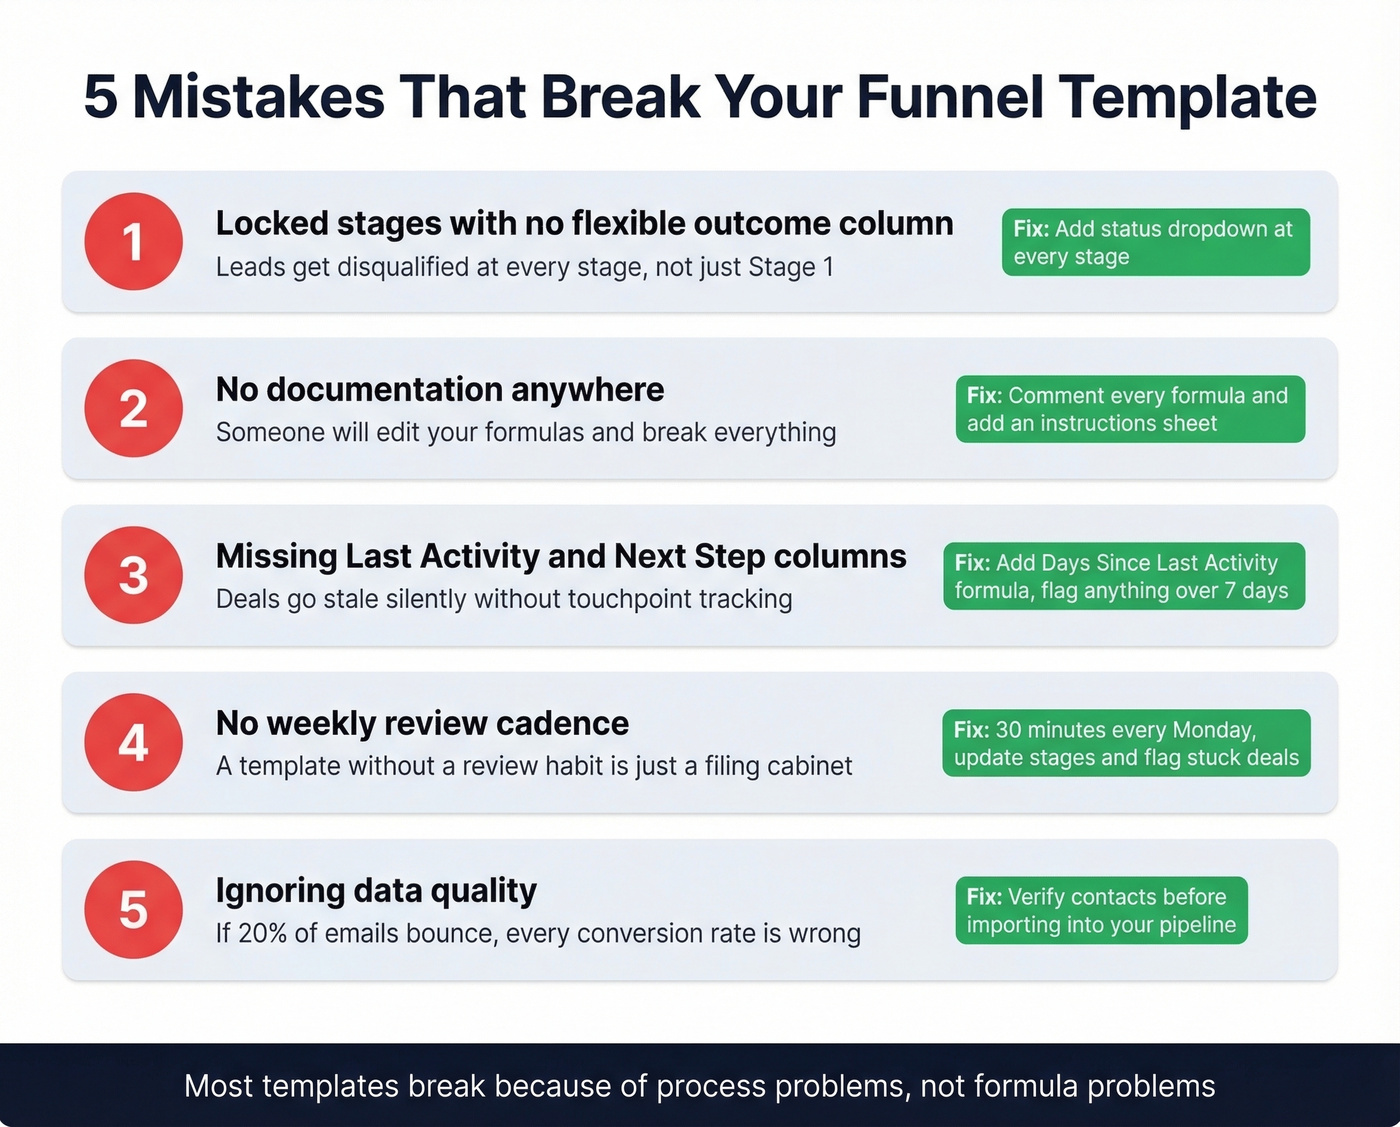
2. No documentation. Someone will edit your formulas. When they break something, there needs to be a comment or instruction sheet explaining the logic. The demand for template documentation on Reddit is real - creators get flooded with questions because nothing is explained.
3. No "Last Activity" or "Next Step" columns. Most deals require 5-12 touchpoints to close. Without tracking when you last engaged and what happens next, deals go stale silently. Add a "Days Since Last Activity" formula to flag anything over 7 days - and consider keeping a few proven sales follow-up templates handy so reps don’t stall.
4. No review cadence. A template without a weekly review habit is a filing cabinet. Schedule 30 minutes every Monday to update stages and flag stuck deals.
5. Ignoring data quality. If 20% of your prospect emails bounce, your Stage 1 count is inflated and every downstream conversion rate is wrong. Garbage in, garbage out. Run your prospect list through a verification tool before importing - Prospeo handles this with 98% email accuracy and a free tier of 75 verifications per month, enough to audit a small pipeline without spending a dime. (If you’re troubleshooting bounces, start with email bounce rate basics.)
Running a Weekly Pipeline Review
The spreadsheet is infrastructure. The review is where value gets created.
Hold it weekly, same day and time. We like Tuesday or Wednesday mornings. Review deals by stage, flag anything stuck longer than your average cycle time, and update probabilities based on actual buyer signals - not gut feel. Use BANT or MEDDIC to pressure-test deals in later stages. If a rep can't articulate the decision process, the deal isn't where they think it is. If you run MEDDIC, keep a shared set of MEDDIC discovery questions so qualification is consistent.
Let's be honest: most pipeline reviews are status updates where reps read their deal list aloud. That's a waste of everyone's time. Focus exclusively on deals that changed, deals that didn't change but should have, and deals that need help. Document the next step and next step date directly in the sheet. If it's not written down, it doesn't exist.
Over 70% of CRM records become outdated annually. Spreadsheets are worse because there's no automated decay detection. Build a "stale deal" conditional format that highlights any row where Last Activity is older than 14 days - it takes two minutes and saves hours of chasing ghosts.
When to Ditch the Spreadsheet
Keep the spreadsheet if you have 1-4 reps, fewer than 50 active deals, and one person owns the data. A well-built sales funnel template in Excel is more than enough at this scale, and we've seen teams run six-figure pipelines on nothing more.
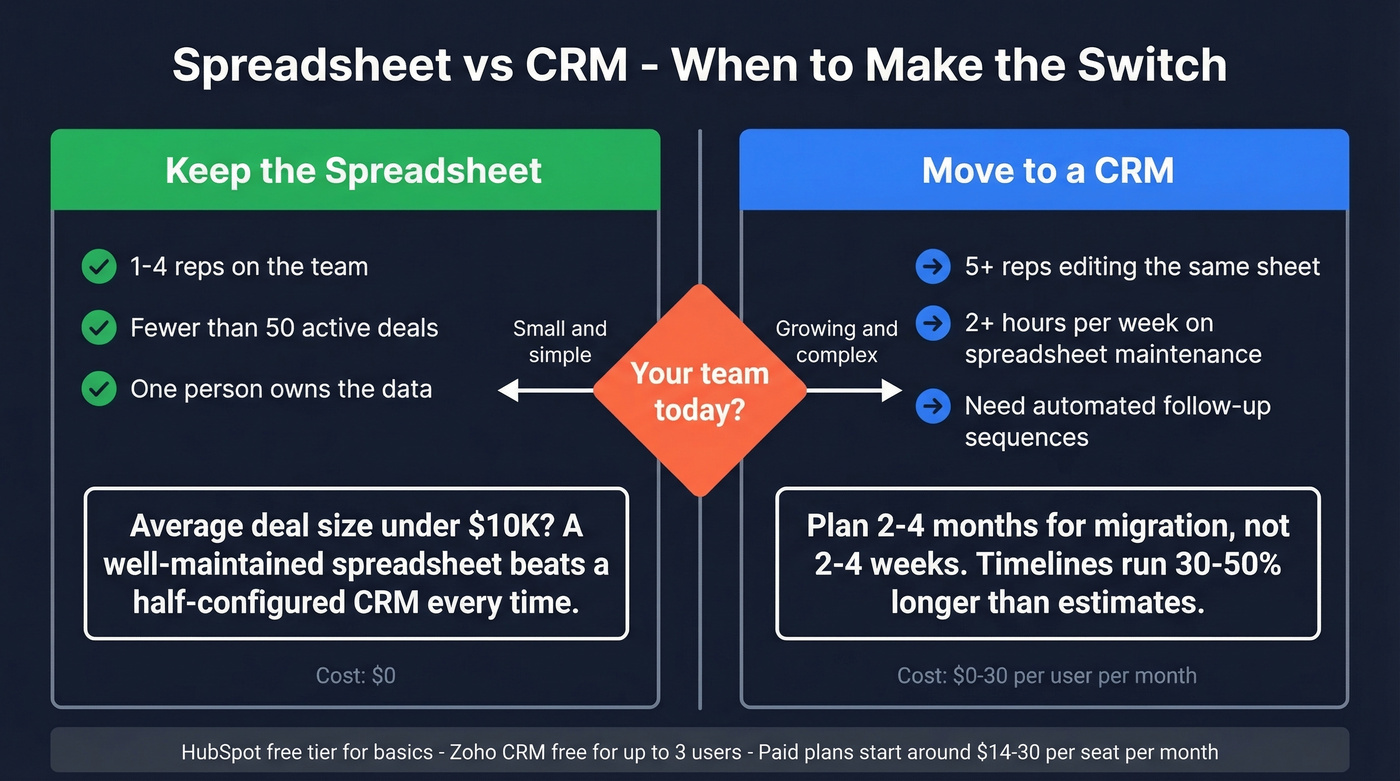
Move to a CRM when you hit 5+ reps editing the same sheet, you're spending more than 2 hours per week on spreadsheet maintenance, or you need automated follow-up sequences. Migration timelines run 30-50% longer than initial estimates - plan 2-4 months, not 2-4 weeks. HubSpot's free CRM tier handles basic pipeline management, with paid plans starting around $20-$30/mo per seat. Zoho CRM is free for up to 3 users, with paid tiers around $14-$23/mo per user. If you’re evaluating options, it helps to review a few examples of a CRM side-by-side.
Skip the CRM if your average deal size is under $10K and your team is small. A well-maintained spreadsheet will outperform a half-configured CRM every single time.
Your weighted pipeline formula is useless if half your contacts bounce. Prospeo's 98% email accuracy and 7-day data refresh mean your deal values reflect reality - not stale records from six weeks ago. Teams book 26% more meetings after switching.
Clean data in, accurate forecasts out. That's the math that matters.
FAQ
Can I use this template in Google Sheets?
Yes - every formula in this guide works identically in Google Sheets, including the native funnel chart type. Sheets adds real-time collaboration, which is useful when multiple reps update the pipeline simultaneously. No modifications needed.
How many stages should my funnel have?
Five to seven for most B2B teams. More than that and reps stop updating consistently. Define each stage with a clear entry criterion - if two reps can't independently assign the same deal to the same stage, your definitions aren't specific enough.
What's a good conversion rate for my funnel?
B2B SaaS averages 39% Lead-to-MQL and 37% SQL-to-Close. eCommerce sees 60% SQL-to-Close. Use the benchmarks table above as a starting point, then track your own data for 90 days before drawing conclusions.
How do I keep my pipeline data clean in a spreadsheet?
Verify prospect emails before importing them - bounced contacts inflate Stage 1 counts and distort every downstream metric. Prospeo's free tier handles small-pipeline audits, and tools like NeverBounce or ZeroBounce work for bulk lists.
When should I switch from a spreadsheet to a CRM?
When you hit 5+ reps, spend over 2 hours weekly on maintenance, or need automated sequences. HubSpot and Zoho both offer free tiers to start. Budget 2-4 months for migration - it consistently takes longer than teams expect.