Sales Growth Calculator: Formula, Benchmarks, and What to Do Next
It's board prep week. You need Q3 vs. Q2 growth, trailing three-year CAGR, and a slide that explains why pipeline is down. Every sales growth calculator on the internet gives you one number with zero context. Let's fix that.
How the Calculator Works
Enter your previous period sales and current period sales. The formula does the rest.
Sales Growth Rate = (Current Period Sales - Previous Period Sales) / Previous Period Sales x 100
| Input | Value |
|---|---|
| Previous Period Sales | $______ |
| Current Period Sales | $______ |
| Growth Rate | ____% |
Here's what you need at a glance:
- The formula: (Current - Previous) / Previous x 100. That's it.
- What "good" looks like: Median SaaS growth hit 26% in 2024, per BenchmarkIT's 2025 report. Top quartile was 50%.
- If growth is flat: The problem is almost always pipeline - volume, quality, or conversion. Jump to the "Now What?" section below.
The Sales Growth Formula
Say your team closed $850,000 in Q2 and $1,020,000 in Q3.
($1,020,000 - $850,000) / $850,000 x 100 = 20%
That's a 20% quarter-over-quarter growth rate. Positive numbers mean you're growing. Negative numbers mean you're contracting, and the magnitude tells you how fast.
This formula compares exactly two periods. It's great for a quick pulse check, but it won't tell you whether that 20% is a trend or a blip. For that, you need CAGR.
Sales Growth vs. Revenue Growth
"All sales are revenue, but not all revenue is sales." Sales is income from selling goods or services. Revenue includes everything - interest, royalties, one-off gains.
This matters when comparing across companies or periods. If one quarter includes a large non-operating gain that inflates "revenue growth," you're not actually seeing sales improvement. You're seeing accounting noise.
There's also the gross vs. net sales distinction. Net sales deduct returns, discounts, and allowances. If you're using gross sales in one period and net in another, your growth rate is meaningless - the formula must stay consistent across every comparison. Under ASC 606 / IFRS 15, revenue recognition timing can create optics gaps too. You might invoice in Q3 but recognize revenue in Q4. Keep your inputs clean.
Three Ways to Calculate Sales Growth
Simple Period-Over-Period
This is the formula from above, applied to any two comparable periods - quarter-over-quarter, month-over-month, year-over-year.
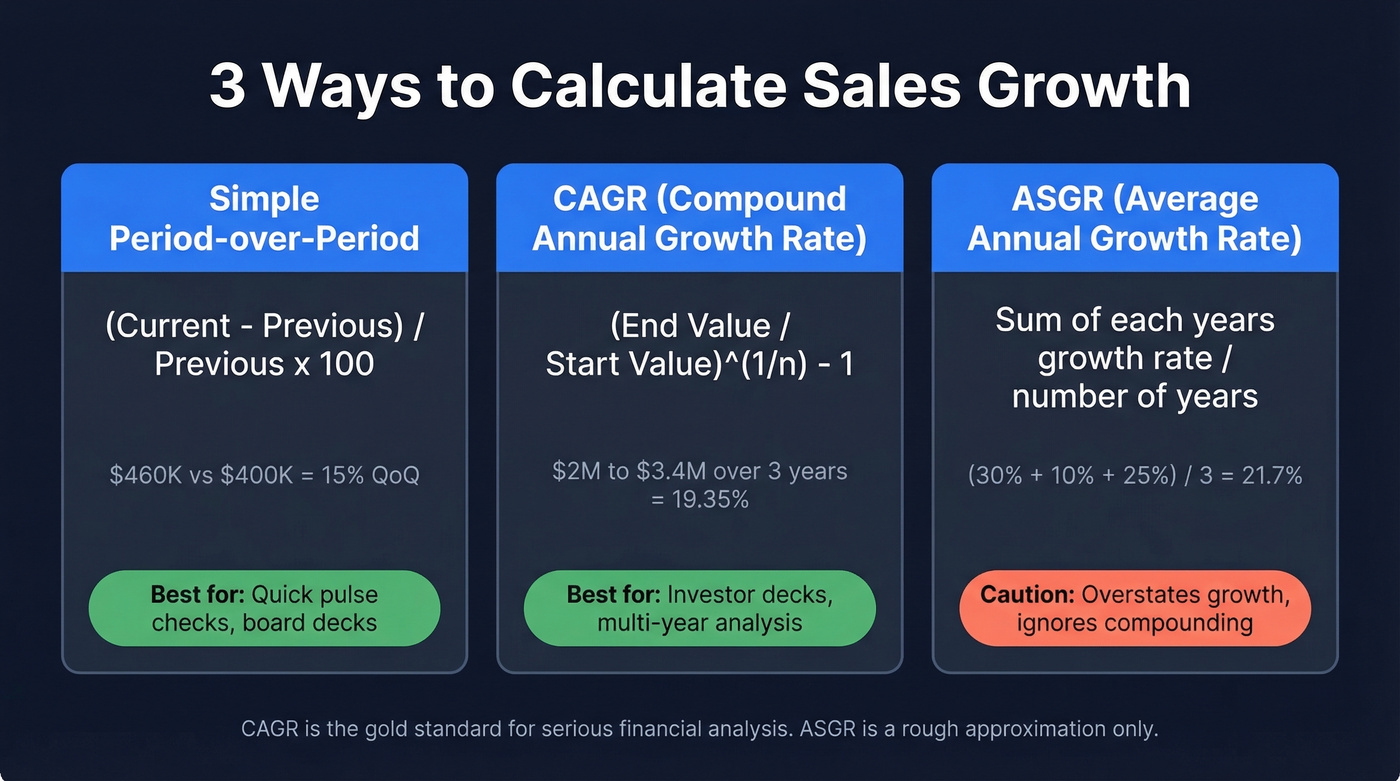
Example: Q1 sales of $400,000, Q2 sales of $460,000. ($460,000 - $400,000) / $400,000 x 100 = 15% QoQ growth.
Simple, fast, useful for board decks. Just make sure you're comparing equivalent periods. Q4 to Q1 comparisons will mislead you because of seasonality.
CAGR (Compound Annual Growth Rate)
CAGR is the only honest way to measure multi-year growth. Simple YoY percentages hide volatility and make one great quarter look like a trend. CAGR smooths everything into a single annualized rate.
Formula: CAGR = (Ending Value / Beginning Value)^(1/n) - 1
Say your annual sales went from $2M to $3.4M over three years.
CAGR = ($3,400,000 / $2,000,000)^(1/3) - 1 = 0.1935 = 19.35%
That means your sales grew at an annualized rate of 19.35%, compounded. To verify: $2M x 1.1935^3 = ~$3.4M. Check.
Here's the mistake almost everyone makes: getting "n" wrong. If you have data for 2023, 2024, 2025, and 2026, that's four data points but only three growth periods. Use n = 3, not n = 4. We've seen this single error account for more bad CAGR numbers than any other mistake in financial modeling. Always compound forward from the starting value to double-check - if you don't land on the ending value, your n is wrong.
ASGR (Average Annual Sales Growth Rate)
ASGR simply averages each year's individual growth rate. If you grew 30%, 10%, and 25% over three years, ASGR = (30 + 10 + 25) / 3 = 21.7%.
The problem? Averaging doesn't account for compounding. ASGR overstates actual growth when rates vary significantly. Use it for a quick sense of "typical" annual performance, but for investor decks, fundraising, or any serious financial analysis, CAGR is the standard.
You just calculated your sales growth rate. If it's flat, the fix isn't a better formula - it's better pipeline. Prospeo gives you 300M+ profiles with 98% email accuracy and 30+ filters to target the exact buyers who move your number.
Stop diagnosing growth problems. Start solving them with real pipeline.
Formulas in Excel and Sheets
A spreadsheet handles this in seconds. These formulas work identically in Google Sheets.
Simple growth rate (A1 = previous, B1 = current):
=(B1-A1)/A1
CAGR (B1 = starting value, B5 = ending value, n = number of growth periods):
=(B5/B1)^(1/n)-1
Format both cells as percentages. For trend projection, Excel's GROWTH() function fits an exponential curve to historical data and estimates future values - useful for rough forecasting, though it assumes your growth pattern continues unchanged.
What's a Good Sales Growth Rate?
SaaS and Tech Benchmarks
The 2024 numbers tell a clear story: growth is slowing across the board.
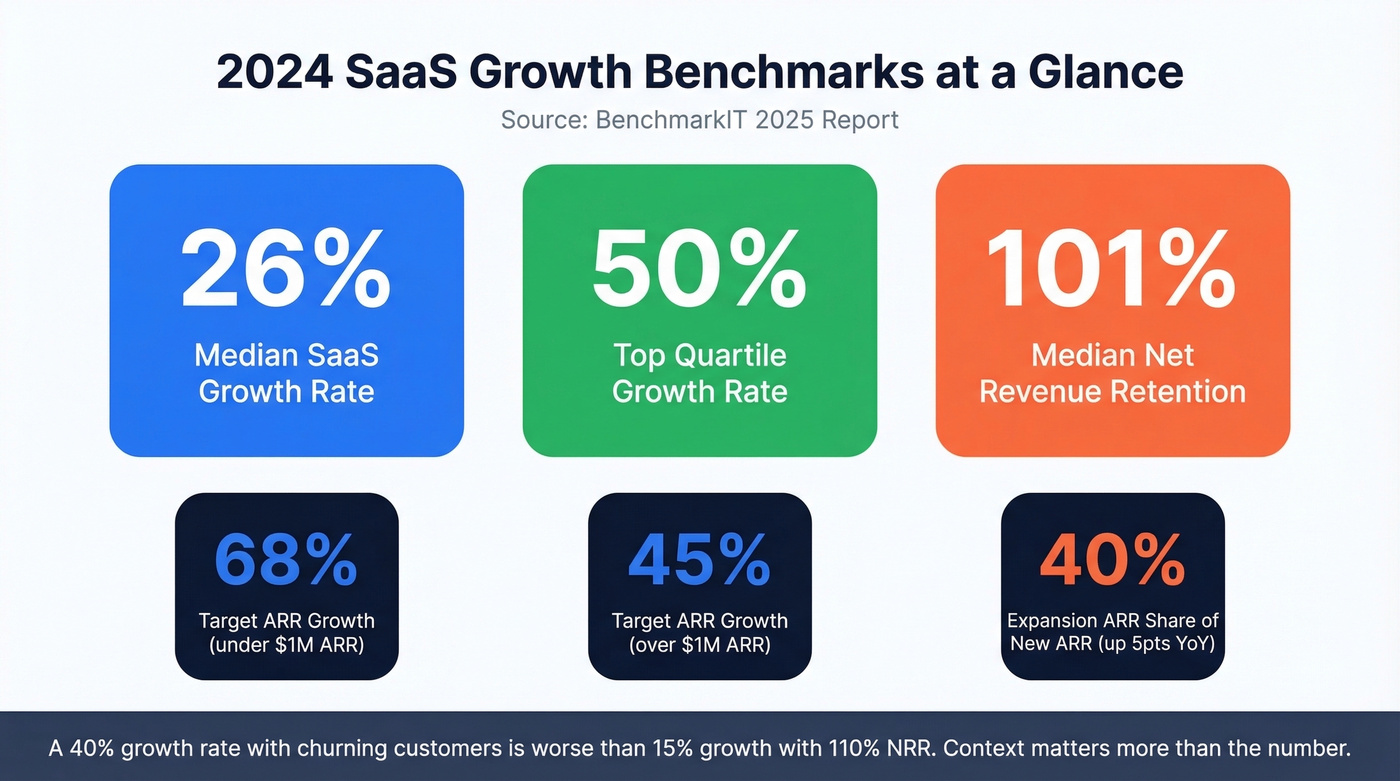
| Metric | Median (2024) | Top Quartile (2024) |
|---|---|---|
| SaaS Growth Rate | 26% | 50% |
| ARR Growth (<$1M) | - | 68% target |
| ARR Growth (>$1M) | - | 45% target |
| Net Revenue Retention | 101% | - |
| New CAC Ratio | $2.00 | $2.82 (4th quartile) |
Top-quartile growth dropped from 60% in 2023 to 50% in 2024. NRR sitting at 101% means expansion revenue is barely covering churn. Expansion ARR now accounts for 40% of total new ARR - up 5 points YoY - which signals that new logo acquisition is getting harder and more expensive.
Stop obsessing over growth rate in isolation. A 40% growth rate built on churning customers is worse than 15% growth with 110% NRR. Some calculator pages cite 15% YoY as "good" - that's a meaningless number without context on company stage, industry, and retention. Growth rate is a symptom, not a diagnosis.
Non-SaaS Industries
Hard benchmarks are scarce outside SaaS. Nobody publishes a "median manufacturing sales growth rate" report with the rigor of BenchmarkIT.
As a practical rule, mature industries like retail and manufacturing often run single-digit to low double-digit YoY growth. High-growth sectors like fintech, healthtech, and climate can hit 20-40%+, but those numbers vary wildly by sub-segment. If you're outside SaaS, benchmark against your direct competitors' public filings or industry association reports rather than chasing a universal "good" number.
Common Calculation Mistakes
Ignoring seasonality. Comparing Q4 holiday spike to Q1 post-holiday slump and calling it a decline isn't analysis - it's noise. Always compare same-period-prior-year: Q3 2025 vs. Q3 2024, not Q3 vs. Q2.
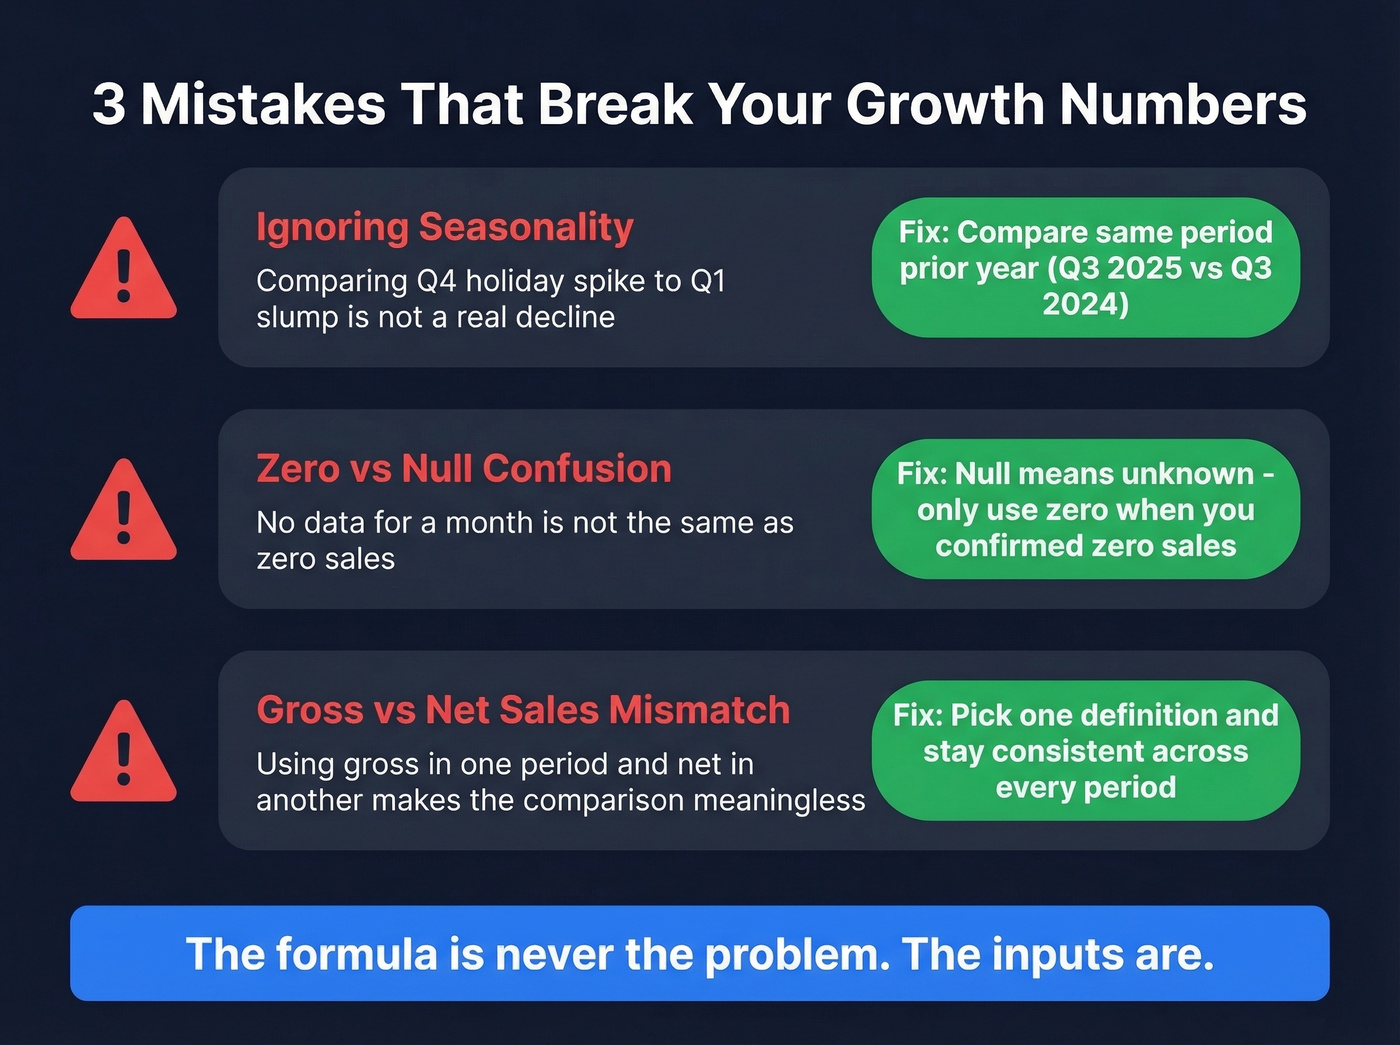
Zero vs. null confusion. A product line with no data for a month isn't the same as a product line with zero sales. Null means "we don't know." Zero means "we know, and it's nothing." Treating nulls as zeros will wreck your growth calculations.
Gross vs. net sales mismatch. If Q1 uses gross sales and Q2 uses net sales after returns and discounts, you're comparing different things. Pick one. Stay consistent across every period.
Here's the thing: bad input data breaks growth forecasts the same way bad prospect data breaks pipelines. The formula is never the problem. The inputs are. If you're seeing issues in your CRM, start with data enrichment and a clean lead generation workflow.
Advanced Use Cases
Reverse-Calculating Prior Period Sales
Sometimes you have the current number and the growth rate, but not the prior period. This comes up often when inheriting messy CRM data or reconciling across systems.
Formula: Previous Period Sales = Current Period Sales / (1 + Growth Rate)
Example: Current sales are $5M, and you know growth was 25%. $5,000,000 / 1.25 = $4,000,000 in the prior period.
Growth Contribution by Segment
When the board asks "where did our growth come from?", this is the formula you need.
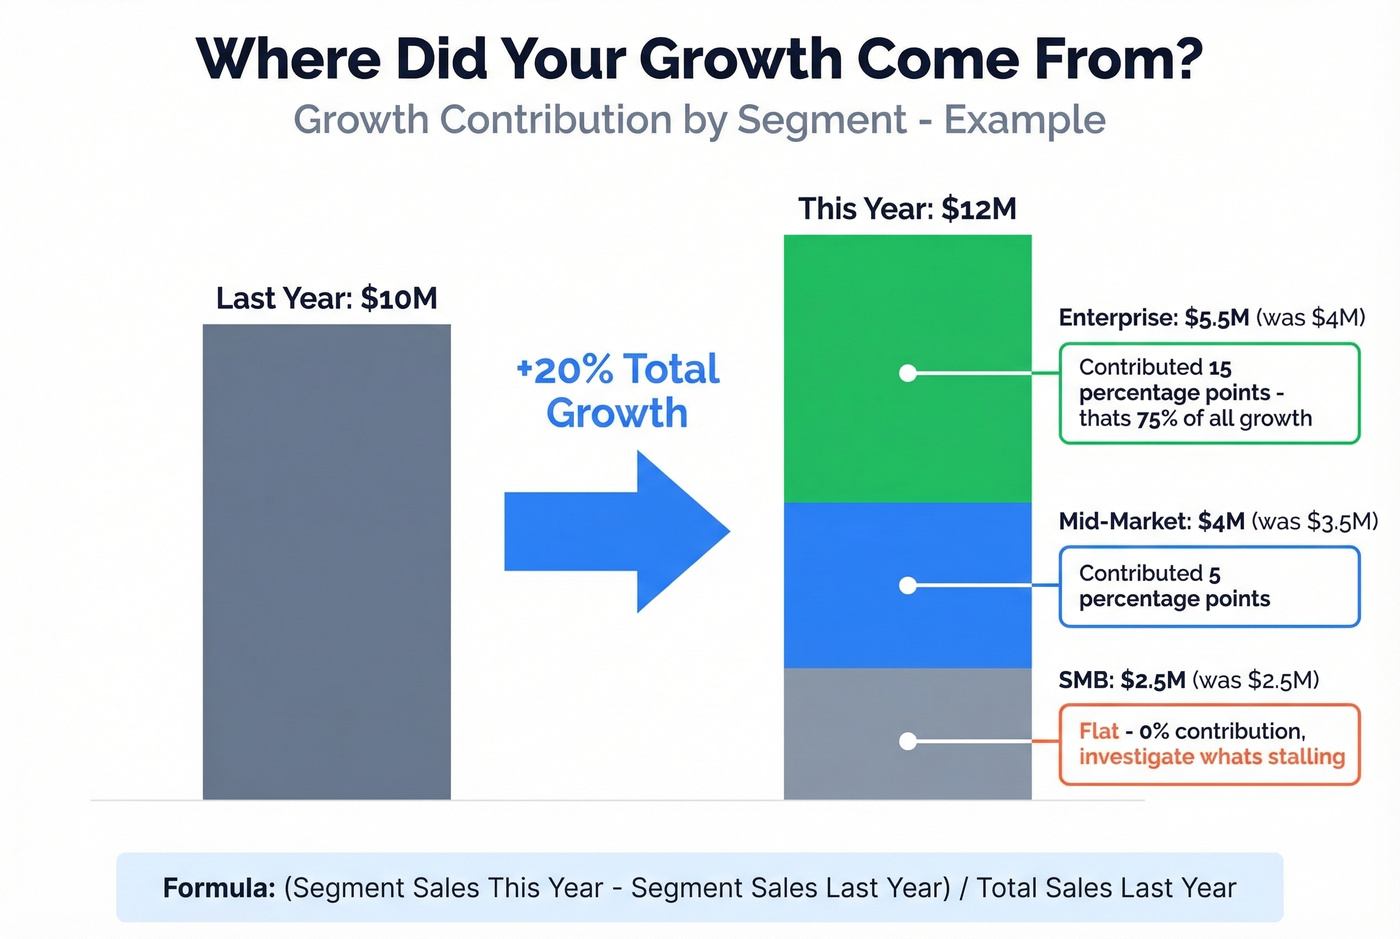
Formula: (Segment Sales This Year - Segment Sales Last Year) / Total Sales Last Year
Example: Total sales grew from $10M to $12M. Enterprise segment went from $4M to $5.5M. ($5,500,000 - $4,000,000) / $10,000,000 = 15% - meaning Enterprise contributed 15 percentage points of the total 20% growth. That's 75% of all growth coming from one segment. Now you know where to double down and where to investigate what's stalling.
Growth Rate Calculated - Now What?
A growth rate is a diagnostic, not a strategy. If the number came back flat or declining, the question is why, and the answer almost always traces back to three levers: lead volume, lead quality, and conversion rate.
Most teams we've worked with discover the bottleneck is upstream. They don't have a closing problem. They have a pipeline problem - not enough qualified prospects entering the funnel, or the ones entering have bad contact data that tanks outreach before it starts. If you need a tighter top-of-funnel system, start with sales prospecting techniques and an ideal customer profile.

I'll be blunt: if your average deal size is above $5K and your growth rate is declining, you almost certainly don't need a better sales methodology. You need better data feeding the top of your funnel. Meritt used Prospeo to triple their pipeline from $100K to $300K per week while dropping bounce rates from 35% to under 4%. That's what happens when the data layer stops being the bottleneck. If bounces are killing your outreach, fix your email bounce rate and your email deliverability before you scale volume.
Bad input data breaks growth calculations. Bad prospect data breaks pipeline. Prospeo refreshes every 7 days - not the 6-week industry average - so your outbound hits real inboxes, not dead ends. Teams book 26% more meetings versus ZoomInfo, starting at $0.01 per email.
Fix the pipeline feeding your growth rate. Start with data you can trust.
FAQ
What's a good sales growth rate for a startup?
Under $1M ARR, 50%+ annually signals product-market fit. Above $1M, 25%+ is strong per BenchmarkIT's 2025 data. Benchmark against your revenue band, not the industry average.
How do I calculate growth if previous period sales were zero?
You can't - division by zero is undefined. Use absolute dollar growth ($0 to $50K = $50K new revenue) instead, or start tracking from the first non-zero period.
What's the difference between CAGR and simple growth rate?
Simple growth rate compares two periods. CAGR smooths multi-year growth into one annualized rate that accounts for compounding. Use simple growth for quick checks and CAGR for investor decks and multi-year analysis.
Skip this if your data is already clean - but what tools help a declining growth rate?
Start with pipeline data quality. If outreach bounces or hits wrong contacts, no strategy fixes that. Prospeo gives sales teams 300M+ professional profiles and 143M+ verified emails at 98% accuracy, with a free tier of 75 credits to test before you commit.