The 12 Sales Growth Metrics That Actually Predict Revenue
69% of reps missed quota last year. Win rates dropped to 19-21%. Sales cycles stretched 24-32% longer in mid-market and up to 36% in enterprise. If your dashboard still tracks 30 KPIs, you're reading a spreadsheet - not running a growth strategy.
Here's the thing: you only need three numbers this quarter. YoY revenue growth rate, net revenue retention, and pipeline velocity. Everything else is supporting detail. Below are the 12 sales growth metrics that predict where your number is headed, with formulas, benchmarks, and the mistakes that warp them.
How to Calculate Sales Growth Rate
The core formula:
YoY Sales Growth = ((Current Year Sales - Previous Year Sales) / Previous Year Sales) x 100
If you closed $1M last year and $1.2M this year, that's 20% growth. Clean, comparable, and the metric your board cares about most.
For month-over-month trends, use Compound Monthly Growth Rate (CMGR) instead of raw MoM, which swings wildly with seasonality. The formula: (Final Month Value / Initial Month Value)^(1 / # of Months) - 1. A company going from 10,000 to 20,000 users over 11 months has a CMGR of 6.5% - much more useful than a single month's spike.
Always compare same-period windows. A 20% QoQ jump in Q4 might just be your annual buying cycle, not real acceleration.
The 12 Metrics That Matter
Revenue Growth
YoY Revenue Growth is the headline number. Median B2B SaaS growth sits at 26%, with top performers pulling 50%. Bootstrapped companies in the $3M-$20M ARR range grow at 20% median, 51% at the 90th percentile. MRR/ARR is the recurring revenue baseline - track net new ARR monthly.
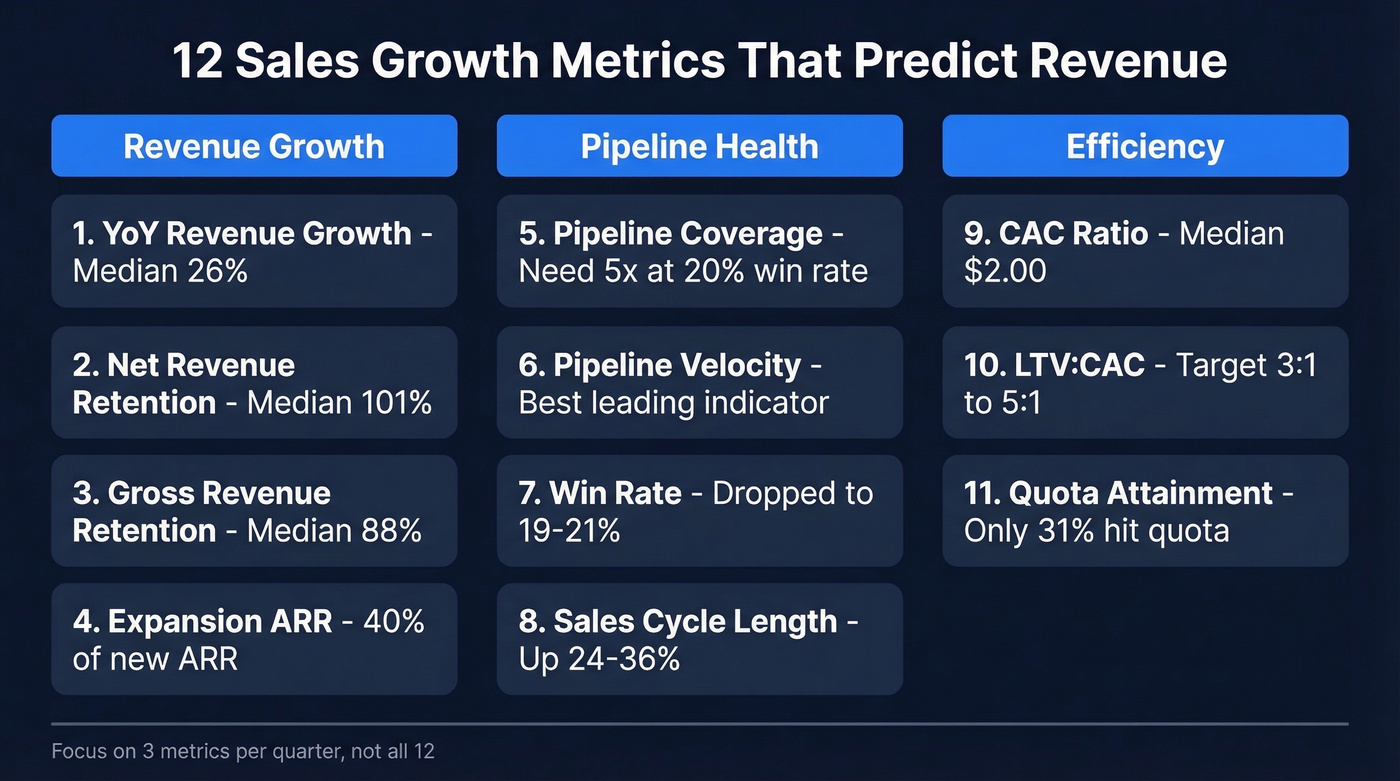
Net Revenue Retention (NRR) is the most important metric most teams ignore. We've talked to dozens of RevOps leaders, and NRR comes up every time as the number they wish their team tracked better. Cohort formula: (MRR from last year's customers still paying today) / (Total MRR from those customers last year). Median NRR is 101%; for $25K-$50K ACV companies, median is 102%, top quartile hits 111%, and the lowest quartile sits at 97%.
Gross Revenue Retention (GRR) strips out expansion - pure churn visibility. GRR can't exceed 100%, and the industry trend is sliding: 90% down to 88% over three years.
Expansion ARR now accounts for 40% of new ARR at median. If your expansion number is flat, you're leaving the cheapest growth on the table. (If you need a clean way to separate churn vs expansion, start with a simple churn analysis.)
Pipeline Health
Pipeline Coverage is total pipeline value divided by quota. At a 20% win rate, you need 5x coverage just to hit plan. Simple math, but we've seen teams celebrate 3x coverage while running a sub-20% close rate. That's a miss waiting to happen.
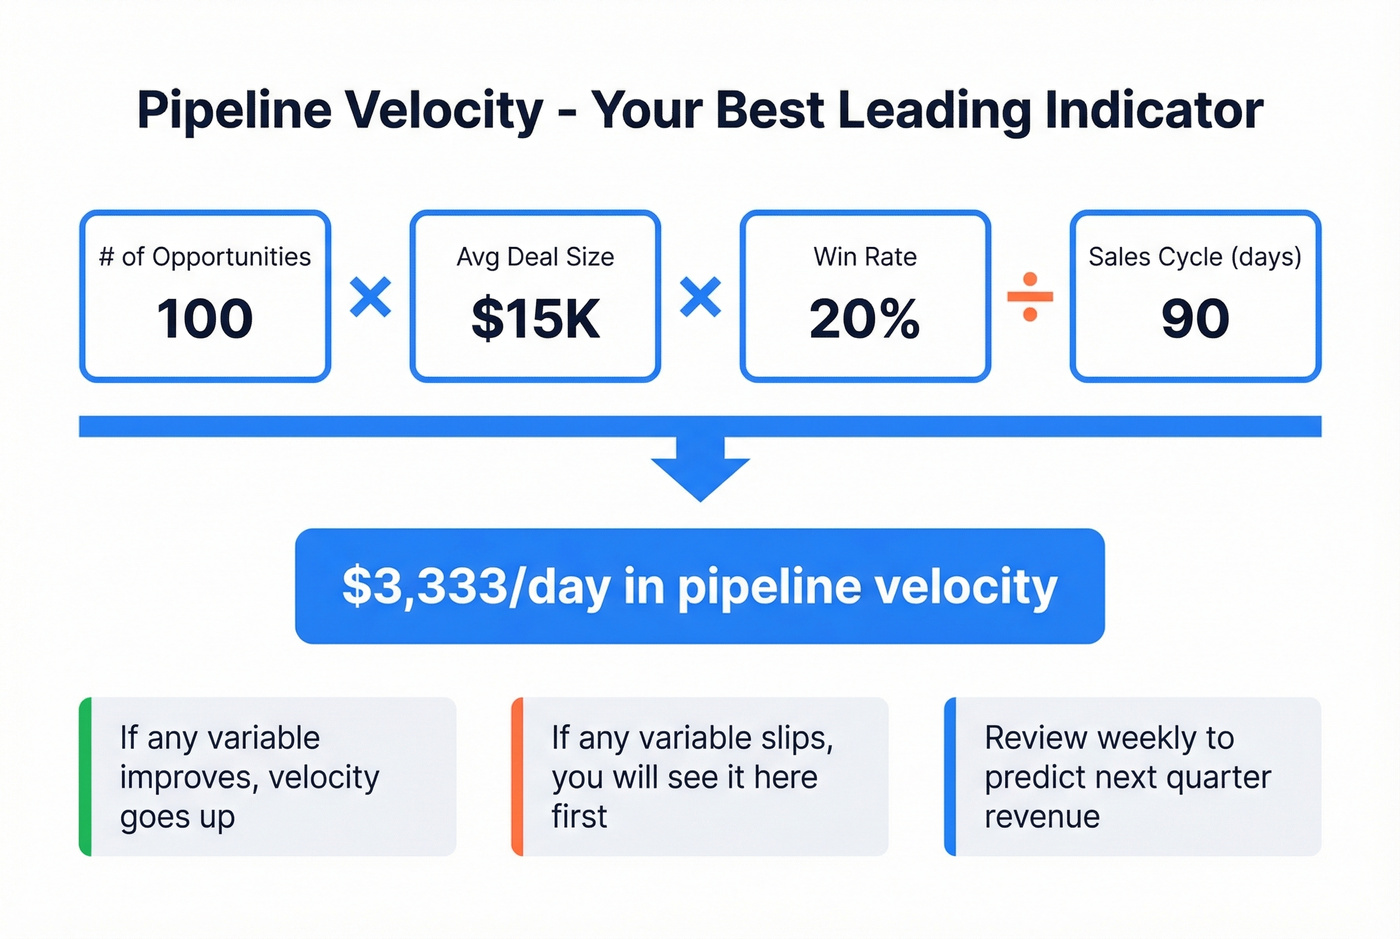
Pipeline Velocity measures how fast deals move through stages. Formula: (# of Opportunities x Average Deal Size x Win Rate) / Sales Cycle Length. A team with 100 deals, $15K average, 20% win rate, and a 90-day cycle has a velocity of about $3,333/day. This is one of the best leading indicators of next quarter's revenue because it captures four variables in a single number - any one of them slipping will show up here before it shows up in closed-won.
Win Rate dropped to 19-21% average in B2B, down from 23% in 2022. Proposal engagement is a leading indicator most teams miss: deals where proposals are opened within 24 hours and get 8+ minutes of read time close at 67%, versus 9% when opened after 5+ days and read for under 2 minutes. (If you're trying to improve this systematically, start with sales process optimization.)
Sales Cycle Length has stretched 24-32% across mid-market and up to 36% in enterprise. Track it by segment, not as a blended average.
Efficiency
Customer Acquisition Cost (CAC) - specifically the New CAC Ratio: Total S&M Spend / New Customer ARR. The median is $2.00; fourth quartile is $2.82. Above that, your unit economics are broken. If you want a tighter definition and variants, use this cost to acquire customer breakdown.
LTV:CAC should land in the 3:1 to 5:1 range. Below 3:1, you aren't recouping fast enough. Above 5:1, you're probably underinvesting in growth.
Quota Attainment is a lagging indicator of broken process, not lazy reps. When 69% of reps miss quota, the problem is systemic - territory design, ICP targeting, data quality. Blaming individual performance is a cop-out.
When 69% of reps miss quota, the problem isn't effort - it's data quality. Bounced emails inflate pipeline coverage, drag down win rates, and stretch sales cycles. Prospeo verifies emails with 98% accuracy on a 7-day refresh cycle, so your pipeline velocity formula reflects real opportunities, not dead records.
Stop measuring growth metrics built on stale contact data.
2026 Benchmarks by Company Stage
Benchmarks only matter if you compare against the right peer group. A VC-funded company at $50M ARR and a bootstrapped company at $5M live in different universes.
| Metric | Median | Top Quartile | Bottom Quartile |
|---|---|---|---|
| YoY Revenue Growth | 26% | 50% | - |
| NRR | 101% | 111%+ | 97% |
| GRR | 88% | 92%+ | - |
| New CAC Ratio | $2.00 | - | $2.82 |
| LTV:CAC | 3:1-5:1 | >4:1 | <3:1 |
| Win Rate | 19-21% | 30%+ | - |
| Quota Attainment | 31% hit | - | - |
Bootstrapped SaaS ($3M-$20M ARR): Growth 20% median / 51% P90, NRR 104%, GRR 92%.
VC-funded companies invest 47% of revenue in sales and marketing versus 33% for PE-backed firms. That gap explains the growth differential - and the CAC bloat.
Mistakes That Distort Your Numbers
We've audited dozens of dashboards. These five mistakes show up every time.
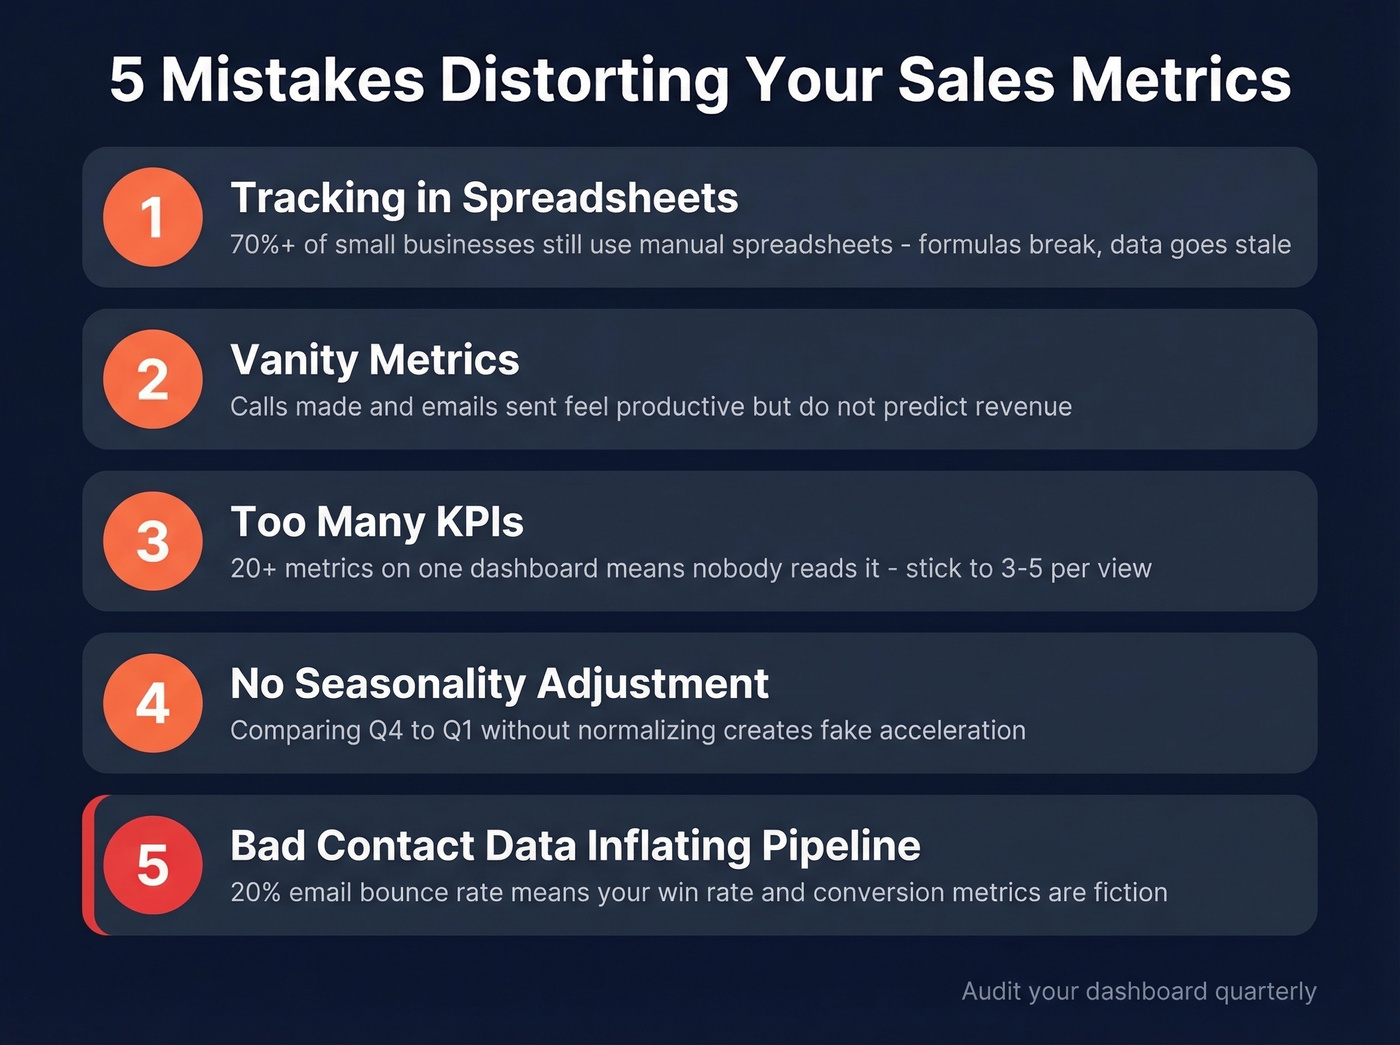
Tracking in spreadsheets. Over 70% of small businesses still rely on manual spreadsheets for sales tracking. Formulas break, data goes stale, and nobody trusts the numbers by month three.
Vanity metrics. Calls made and emails sent feel productive, but they're activity metrics, not growth metrics. Track them for coaching; don't report them to the board. (If you need a clean list of what to track instead, use these sales activities examples.)
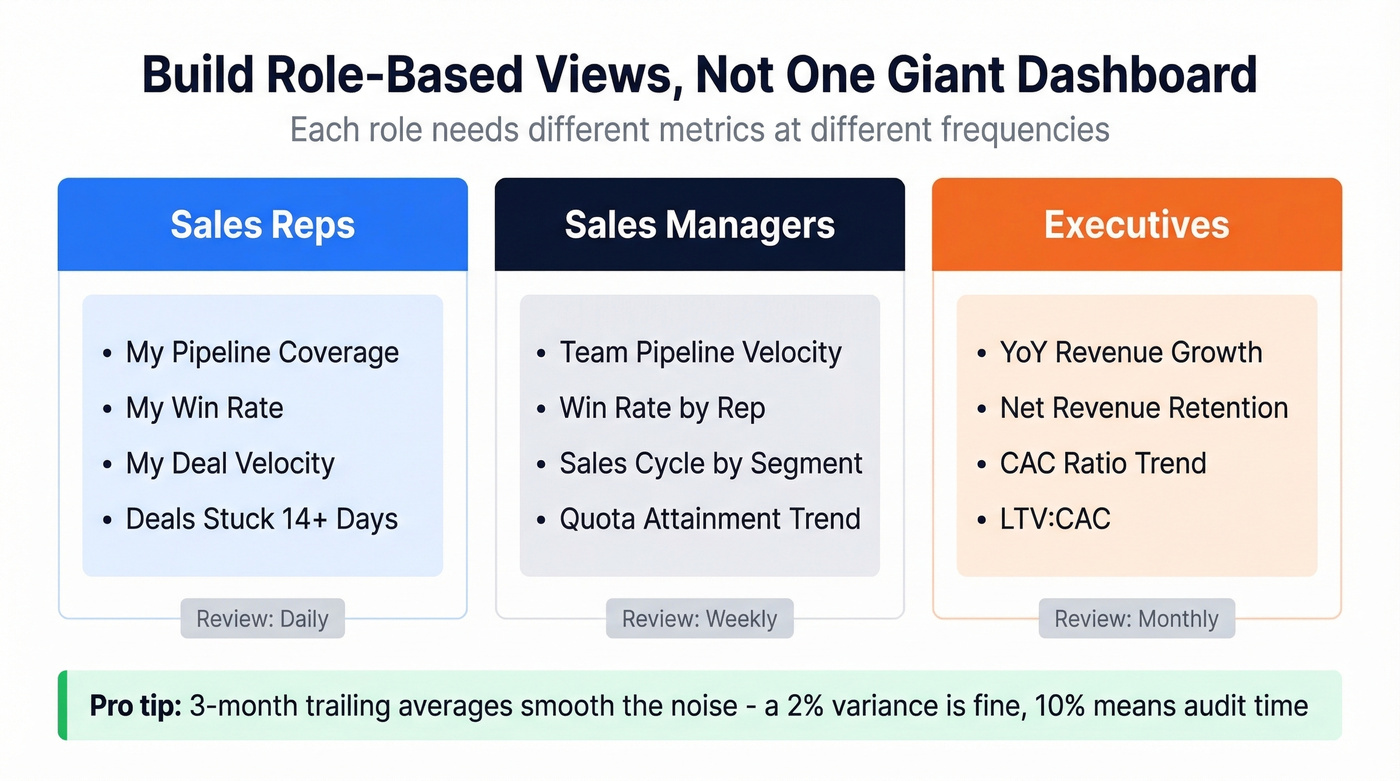
Too many KPIs. If your dashboard has 20+ metrics, nobody reads it. Stick to 3-5 per view, segmented by role.
No seasonality adjustment. Comparing Q4 to Q1 without normalizing is how you convince yourself growth is accelerating when it's just calendar effects.
Bad contact data inflating pipeline. This one's frustrating because it's invisible until you dig in. If 20% of the emails in your CRM bounce, your win rate and conversion metrics are fiction. The pipeline looks full, but it's padded with dead records that were never going to convert. Prospeo verifies emails in real time with 98% accuracy and refreshes data every 7 days, so your pipeline numbers reflect reality instead of stale contacts.
Tracking Without Drowning in Dashboards
Use trailing 3-month moving averages to smooth noise. A 2% variance between your dashboard and source data is acceptable - 10% means you need an audit. Build role-based views: reps see their own pipeline, managers see team performance, execs see trends.
For tooling, Databox runs ~$49/mo, Power BI is $10/user/mo, and Tableau is $75/user/mo. But before building dashboards, clean your data. Prospeo's enrichment API returns 50+ data points per contact at a 92% match rate - start with the free tier to audit your pipeline quality before spending on visualization. If you're comparing vendors, this list of data enrichment services can help.
Let's be honest: if your average deal size is under $10K, you don't need a $75/user BI tool. A clean spreadsheet with verified data will outperform a fancy dashboard built on garbage contacts every single time.
The right sales growth metrics don't just tell you where revenue has been - they tell you where it's going. Pick the three that matter most for your stage, clean the data feeding them, and review weekly. Everything else is noise.
Your CAC ratio and LTV:CAC benchmarks mean nothing if 20% of your pipeline contacts bounce. Prospeo's enrichment API returns 50+ data points per contact at a 92% match rate - starting at $0.01/email. Audit your CRM before you build another dashboard.
Every metric on this page gets more accurate when your data does.
FAQ
What's a good sales growth rate?
Median B2B SaaS growth is 26% YoY; bootstrapped companies at $3M-$20M ARR grow at 20% median, 51% at the 90th percentile. Below 20%, investigate retention and pipeline quality before assuming it's a demand problem.
What's the difference between sales metrics and KPIs?
Metrics are any measurable data point - calls logged, emails sent, demos booked. KPIs are the subset tied to strategic goals: revenue growth, NRR, win rate. Track metrics for rep coaching; report KPIs to leadership for resource decisions.
How do I fix inaccurate pipeline metrics?
Start with data quality. Invalid emails and dead phone numbers inflate coverage and deflate conversion rates. Standardize how reps log deal stages, audit your CRM quarterly for duplicates, and run your contact list through a verification tool to strip out records that shouldn't be there.