How to Design a Sales Incentive Plan That Actually Works
It's three weeks before Q4 planning closes. The CRO walks into your office and says, "We need to redesign comp. The plan isn't working." You know what that actually means: reps are leaving, quota attainment is down, and nobody trusts the numbers on their paystub. Sales turnover runs around 35% - nearly three times the 13% average across all industries average across all industries. A broken sales incentive plan is usually the accelerant.
Most comp design guides give you zero actual numbers. This one does.
What You Need (Quick Version)
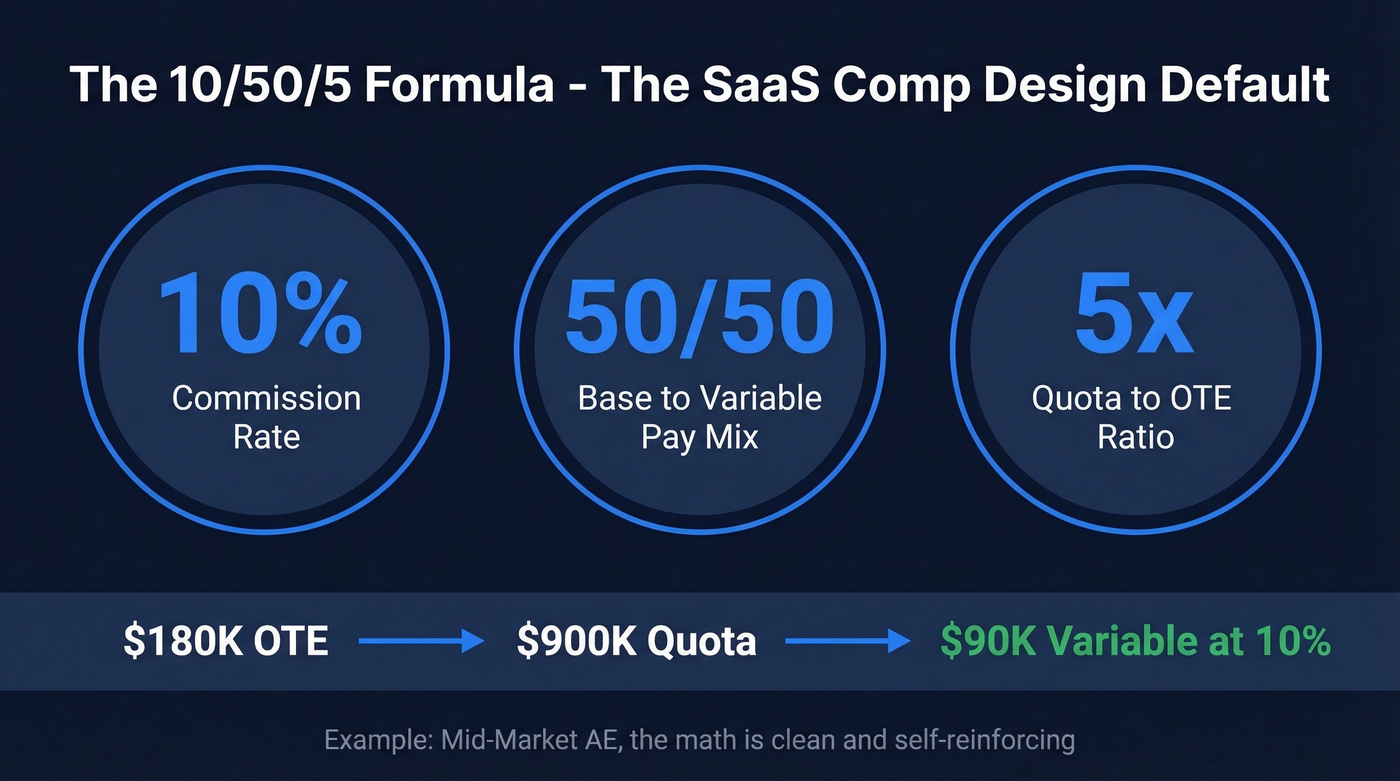
- Start with the 10/50/5 formula: 10% commission rate, 50/50 base-to-variable pay mix, 5x Quota-to-OTE ratio. It's the SaaS default for a reason.
- Keep it to 2-3 core components - if your plan fails the napkin test (can a rep explain it in 30 seconds?), simplify it.
- Benchmark OTE by role using the ranges below. Stop guessing. (If you need the definition and math, see OTE.)
- Stress-test your payout curves before launch - model what happens at 80%, 100%, 130%, and 150% attainment.
- Clean your pipeline data first - your plan is only as fair as your CRM. Stale contacts and bounced emails mean reps get credited based on garbage. (More on pipeline health metrics.)
What Is a Sales Incentive Plan?
A sales incentive plan is the complete design governing how variable compensation gets earned, calculated, and paid. It's not just commission. It includes pay mix, thresholds, accelerators, caps, SPIFFs, measurement windows, and governance rules.
HBR frames sales compensation as often the largest line item in B2B sales budgets - and the primary lever leaders reach for when performance slips. Across industries, 71% of organizations tie compensation directly to measurable performance goals. The question isn't whether to pay for performance. It's whether the incentives your sales teams actually receive reward the right behaviors.
Why Comp Design Matters in 2026
Here's the scenario that plays out every quarter at companies with broken comp plans: your best AE - the one carrying 130% of quota - quits. In the exit interview, they say the plan was confusing, the accelerators kicked in too late, and they couldn't tell if their paycheck was right.
You've now lost a $250K+ OTE producer. Backfilling that role takes two or more quarters when you factor recruiting, ramp, and the pipeline gap. The cost isn't just the recruiter fee. It's the revenue you don't close.
Companies with best-in-class incentive plans see 20% higher lead closure rates than industry averages, per Aberdeen Group research. That's not a marginal improvement - it's the difference between a team that hits plan and one that doesn't.
The frustration from RevOps teams is consistent: reps sandbagging deals into next quarter because the cap kicks in too early, attribution disputes when two reps touched the same account, and payout errors that take weeks to resolve. That 35% turnover stat isn't a recruiting problem. It's a comp design problem disguised as an HR metric.
Incentive Plan Types Compared
Not every plan is a straight commission check. The right structure depends on your sales motion, deal complexity, and what behaviors you're trying to drive. Only 1 in 3 sales leaders actually align incentives with organizational goals - which means two-thirds are running plans that reward the wrong things.
| Plan Type | How It Works | Best For | Risk Level |
|---|---|---|---|
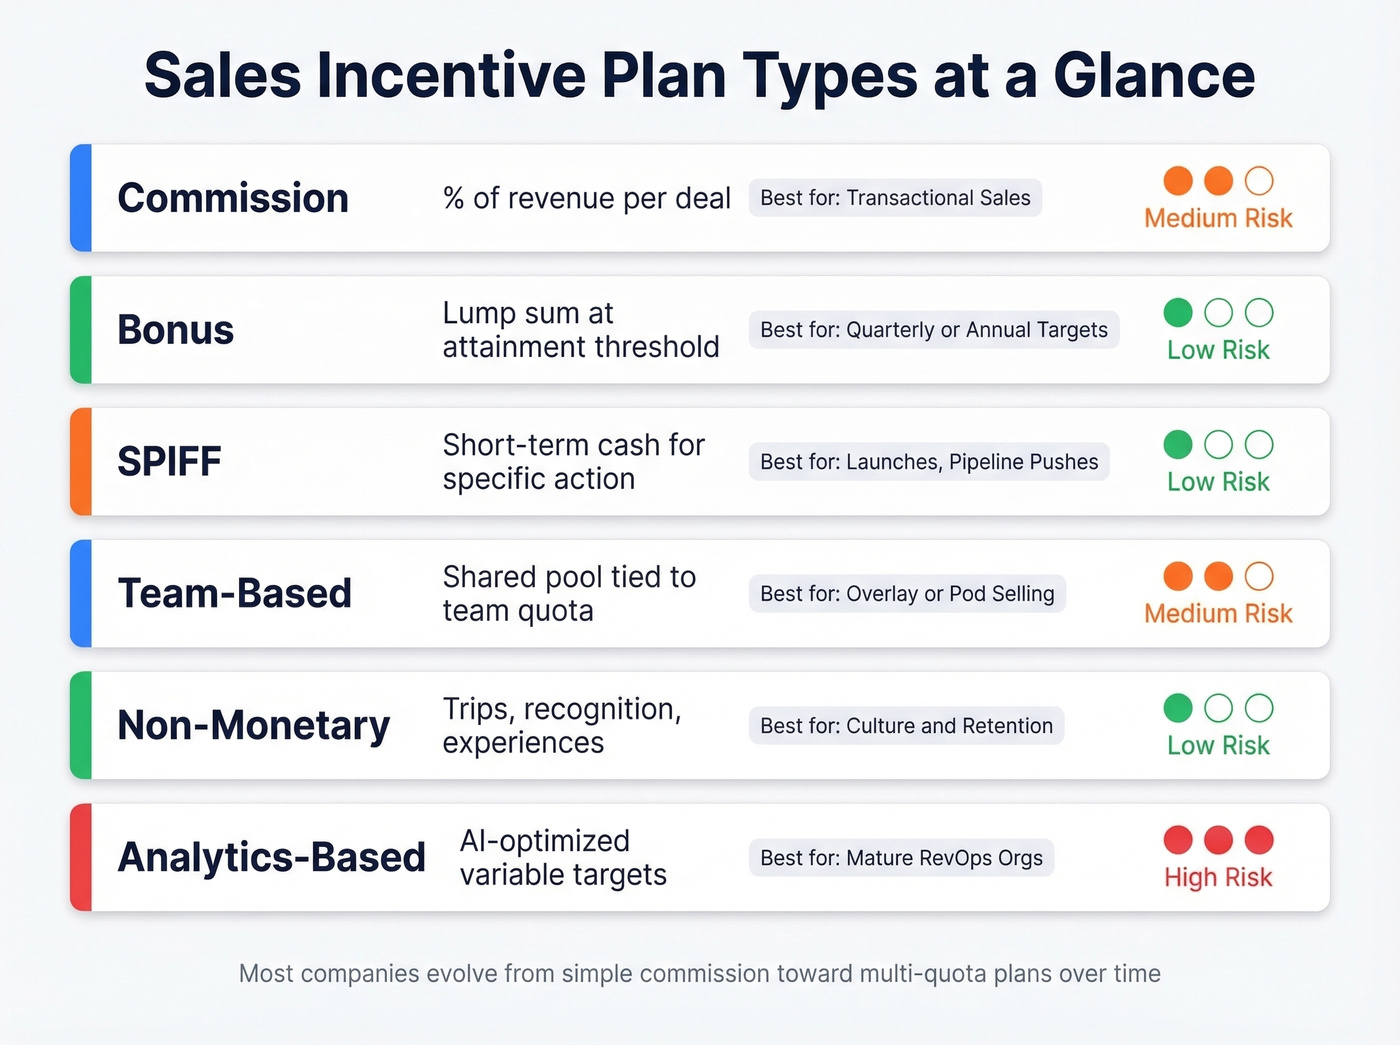
| Commission | % of revenue/ACV per deal | Transactional sales | Medium |
| Bonus | Lump sum at attainment threshold | Quarterly/annual targets | Low |
| SPIFF | Short-term cash for specific action | Launches, pipeline pushes | Low |
| Team-Based | Shared pool tied to team quota | Overlay/pod selling | Medium |
| Non-Monetary | Trips, recognition, experiences | Culture + retention layer | Low |
| Analytics-Based | AI-optimized variable targets | Mature RevOps orgs | High |
Most companies evolve through a progression: simple commission, then commission with threshold, then threshold plus accelerator, then threshold plus accelerator plus regressive cap, and finally multi-quota plans. For complex orgs, territory-based splits, presales stage incentives, and overlay structures add another layer - but get the core right first.
CaptivateIQ offers three free templates (attainment bonus, commission rate, and multi-KPI) that are the best free starting point if you're building from scratch.
Let's be honest: stop copying other companies' comp plans. Start with your unit economics, not market data. The benchmarks below are guardrails, not blueprints. If your average deal size is under $15K, you probably don't need the same plan architecture as a company selling six-figure enterprise deals.
2026 Benchmarks: OTE, Pay Mix, and Commissions
These ranges reflect mid-market tech/SaaS norms. If you're in a different vertical, adjust accordingly - but the ratios hold surprisingly well across B2B.
| Role | OTE Range | Pay Mix (Base/Variable) | Typical Commission |
|---|---|---|---|
| SDR/BDR | $75K-$95K | 65/35 | Per-meeting or per-SQL |
| SMB AE | $110K-$150K | 50/50 | 8-12% of ACV |
| Mid-Market AE | $160K-$230K | 50/50 | 8-12% of ACV |
| Enterprise AE | $260K-$360K+ | 50/50 | 8-10% of ACV |
| AM/CSM | $100K-$140K | 70/30 or 80/20 | 3-5% of renewal/expansion |
AM/CSM comp is shifting fast. Leading orgs now tie variable pay to net revenue retention and expansion revenue rather than flat renewal rates - reflecting the strategic priority of growing existing accounts, not just keeping them.
The 5x Quota-to-OTE heuristic is the fastest sanity check in comp design. A mid-market AE at $180K OTE should carry a $900K quota. At a 10% commission rate, that's $90K in variable comp - matching the 50/50 pay mix. The math is clean and self-reinforcing.
Commission rates vary by industry: SaaS runs around 10%, real estate and financial services land between 10-20%, and retail or manufacturing typically sits at 1-5%. The 10% cost-of-sales rule is a useful ceiling - if total sales comp exceeds 10% of revenue, your plan is too generous or your quotas are too low.
One more nuance on geo adjustments: Tier 2 markets typically warrant a 10-15% downward adjustment on OTE, though remote work is flattening these differences fast. If you're hiring remote AEs in Austin at San Francisco OTEs, you're overpaying - but you're also winning the talent war.
You just read it: your comp plan is only as fair as your CRM. Stale contacts mean reps get credited on garbage data - and that fuels the attribution disputes and payout errors driving 35% turnover. Prospeo refreshes every record every 7 days with 98% email accuracy, so pipeline data actually reflects reality.
Fix the data before you redesign the comp plan.
How to Build Your Plan: 4 Core Pillars
The eight standard components of incentive design cluster into four pillars. Here's how to work through each.
Compensation Philosophy
Before you touch a spreadsheet, write a compensation philosophy statement. This isn't corporate fluff - it's the decision framework that prevents arguments later. Korn Ferry's framework recommends addressing five elements: who owns the plan, how it links to business objectives, where you position pay relative to market, how aggressively you reward over-performance, and what timing rules govern payouts.
Think of it as a constitution for comp decisions. When the VP of Sales wants to add a fourth KPI mid-quarter, you point to the philosophy. When Finance asks why you're paying 2x accelerators above 130%, you point to the philosophy. Without it, every comp conversation becomes a political negotiation.
Pay Level, Mix, and Structure
These are components one through three of any incentive plan. Pay level is total cash comp at target. Pay mix is the base-to-variable split. Plan structure determines whether you're running a pure commission model, a quota-based bonus, or a hybrid.
The benchmarks above give you the market ranges. Position within them based on three factors: how much influence the rep has over the outcome (more influence means more variable), how competitive your talent market is (hotter markets demand higher OTE), and how long your sales cycle runs. Longer cycles need more base pay to keep reps financially stable during dry spells.
Pay Curves and Accelerators
This is where plans get interesting - and where most companies screw up. Pay curves define what happens below quota, at quota, and above quota. Gates, slopes, accelerators, and caps all live here.
We've seen too many plans that are generous at target but punitive below it, creating a cliff effect where reps at 79% attainment earn dramatically less than reps at 81%. That's demoralizing and it drives sandbagging.
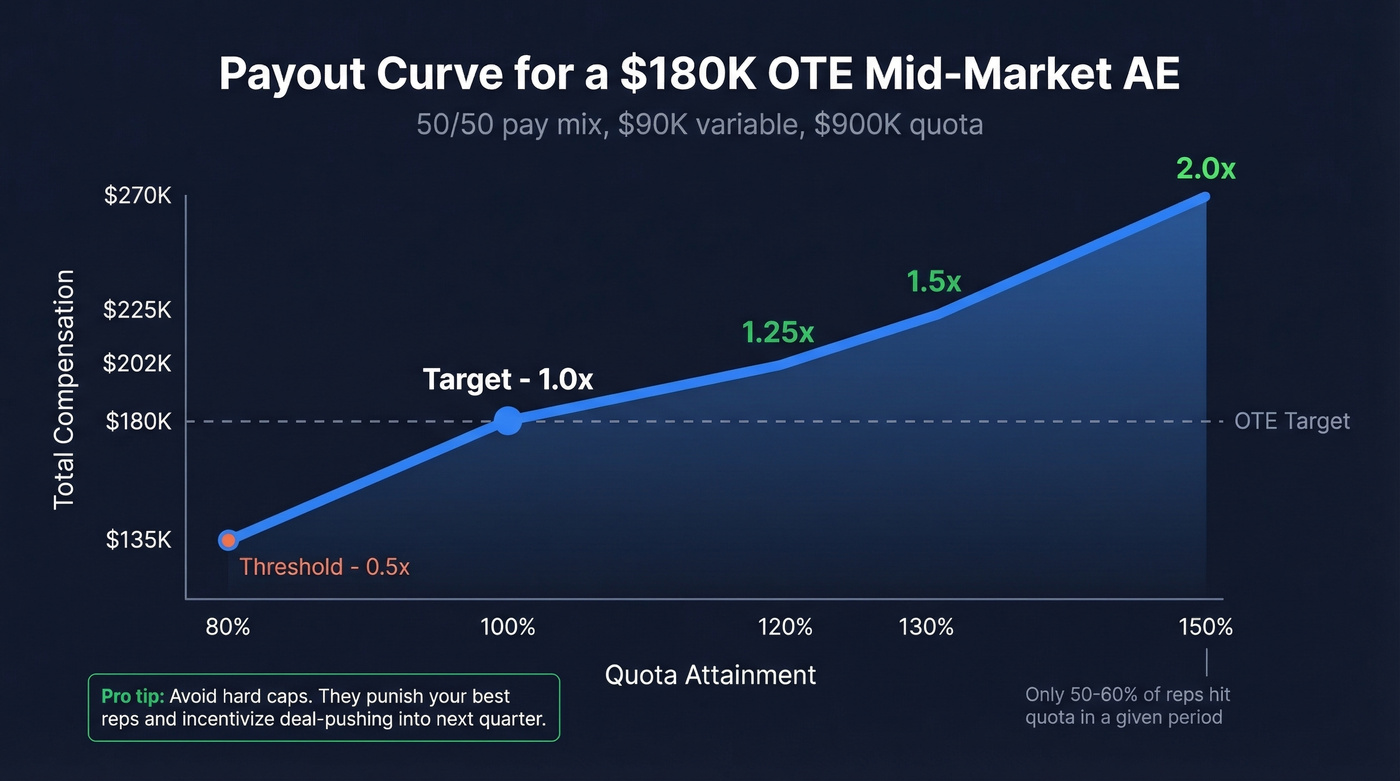
Here's a worked payout table for a mid-market AE at $180K OTE (50/50 mix, $90K variable, $900K quota):
| Attainment | Quota Credit | Multiplier | Variable Payout | Total Comp |
|---|---|---|---|---|
| 80% (threshold) | $720K | 0.5x | $45,000 | $135,000 |
| 100% (target) | $900K | 1.0x | $90,000 | $180,000 |
| 120% | $1.08M | 1.25x | $112,500 | $202,500 |
| 130% (stretch) | $1.17M | 1.5x | $135,000 | $225,000 |
| 150%+ (cap zone) | $1.35M+ | 2.0x | $180,000 | $270,000 |
Estimated accelerator norms for SaaS: 1.0x at quota, 1.25-1.5x from 100-130%, and 2.0x+ at stretch. We'd argue against hard caps in most cases - they punish your best performers and incentivize deal-pushing into next quarter. If you must cap, set it at 200%+ attainment so it rarely triggers.
Only about 50-60% of reps hit quota in a given period. Your payout curve needs to be motivating for the 40-50% who are below target, not just rewarding for the top 20%.
Measures, Periods, and Payouts
Korn Ferry breaks measures into four categories: financial/production (heaviest weight), strategic (customer or product mix), activity (milestones for long cycles), and subjective/judgment (use sparingly). Revenue-only plans are lazy and expensive. They erode margins by 15-20% as reps chase volume over value. Balanced scorecards with 4-6 KPIs deliver 35% better long-term performance.
Measurement windows should match your sales cycle. Monthly payouts work for transactional sales with 15-30 day cycles. Quarterly is better for mid-market deals. Enterprise plans often blend quarterly draws with annual true-ups.
If your rep needs a calculator to figure out their paycheck, your plan is broken. The napkin test isn't optional - it's the single best predictor of whether reps will trust and engage with the plan.
7 Mistakes That Kill Incentive Plans
1. One-size-fits-all across roles. An SDR booking meetings and an enterprise AE closing $500K deals need fundamentally different incentive designs. Skip the "universal plan" fantasy.
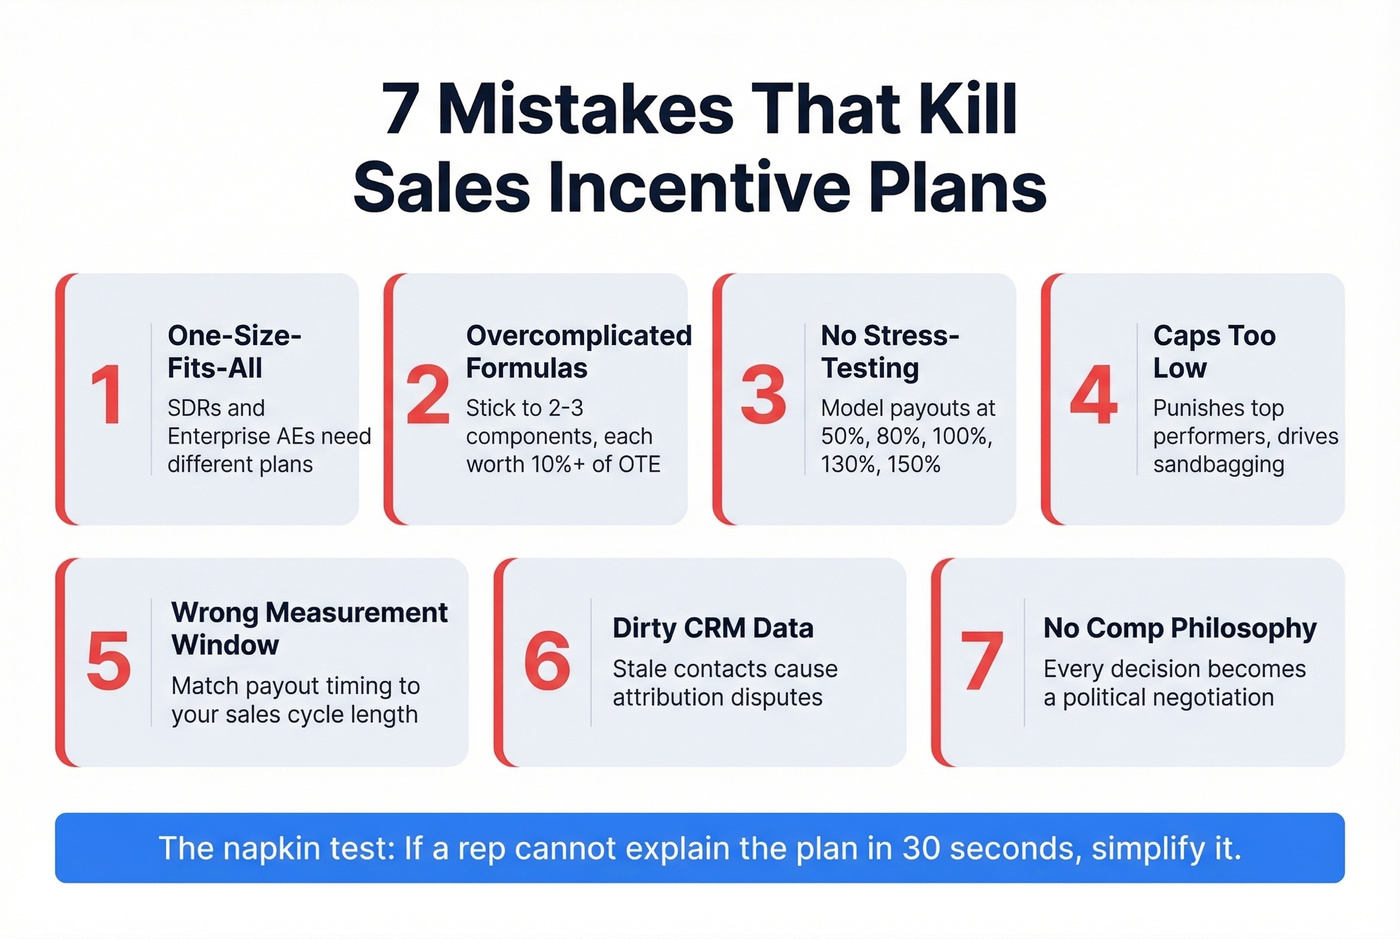
2. Overcomplicated formulas. Limit your plan to 2-3 core components, each worth at least 10% of OTE. If a component is worth less than 10%, it won't change behavior - it'll just confuse people.
3. No stress-testing. Model your plan at 50%, 80%, 100%, 130%, and 150% attainment before launch. We've seen plans where the threshold was mathematically unreachable given territory sizes, and plans where the cap triggered so early that top reps earned less per deal above 110%. Both are fixable - but only if you catch them before reps see their first paycheck.
4. Incenting metrics you can't trust. This is the silent killer. Your comp plan pays reps based on pipeline data, but if that data is stale, attribution gets messy fast. Reps get credited for contacts who've changed jobs, emails that bounce, or accounts already in conversation with another rep. Prospeo fixes this upstream: 98% email accuracy with a 7-day refresh cycle keeps your contact data current, so your CRM reflects real pipeline instead of a six-week-old snapshot. (If you're auditing your stack, start with data enrichment.)

5. Ignoring compliance. Clawback policies, pay transparency laws, and wage/hour regulations vary by state and country. Get legal involved early, not after a dispute.
6. Poor communication. A 40-page comp plan PDF that nobody reads isn't communication. Run enablement sessions. Build a one-page summary. Record a Loom walkthrough. Transparency in comp plans reduces disputes by up to 40%, and the 3-8% manual payout error rate means reps already don't trust the math.
7. No mid-cycle governance. Plans need quarterly reviews, not annual ones. Market conditions shift, product launches change deal dynamics, and territories get rebalanced. Build a governance cadence that catches problems before your best AE's exit interview.
Measuring Incentive Plan ROI
The formula is straightforward:
ROI = (Incremental Profit - Program Costs) / Program Costs
Your team closed $2.4M last quarter under the old plan. Under the new plan, they close $3.1M. Incremental revenue: $700K. At a 70% gross margin, that's $490K in incremental profit. Total program costs (commissions, bonuses, SPIFFs, admin, software) were $320K. ROI = ($490K - $320K) / $320K = 53%.
Use historical performance or a control group to establish a clean baseline. Adjust for seasonality - a Q4 spike isn't necessarily your new plan working.
Hidden costs catch most teams off guard. Manual tracking carries a 3-8% payout error rate. Audit compliance runs roughly $10K per 50 payees. The 80/20 budget rule - 80% on rewards, 20% on administration - is a useful guardrail. If admin costs creep above 20%, you're either over-engineering the plan or under-investing in software.
Beyond raw revenue, track SaaS health metrics: CAC payback under 12 months, NRR above 110%, and compliance scores above 95%. Revenue-only measurement is a trap - it looks great on a dashboard while margins quietly erode. (If you need a baseline, start with sales conversion rate benchmarks.)
2026 Trends Reshaping Incentive Comp
The ICM software market is growing at 14% CAGR, and 44% of companies now use AI-powered tools to automate payout calculations. Personalization at scale is the headline trend: instead of one plan per role, leading orgs build modular plans where reps see real-time earnings dashboards and model "what-if" scenarios against their pipeline.
Comp design is no longer a Finance-only exercise. The best teams co-own it across RevOps, Finance, and HR, with emphasis on audit-readiness and ROI traceability. Incentives are increasingly tied to strategic outcomes - renewals, churn reduction, multi-year contracts - not just new logo revenue. (Related: sales performance management.)
The counterarguments are worth hearing, though. Real-time dashboards can create short-term focus, with reps optimizing for today's payout instead of next quarter's pipeline. Personalized plans raise equity-vs-equality tensions that HR teams aren't always ready to navigate. AI-optimized targets sound great until reps don't trust the algorithm setting their quota.
The companies winning at comp design in 2026 aren't the ones with the most sophisticated tools. They're the ones with the clearest philosophy.
Tools and Templates
Free templates: CaptivateIQ's three downloadable plans (attainment bonus, commission rate, multi-KPI) are the best free starting point. They won't match your exact motion, but they'll give you a structure to customize.
ICM software: CaptivateIQ, Xactly, Spiff, or any modern ICM platform beats spreadsheets. Expect $20-100/user/month at mid-market scale. The 3-8% manual error rate alone justifies the cost. Pick one that integrates with your CRM and has self-serve dashboards for reps. (If you're also tightening forecasting, compare sales forecasting solutions.)
Pipeline data hygiene: Your sales incentive plan is only as fair as the data underneath it. Prospeo handles the upstream problem - CRM and CSV enrichment returning 50+ data points per contact, with a 7-day refresh cycle. Free tier available, no contracts. If reps are getting credited based on stale contacts, fix the data layer before you redesign the comp plan. (More options: data enrichment services.)
A $250K+ AE quitting over a broken comp plan is painful. An AE missing quota because half their prospect list bounces is preventable. Prospeo delivers 143M+ verified emails at $0.01 each - so reps spend time closing, not chasing dead contacts that inflate pipeline and distort attainment numbers.
Give your reps data worth commissioning against.
FAQ
What's the difference between a sales incentive plan and a commission plan?
A commission plan is one component of a broader incentive plan. The full architecture includes pay mix, thresholds, accelerators, caps, SPIFFs, measurement windows, and governance rules. You can have an incentive plan with no commission at all - pure bonus structures exist in many enterprise sales orgs.
How often should you redesign your comp plan?
Review quarterly, redesign annually. Mid-cycle changes should be rare and communicated with at least 30 days' notice. Major redesigns align with fiscal year planning so reps have a full period to adjust behavior.
What tools help automate incentive compensation management?
ICM platforms like CaptivateIQ, Xactly, and Spiff handle payout calculations, dashboards, and audit trails - expect $20-100/user/month. For the upstream data problem, ensuring your CRM contacts are accurate so reps get credited fairly, Prospeo verifies emails at 98% accuracy with a 7-day refresh cycle. Free tier with 75 credits, no contracts.
What's a good quota-to-OTE ratio?
5x is the standard benchmark for SaaS. A rep with $180K OTE should carry a $900K quota. Ratios below 4x signal quotas are too easy; above 6x means you're likely setting reps up to fail. Adjust based on deal size, win rate, and sales cycle length.