5 Sales Projection Examples You Can Copy and Use
82% of business failures trace back to poor cash flow management - and bad projections are how cash flow surprises happen. Only 1% of firms hit their forecasts exactly; 22% land within +/-5%. If you've been looking for a sales projection example with real numbers you can actually adapt, here are five - complete with monthly tables, the formulas behind them, and the mistakes that'll wreck your accuracy if you ignore them.
Pick Your Method First
Match your method to your data:
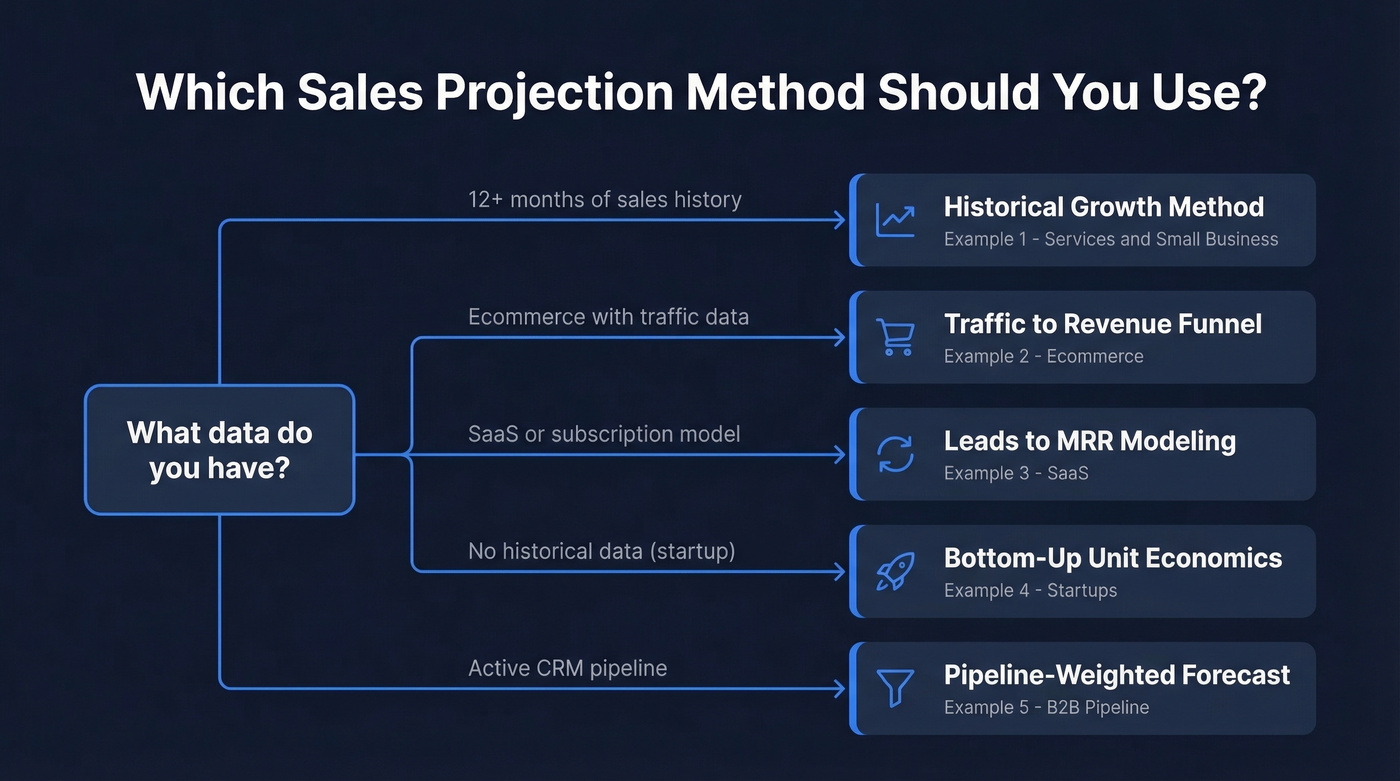
- 12+ months of sales history - Historical growth (Example 1)
- SaaS or pipeline-heavy B2B - Pipeline-weighted (Example 5)
- Startup with no history - Bottom-up unit economics (Example 4)
- Ecommerce - Traffic-to-revenue conversion chain (Example 2)
- Subscription business - Leads-to-MRR modeling (Example 3)
What Is a Sales Projection?
People use "budget," "forecast," and "projection" interchangeably. They shouldn't. Per the Corporate Finance Institute, each serves a different purpose:
| Term | Definition | Purpose | Timeframe | Flexibility |
|---|---|---|---|---|
| Budget | Spending plan with targets | Resource allocation | Annual | Static |
| Forecast | Prediction from trends | Operational planning | 1-12 months | Updated regularly |
| Projection | Scenario-based estimate | Strategic "what if" | 1-5+ years | Multiple scenarios |
Projections are the most flexible of the three. You're not committing to a number - you're modeling what revenue looks like under different assumptions. That's why they're the right tool for fundraising, capacity planning, and board conversations.
Core Formulas Behind Every Projection
Four formulas cover every example below. Each fits a different business model and data situation.
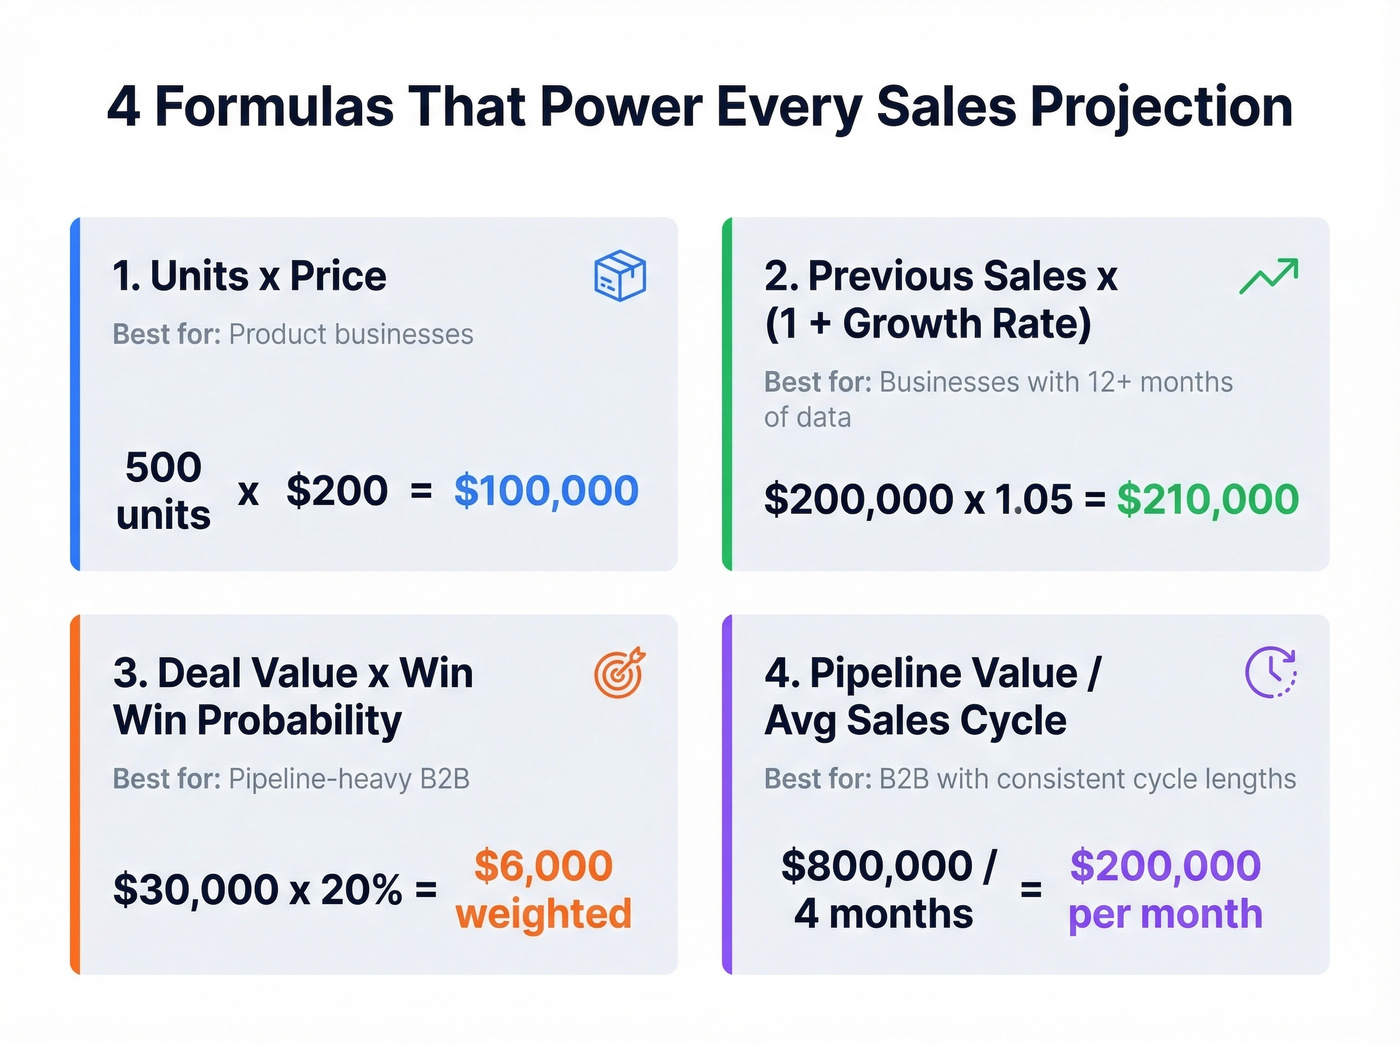
1. Units x Price. Sell 500 units at $200 each, projected revenue = $100,000. Works for product businesses with predictable unit volume.
2. Previous Sales x (1 + Growth Rate). Last quarter was $200,000 and you're growing at 5%? Next quarter = $200,000 x 1.05 = $210,000. Requires at least 12 months of data.
3. Deal Value x Win Probability. A $30,000 deal at 20% probability = $6,000 in weighted forecast. Sum your weighted values for total projected revenue.
4. Pipeline Value / Avg Sales Cycle. $800,000 in qualified pipeline / 4-month average sales cycle = $200,000/month in projected revenue. Great for B2B teams with consistent cycle lengths.
Once you've got enough historical data, consider regression analysis to identify which variables actually drive revenue. Until then, these four formulas cover 90% of use cases.
5 Complete Sales Projection Examples
Example 1: Small Business / Services (Historical Growth)
You run a consulting firm that did $420,000 last year - roughly $35,000/month. You've been growing at about 2% month-over-month, and you expect that to hold. The formula: take last month's revenue and multiply by 1.02.
| Month | Revenue | Growth |
|---|---|---|
| Jan | $35,000 | - |
| Feb | $35,700 | 2.0% |
| Mar | $36,414 | 2.0% |
| Apr | $37,142 | 2.0% |
| May | $37,885 | 2.0% |
| Jun | $38,643 | 2.0% |
| Jul | $39,416 | 2.0% |
| Aug | $40,204 | 2.0% |
| Sep | $41,008 | 2.0% |
| Oct | $41,828 | 2.0% |
| Nov | $42,665 | 2.0% |
| Dec | $43,518 | 2.0% |
| Annual | $469,423 | - |
Copy this into Google Sheets: Column A = Month, Column B = Revenue (B2 = 35000, B3 = =B2*1.02), Column C = Growth (C3 = =(B3-B2)/B2). Drag B3:C3 down to row 13. This layout doubles as a monthly sales projection template - just swap in your own starting revenue and growth rate.
The compounding effect matters here. A steady 2% monthly compounds to ~24% growth from your starting month to your ending month ($35K to $43.5K). But your total annual revenue ($469K) is about 12% higher than last year's $420K, because you're summing a gradually increasing curve, not jumping to the higher rate immediately. Terret's examples show the same pattern at larger scale: $6.4M growing at 25% annually to $8M, then projecting $10M the following year.
If you're a services business with seasonal dips - summer slowdowns, holiday lulls - layer in monthly multipliers. We cover that in the scenario planning section below.
Example 2: Ecommerce (Traffic to Revenue)
Ecommerce projections model a conversion funnel, not just a growth rate. You need four inputs: monthly traffic, conversion rate, average order value, and seasonality multipliers. International ecommerce sales are up ~8% YoY and retail is projected to hit $28 trillion by 2028 - but your projection lives and dies on your own funnel metrics.
Assumptions: 50,000 monthly visitors, 2.5% conversion rate, $85 AOV, with a 1.4x seasonality bump in November and December.
| Month | Traffic | Conv. | AOV | Revenue |
|---|---|---|---|---|
| Jan | 50,000 | 2.5% | $85 | $106,250 |
| Feb | 51,000 | 2.5% | $85 | $108,375 |
| Mar | 52,000 | 2.5% | $85 | $110,500 |
| Apr | 53,000 | 2.5% | $85 | $112,625 |
| May | 54,000 | 2.5% | $85 | $114,750 |
| Jun | 55,000 | 2.4% | $85 | $112,200 |
| Jul | 54,000 | 2.4% | $85 | $110,160 |
| Aug | 55,000 | 2.5% | $85 | $116,875 |
| Sep | 57,000 | 2.6% | $85 | $126,126 |
| Oct | 60,000 | 2.7% | $90 | $145,800 |
| Nov | 75,000 | 3.0% | $95 | $213,750 |
| Dec | 80,000 | 3.2% | $95 | $243,200 |
| Annual | - | - | - | $1,620,611 |
Notice how November and December don't just get more traffic - conversion rates and AOV both climb. That's the Q4 holiday effect. If you model seasonality as a flat multiplier on revenue alone, you'll undercount because you're missing the behavioral shift. Shoppers in Q4 convert faster and buy more per order.
Example 3: SaaS (Leads to MRR to ARR)
SaaS projections are the most layered because activity in Month 1 doesn't close in Month 1. It closes in Month 3 if your sales cycle runs 60-90 days, which is typical for early-stage B2B SaaS. Getting this lag wrong is the single most common mistake SaaS founders make in projections - and we've watched it happen in real time during board reviews where Q1 numbers come in 40% below plan because the model assumed instant conversion.
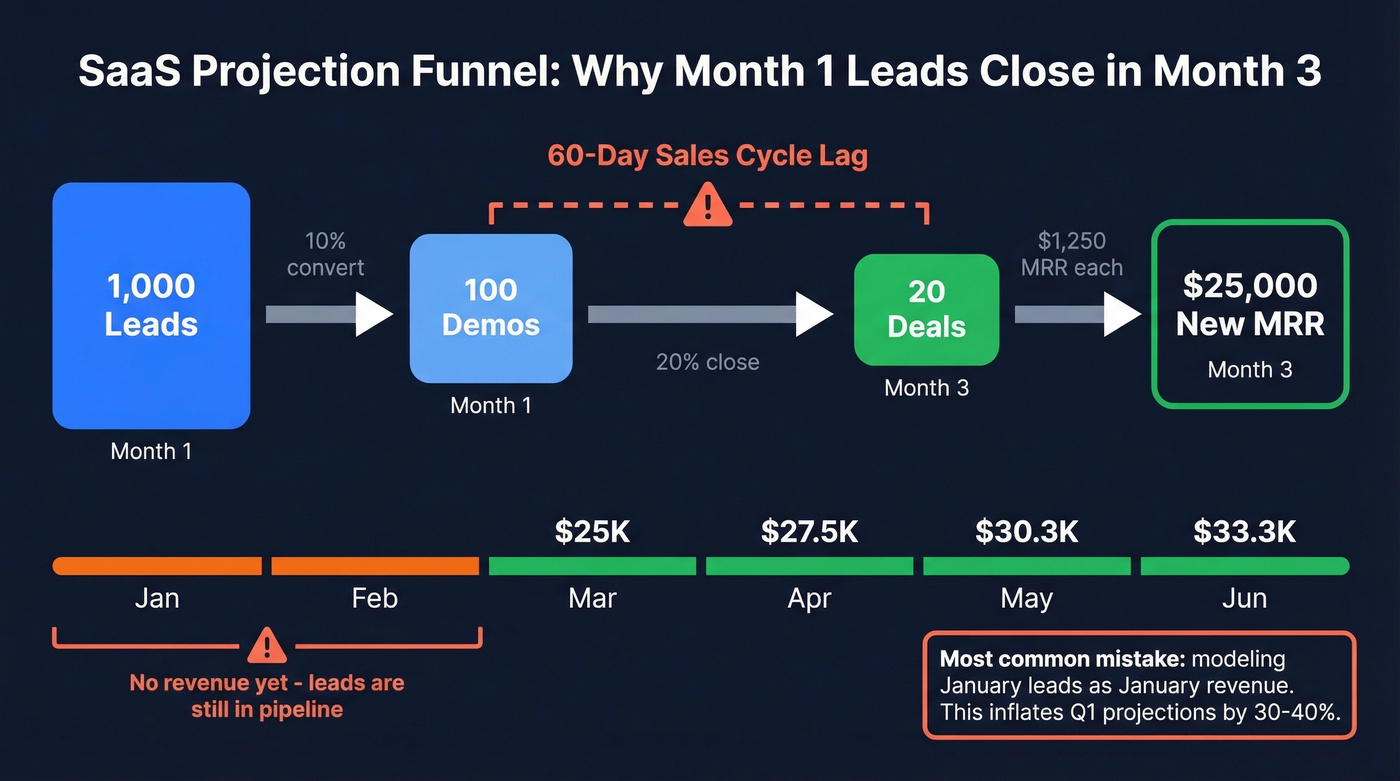
Assumptions: 1,000 leads in Month 1 growing 10% MoM, 10% lead-to-demo rate, 20% demo-to-close rate, $15,000 ACV ($1,250 MRR per deal), 60-day sales cycle lag.
| Month | Leads | Demos | Closes | New MRR |
|---|---|---|---|---|
| Jan | 1,000 | 100 | - | - |
| Feb | 1,100 | 110 | - | - |
| Mar | 1,210 | 121 | 20 | $25,000 |
| Apr | 1,331 | 133 | 22 | $27,500 |
| May | 1,464 | 146 | 24 | $30,250 |
| Jun | 1,611 | 161 | 27 | $33,275 |
| Jul | 1,772 | 177 | 29 | $36,603 |
| Aug | 1,949 | 195 | 32 | $40,263 |
| Sep | 2,144 | 214 | 35 | $44,289 |
| Oct | 2,358 | 236 | 39 | $48,718 |
| Nov | 2,594 | 259 | 43 | $53,590 |
| Dec | 2,853 | 285 | 47 | $58,949 |
By December, cumulative MRR reaches ~$398K, implying a $4.78M ARR run rate - but that assumes zero churn. Layer in a monthly churn rate of 2-5% for SMB SaaS if you're projecting beyond 12 months (see churn analysis).
Lead-to-opportunity conversion rates range from 5-20% depending on your channel mix. Cold outbound sits closer to 5%. Inbound content leads push toward 15-20%. If you're modeling January leads closing in January, you're inflating Q1 projections and creating a cash flow gap that's hard to explain to investors.
Example 4: Startup With No Historical Data
Here's the thing: if you don't have 12 months of data, historical growth models are useless. You need bottom-up unit economics - start with what you can control and work up.
On r/BarOwners, one restaurant owner shared a complete 5-year projection spreadsheet and put it bluntly: "the numbers are EVERYTHING." The instinct is right, but for most businesses, 18-24 months is the useful projection horizon. Anything longer is fiction at the pre-revenue stage.
Assumptions: Two customer segments. Segment A (mid-market): $500 CAC, $5,000 ACV, 8% monthly conversion. Segment B (SMB): $150 CAC, $1,200 ACV, 15% conversion. Marketing spend: $10K/month growing to $18K by Month 6.
| Month | Spend | Seg A Rev | Seg B Rev | Total |
|---|---|---|---|---|
| 1 | $10,000 | $10,000 | $9,600 | $19,600 |
| 2 | $11,000 | $10,000 | $12,000 | $22,000 |
| 3 | $13,000 | $15,000 | $14,400 | $29,400 |
| 4 | $15,000 | $20,000 | $16,800 | $36,800 |
| 5 | $16,000 | $20,000 | $19,200 | $39,200 |
| 6 | $18,000 | $25,000 | $21,600 | $46,600 |
| 6-Mo | $83,000 | $100,000 | $93,600 | $193,600 |
Six months, not twelve. We've seen too many seed-stage decks with 5-year revenue projections that are pure fiction. Validate against your TAM/SAM/SOM and sanity-check the implied market penetration (use this addressable market breakdown). If your Year 2 projection requires capturing 15% of your addressable market, you're dreaming.
The LTV:CAC ratio is your guardrail. Segment A here runs about 10:1 ($5,000 ACV x 3-year average lifespan / $500 CAC), which is healthy. Segment B runs about 8:1. If either drops below 3:1, the unit economics don't work and the projection is aspirational, not analytical (more on cost to acquire customer).
Example 5: Pipeline-Weighted (B2B)
This is the method most B2B sales teams should default to, because it uses data you already have in your CRM. Each deal gets weighted by its stage probability, and you sum the weighted values.
Stage probabilities based on historical conversion rates: Discovery 20%, Demo 40%, Proposal 60%, Contract 80%.
| Deal | Stage | Value | Prob. | Weighted |
|---|---|---|---|---|
| Acme Corp | Contract | $45,000 | 80% | $36,000 |
| Beta Inc | Proposal | $30,000 | 60% | $18,000 |
| Gamma Ltd | Demo | $25,000 | 40% | $10,000 |
| Delta Co | Discovery | $50,000 | 20% | $10,000 |
| Epsilon | Proposal | $35,000 | 60% | $21,000 |
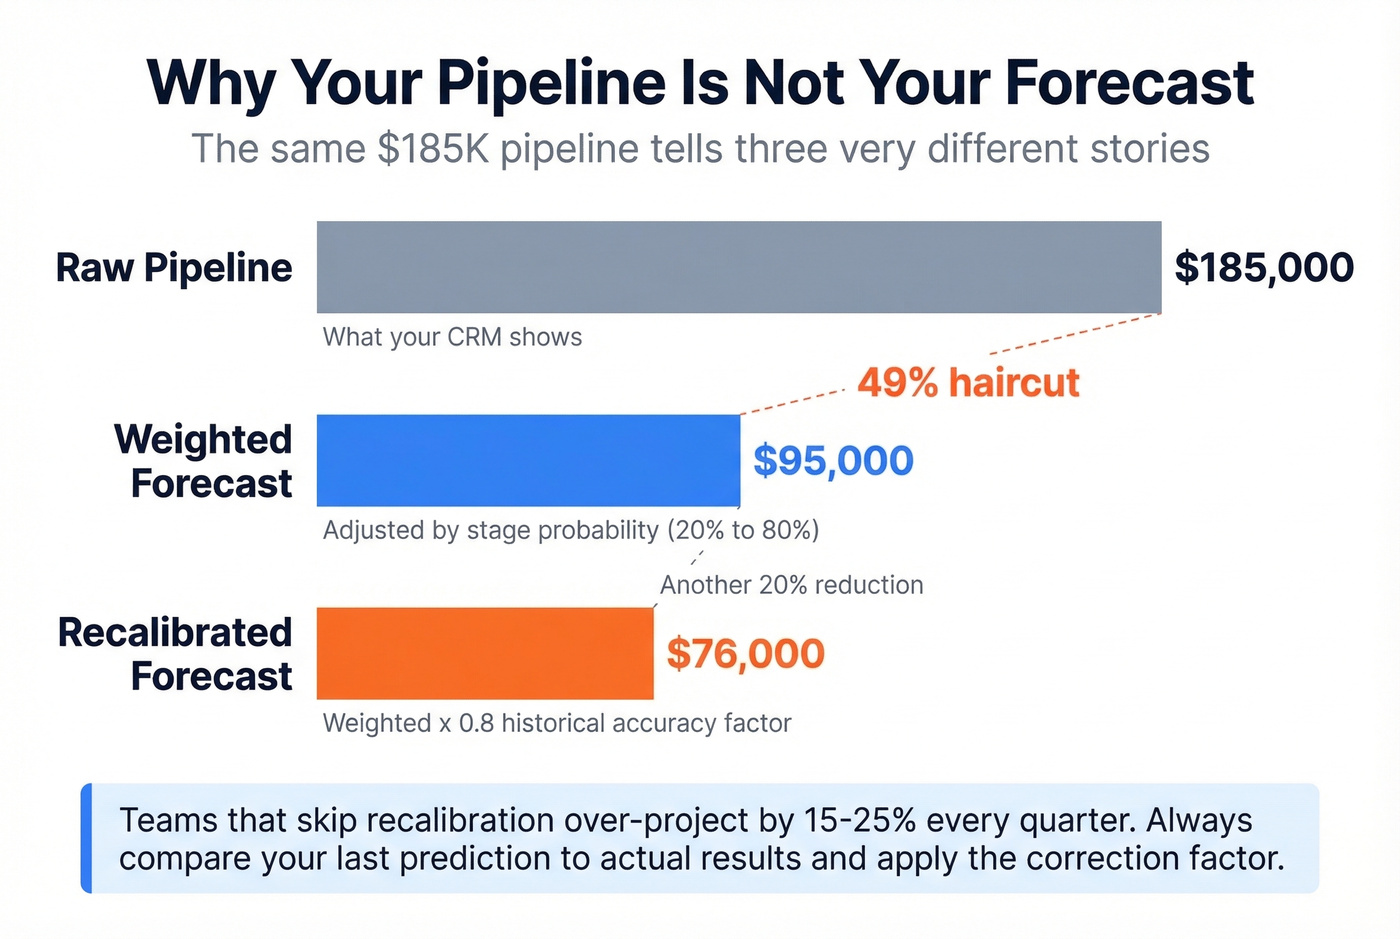
| Total | - | $185,000 | - | $95,000 |
Your raw pipeline says $185,000. Your weighted projection says $95,000. That's a 49% haircut - and it's usually closer to reality (compare against sales pipeline benchmarks).
The catch. If you predicted $100,000 last quarter and closed $80,000, your recalibration factor is 0.8. Apply that: $95,000 x 0.8 = $76,000. That's your adjusted forecast. Teams that skip recalibration consistently over-project by 15-25%.
Recalibration fixes your probability estimates. But there's a more fundamental problem: data quality. If your CRM has a 35% email bounce rate, your $95,000 weighted forecast is really closer to $62,000 because a third of those deals have stale contact data (see email bounce rate). Prospeo verifies emails in real time with 98% accuracy and a 7-day refresh cycle, so your pipeline reflects actual reachable prospects, not ghost records.

Every projection example above depends on one thing: a pipeline full of real, reachable buyers. Prospeo gives you 300M+ profiles with 98% verified emails and 30+ filters - including buyer intent, funding, and headcount growth - so the pipeline numbers feeding your projection are actually reliable.
Stop projecting revenue from a pipeline full of dead contacts.
How to Build Your Own Projection
On r/excel, users consistently describe the same pain: exporting data, building pivot tables, running SUMIFS into a forecast file - a workflow that's time-consuming and error-prone. The fix is structural.
1. Choose your method. No history? Bottom-up. Twelve months of revenue data? Historical growth. Active CRM pipeline? Pipeline-weighted (see common sales pipeline challenges).
2. Gather your inputs. List every driver: units, pricing, conversion rates, pipeline growth, seasonality patterns, churn rates. For pipeline projections, include opportunity name, sales phase, probability %, and weighted forecast amount.
3. Build the table. Use Smartsheet-style columns: product/service, unit sales, price/unit, total revenue, with monthly columns and annual totals. Keep formulas simple - if you can't explain a cell to a colleague in one sentence, it's too complex.
4. Add seasonality multipliers. Use a baseline of 1.0 and adjust by month. Retail Q4 is often 1.3-1.5x. B2B services tend to dip in August and December at 0.8-0.9x. Pull these from your own historical data first, industry benchmarks second.
5. Run three scenarios. Best case, base case, worst case.
6. Separate actuals from projections. The #1 complaint on r/excel is that actual numbers overwrite forecast formulas, creating monthly maintenance headaches. Use separate rows or tabs, with IF(actual_cell<>"", actual_cell, forecast_formula) to automate the handoff.
Best, Base, and Worst Case
A single-number projection is a guess. Three scenarios are a strategy.
The trick is setting assumptions that are genuinely different, not just +/-5% from your base. Your worst case should model a real downside - losing a key client, a market contraction, a failed product launch. Your best case should model a plausible upside, not fantasy.
| Scenario | Growth | Q1 Revenue | Q2 Revenue | Annual |
|---|---|---|---|---|
| Best | 4% MoM | $112,000 | $126,000 | $540,000 |
| Base | 2% MoM | $106,000 | $112,000 | $469,000 |
| Worst | 0% MoM | $105,000 | $105,000 | $420,000 |
The spread between worst and best is $120,000 - that's the range your cash flow planning needs to accommodate. 58% of businesses report that less than 75% of their sales close as forecasted. Three scenarios force you to confront the downside before it arrives.
Mistakes That Kill Accuracy
Look, most projection errors aren't math errors - they're ego errors. You built the model, so you believe the model. Every mistake below is a version of that problem.
Ignoring seasonality. Every business has seasonal patterns, even B2B. Apply monthly multipliers derived from at least two years of historical data. If you don't have that history, use industry benchmarks and adjust as you collect data.
Over-reliance on historical data alone. History is a foundation, not a ceiling. If a new competitor entered your market or your pricing changed, last year's growth rate is misleading. Incorporate market shifts, competitive dynamics, and strategic changes into your assumptions.
Overcomplicating the model. We've seen 47-tab spreadsheets that nobody updates because nobody understands them. Prioritize the 3-5 variables that drive 80% of your revenue. Everything else is noise.
Never updating. 96% of organizations use spreadsheets for forecasting, and 40% rely on them exclusively. The problem isn't the tool - it's that annual projections become static documents that sit in a folder. Use rolling forecasts. Compare actuals to projected every month and apply recalibration factors.
Confirmation bias. Have someone outside your team challenge the assumptions. If nobody pushes back on your 30% growth assumption, your projection process is broken.
Overwriting formulas with actuals. When you paste actual numbers into forecast cells, you destroy the formula and create a maintenance nightmare. Separate actuals and forecasts into different rows or tabs.
Tools That Help
You don't need expensive software to build a solid projection. Most teams start with what they have.
Excel / Google Sheets is free and handles everything in this article. For teams managing projections across multiple products or regions, Google Sheets' real-time collaboration beats Excel's desktop-only workflow.
HubSpot CRM offers a free plan, scaling to ~$15/user/mo on paid tiers. Its built-in deal forecasting maps directly to the pipeline-weighted method. If your pipeline lives in HubSpot, the projection is half-built already (see more examples of a CRM).
Pipedrive runs ~$14/user/mo and is the simplest CRM for pipeline-stage projections. Less powerful than HubSpot for marketing-sourced lead modeling, but faster to set up for pure sales teams.
Zoho CRM has a free tier and paid plans starting at ~$14/user/mo. The forecasting modules punch above their price point, and the free tier is surprisingly capable for small teams.
Salesforce runs around $25-$300+/user/mo depending on edition. Overkill for projection spreadsheets, but necessary if your org already runs on it. The forecasting module works well once configured - and "once configured" is doing a lot of heavy lifting in that sentence.
For the data feeding your projections, Prospeo covers 300M+ profiles with 143M+ verified emails (see data enrichment services). The free tier gives you 75 verified emails per month - enough to audit your pipeline data quality before you build projections on top of it.
That SaaS leads-to-MRR model only works if your lead volume is real and your contacts convert. Prospeo's 7-day data refresh means your pipeline stays current - not built on stale emails that bounce at 35%. Teams using Prospeo see bounce rates under 4% and book 26% more meetings.
Turn your sales projection from a guess into a plan you can hit.
FAQ
What's the difference between a sales projection and a forecast?
A forecast predicts outcomes based on current trends and gets updated regularly - it's your best guess at what will happen. A projection models "what if" scenarios: what happens if you launch a new product, enter a new market, or lose a key client. Forecasts are dynamic and operational. Projections are scenario-based and strategic.
How do you project sales with no historical data?
Use bottom-up unit economics. Estimate your addressable market, expected conversion rates, average deal size, and customer acquisition cost. Project 18-24 months max - anything longer is fiction at the pre-revenue stage. Aim for a 3:1 LTV:CAC ratio as your minimum viability threshold.
How often should you update projections?
Monthly for rolling forecasts, quarterly for strategic projections. Compare actuals to projected each period and apply a recalibration factor - if you predicted $100K and closed $80K, multiply next quarter's projection by 0.8. Static annual projections that never get updated are the #1 accuracy killer.
Which sales projection example works best for small businesses?
The historical growth method in Example 1 is the best starting point for any small business with at least 12 months of revenue data. Apply a realistic 1-3% month-over-month growth rate, compound it across 12 months, and add seasonality multipliers for predictable peaks and valleys. Replace the starting figure and growth rate with your own numbers.
How does bad CRM data affect projections?
Stale contacts inflate pipeline value and distort weighted forecasts. If 30% of emails in your CRM bounce, your $95K weighted projection is really ~$66K in reachable pipeline. Email verification tools catch invalid records before they corrupt your numbers - that's why we recommend auditing contact data quality as a first step before building any pipeline-based projection.