Sales Territory Allocation: The Operator's Playbook
Your best rep just quit. Her territory gets split between two AEs who already have full books. Within a quarter, one patch is thriving and the other is a dead zone - same product, same ICP, wildly different results. The problem isn't the reps. It's that you treated sales territory allocation like a geometry exercise instead of what it actually is: a governance problem.
What Territory Allocation Actually Means
Territory design is drawing lines - geography, vertical, account tier. Territory allocation is assigning rep capacity to those boundaries based on workload scoring, quota targets, and account potential. Design is the map; allocation is the operating model that makes the map productive.
HBR research from Zoltners, Sinha, and Lorimer shows effective territory realignment can lift revenue by 2-7% without adding headcount. No new hires, no new tools - just better distribution of the capacity you already have.
Why Allocation Models Break
Most models don't fail spectacularly. They rot slowly. We see the same patterns over and over.
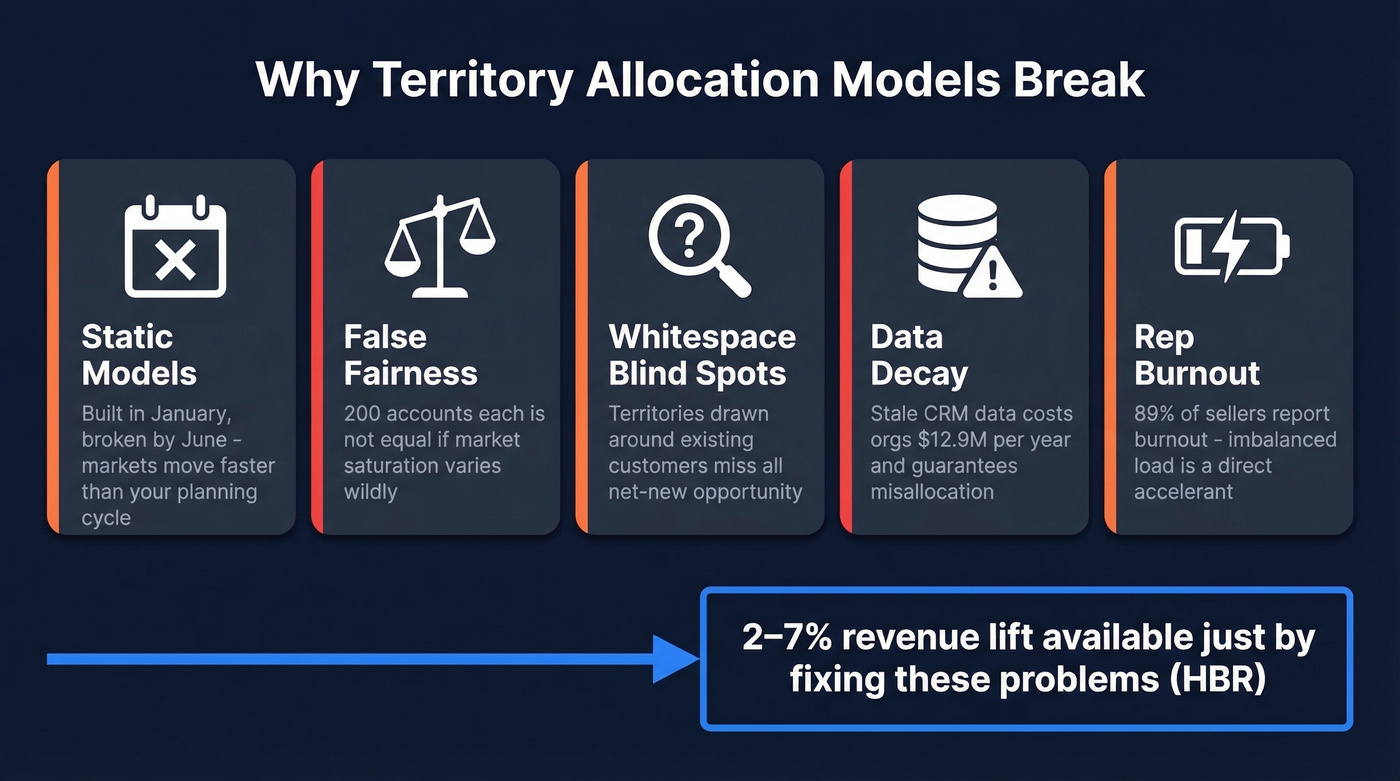
Static models that ignore market shifts. You built territories in January; by June, two verticals have consolidated and a competitor entered your strongest geo. Xactly's research flags static models as a top pitfall, and for good reason - the market doesn't wait for your next planning cycle.
Equal account counts mistaken for fairness. Giving every rep 200 accounts isn't balanced if 80 of yours are in a saturated market and 80 of mine are greenfield. Fair means +-10% expected workload, not equal headcount. In some industries, poor territory planning contributes to turnover rates as high as 27%.
Whitespace blind spots. Territories drawn around existing customers miss net-new opportunity entirely. An Xactly report found territories with revenue-per-account below $50k had 23% higher churn rates than those above $100k - a sign that thin territories bleed reps and customers alike.
Data decay. Gartner estimates poor data quality costs organizations $12.9M annually. Stale inputs are a root cause of misallocation, and most teams don't catch it until quota misses pile up.
Burnout from imbalanced load. Nearly 90% of sellers report feeling burned out, and low-drag sellers hit 1.7x the quota attainment of high-drag sellers. Gartner named the sales mental health crisis one of the top seven commercial threats facing CSOs. Territory imbalance is a direct accelerant.
A Five-Step Allocation Model
Step 1: Define Your Segmentation Basis
Geography, vertical, named accounts, or a hybrid. Most mid-market teams land on geo + vertical overlay. Don't carve out the Dakotas and Northern Territories and expect a rep to build pipeline there - every territory needs enough density to sustain a full sales cycle.
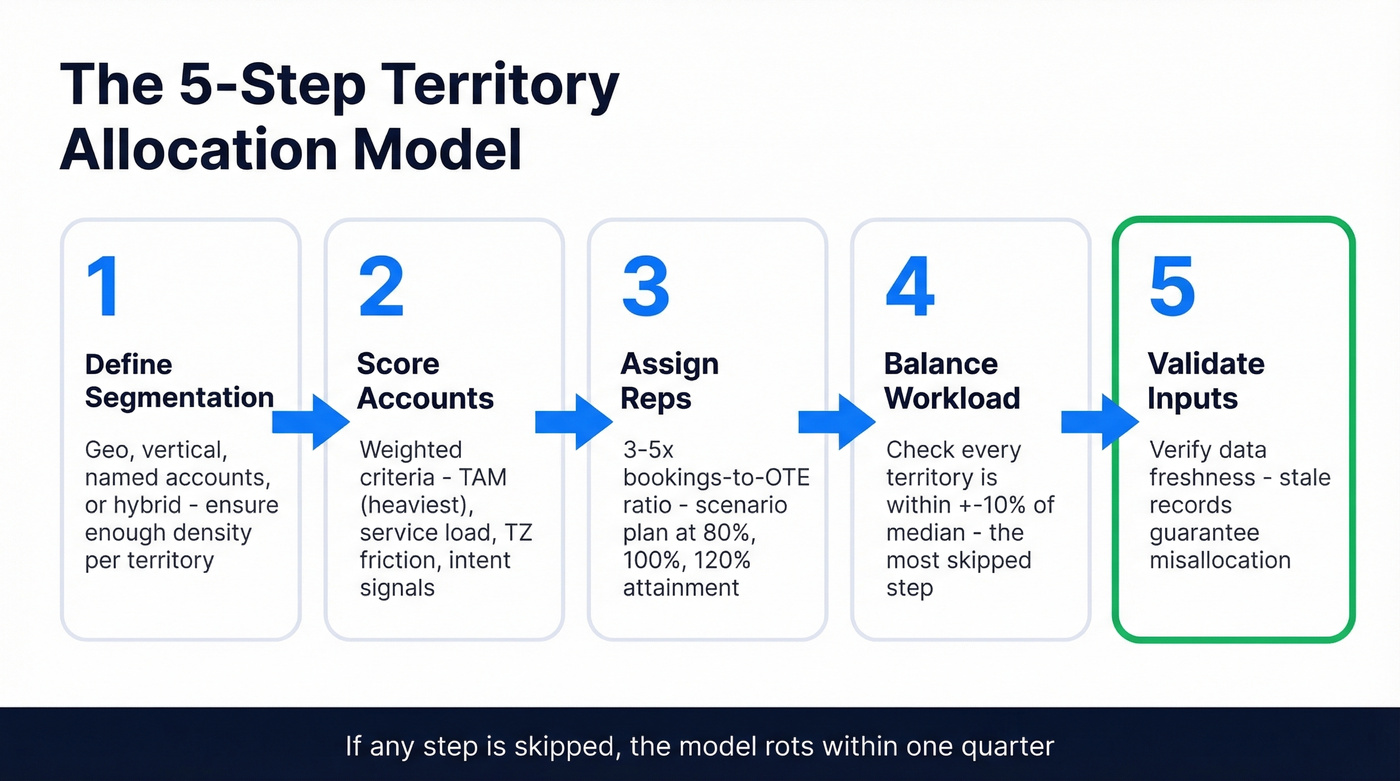
Step 2: Score Accounts on Weighted Criteria
Build a scoring model with three to five inputs: TAM (weight heaviest), current service load, travel or time-zone friction, and intent signal strength. A basic weighted sum works fine. You don't need machine learning; you need honest inputs. If you want a tighter rubric, start with an Ideal Customer Profile and layer in lead scoring.
Step 3: Assign Reps to Territories
Use a bookings-to-OTE ratio of 3-5x as your capacity benchmark. When you assign sales reps to territories, scenario-plan at 80%, 100%, and 120% attainment. If a territory only works at 120%, it's not a territory - it's a prayer. (If you need a refresher on comp math, see OTE in sales.)
Capacity isn't just "hours in a week," either. Ramp time and tenure matter. We've watched teams treat a brand-new rep and a fully ramped rep as interchangeable, then act surprised when the model looks "fair" on paper and breaks in the field. A rep in month two shouldn't carry the same expected workload as someone who's been in-seat for eighteen months and knows every buyer by name. A simple 30-60-90 day plan helps you model ramp assumptions realistically.
Step 4: Balance to +-10% Workload
After initial assignment, check expected workload across all territories. If any territory deviates more than 10% from the median, rebalance. This is the single most skipped step, and it's the one that prevents the "my territory sucks" conversation six months later.
Step 5: Validate Your Inputs
Before you lock assignments, verify the account and contact data feeding your model. Stale records guarantee misallocation. Prospeo enriches CRM and CSV records with 50+ data points on a 7-day refresh cycle and layers 15,000 Bombora intent topics so you can weight territories by in-market signal, not just firmographics. If your scoring model runs on data that's two months old, the output is fiction. If you're evaluating vendors, compare data enrichment services and use a clear lead enrichment workflow.
Your territory scoring model is garbage if the inputs are stale. Prospeo enriches CRM and CSV records with 50+ data points on a 7-day refresh cycle - not the 6-week industry average - and layers in 15,000 Bombora intent topics so you can weight territories by real buying signals, not last quarter's firmographics. 98% email accuracy. 92% API match rate. At $0.01 per email.
Stop allocating territories on two-month-old data. Fix the inputs first.
Sanity Checks Before You Ship
| Check | Threshold | If It Fails |
|---|---|---|
| Workload balance | +-10% of median | Rebalance accounts |
| Whitespace coverage | Every territory has net-new | Add greenfield accounts |
| Travel/TZ friction | No rep spans 3+ time zones | Split or reassign |
| Data freshness | Records updated in the last 30 days | Re-enrich before launch |
| Buying group depth | 11-15 stakeholders mapped | Enrich missing contacts |
If you can't pass all five, you're shipping a model that'll generate override requests within the first quarter.
Governance: ROE + Exception Rate
Let's be honest - the allocation model is the easy part. Keeping it alive is where most teams fail.
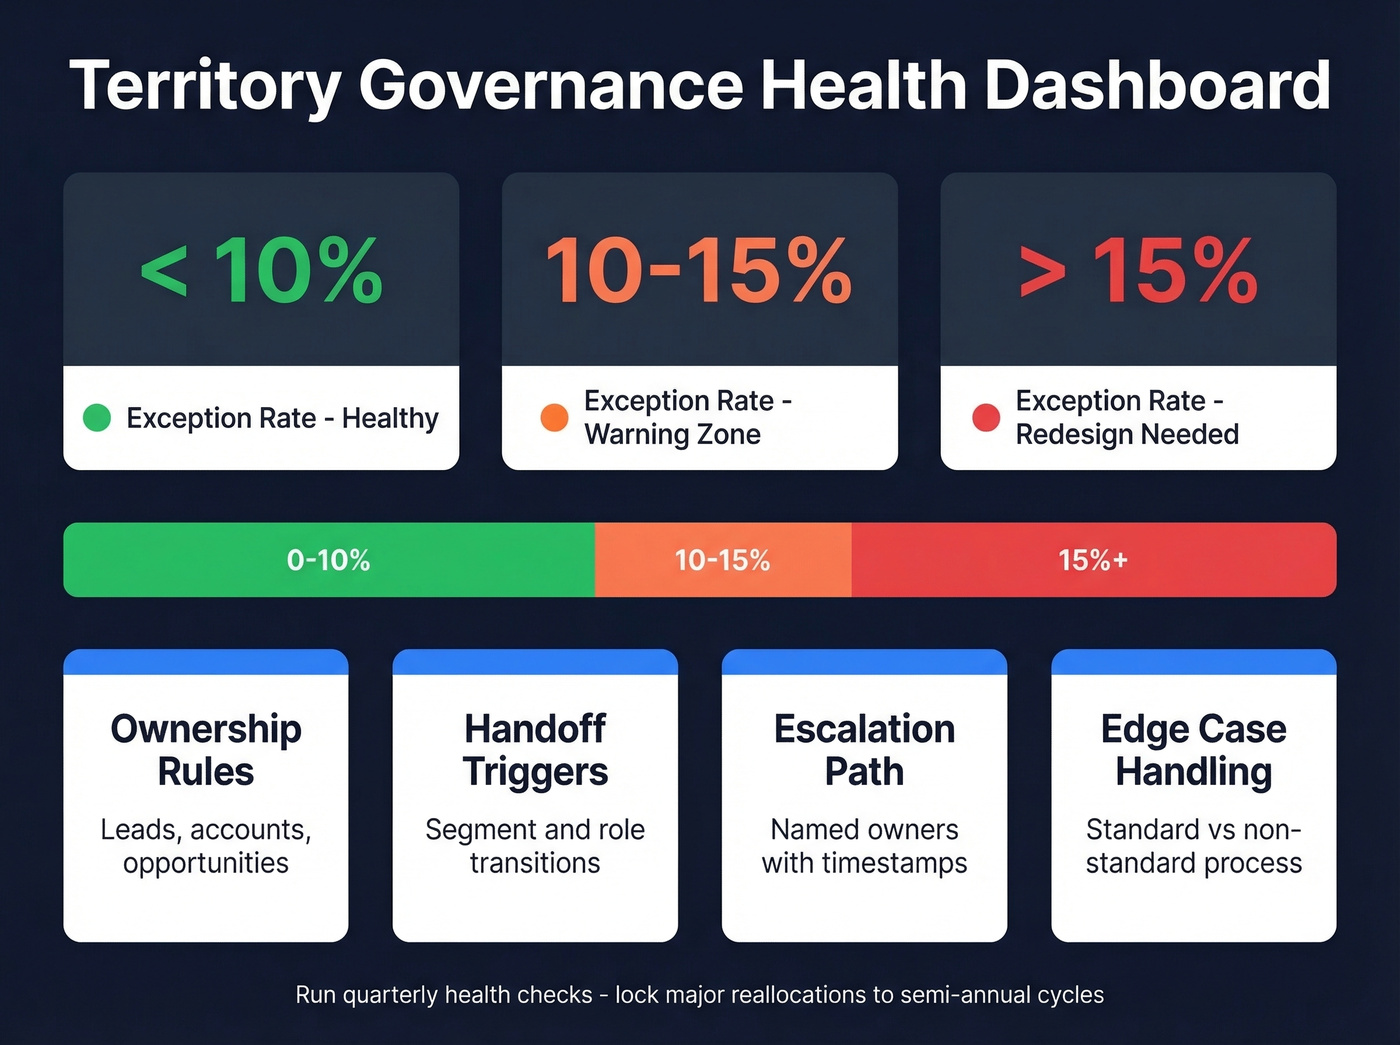
Your Rules of Engagement document isn't a dusty policy. It's a strategy translation document. Structure it around four pillars:
- Ownership rules for leads, accounts, and opportunities
- Handoff triggers between segments or roles
- An escalation path with named owners and timestamps
- Standard vs. non-standard handling for edge cases
Track your exception rate as a model health KPI. One SalesOps leader on Reddit described their override tables growing every quarter until roughly 15% of the team was covered by exceptions - the "official" model had become fiction. We've seen this exact pattern at multiple companies. When overrides exceed 10-15% of the team, you don't need more exceptions. You need a redesign.
Run a quarterly health check on workload balance and exception rate, and lock major reallocations to semi-annual cycles so reps have enough runway to work their patch. If you're formalizing the operating cadence, borrow from Sales Operations metrics and a simple pipeline health dashboard.
When Spreadsheets Break: Tooling
Here's the thing: teams will spend months arguing over lines on a map but won't invest in clean data inputs. That's backwards.
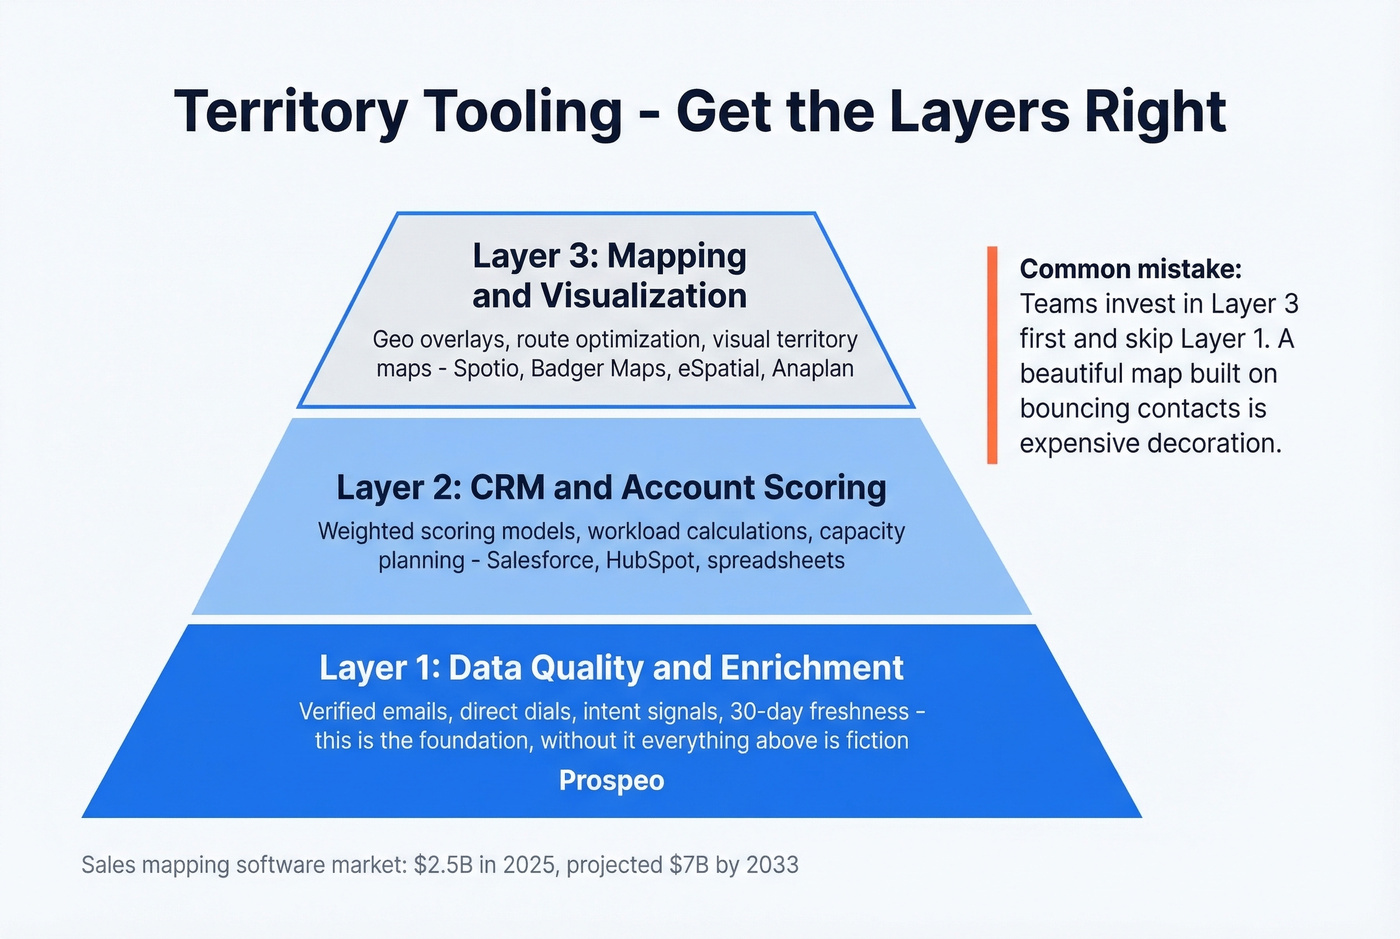
The sales mapping software market was valued at roughly $2.5B in 2025 and is projected to hit $7B by 2033. Here's what's available at the SMB and mid-market level:
| Tool | Starting Price | Best For |
|---|---|---|
| MapBusinessOnline | $29/mo | Budget geo mapping |
| Spotio | $39/user/mo | Field sales routing |
| Badger Maps | $49/user/mo | Outside sales teams |
| Mapline | $99/mo | Data-heavy overlays |
| eSpatial | $1,295/user/yr | Mid-market optimization |
| Maptitude | $695 one-time | One-time desktop analysis |
Enterprise territory planning platforms - Xactly AlignStar, Anaplan, Fullcast - typically run mid-four to low-six figures annually depending on seats and data volume. Visual territory maps also serve as a change-management lever; reps adopt assignments faster when they can see the logic on a map rather than staring at a ZIP-code spreadsheet. If you're comparing options, start with a shortlist of sales mapping software.
I'd rather have a rep working a Google Sheet with accurate, intent-scored accounts than a beautiful Anaplan map built on contacts that bounce. Skip the expensive mapping tool if your underlying data is garbage - fix the data first. Pair your mapping tool with a data layer like Prospeo for 98% email accuracy and intent-based prioritization so the accounts feeding your model are actually reachable.
That sanity check table above requires 11-15 stakeholders mapped per buying group and records updated within 30 days. Most CRMs fail both. Prospeo's enrichment returns verified emails, direct dials, and intent signals across your entire account list - so every territory ships with complete buying groups and current contact data, not gaps that force reps to prospect blind.
Map every stakeholder in every territory before you ship the model.
FAQ
How often should you reallocate territories?
Run quarterly health checks on workload balance and exception rate. Lock major reallocations to semi-annual cycles. If overrides exceed 10-15% before the next cycle, trigger an early redesign rather than patching with more exceptions.
What's the difference between territory design and allocation?
Design defines boundaries - geography, vertical, account tier. Allocation assigns rep capacity to those boundaries using workload scoring, quota targets, and account potential. Design is the map; allocation determines whether reps can actually hit number.
What's a good workload balance threshold?
Aim for +-10% of the median expected workload across all territories. Anything beyond that creates perceived unfairness, drives override requests, and accelerates rep attrition - especially among top performers stuck in underweight patches.