Sales Velocity Calculator: Formula, Benchmarks, and How to Actually Use the Number
Only 28% of reps hit quota last year, and that number hasn't recovered. Win rates have compressed to 17-21% across B2B, buying committees run 6-10 decision-makers deep (some enterprise deals now involve 15+), and deals take longer to close than they did two years ago. A sales velocity calculator turns those four pipeline inputs into one number that tells you whether your pipeline is actually producing revenue - or just sitting there looking impressive in your CRM.
Free Sales Velocity Calculator
Plug in your four numbers. The output is revenue per day - the rate at which your pipeline converts to cash.
Inputs:
- # Qualified Opportunities in pipeline
- Average Deal Value ($)
- Win Rate (%)
- Average Sales Cycle Length (days)
Output: Sales Velocity = $ per day
The Quick Version
The formula is (Opportunities x Avg Deal Value x Win Rate) / Sales Cycle Length in Days. SaaS & Technology companies average $1,847/day across a study of 247 B2B orgs - your number means nothing without a benchmark to compare against. If your velocity is low, fix sales cycle length first. It's the denominator, so even small reductions compound fast.
The Sales Velocity Equation Explained
Sales velocity measures how much revenue your pipeline generates per day:
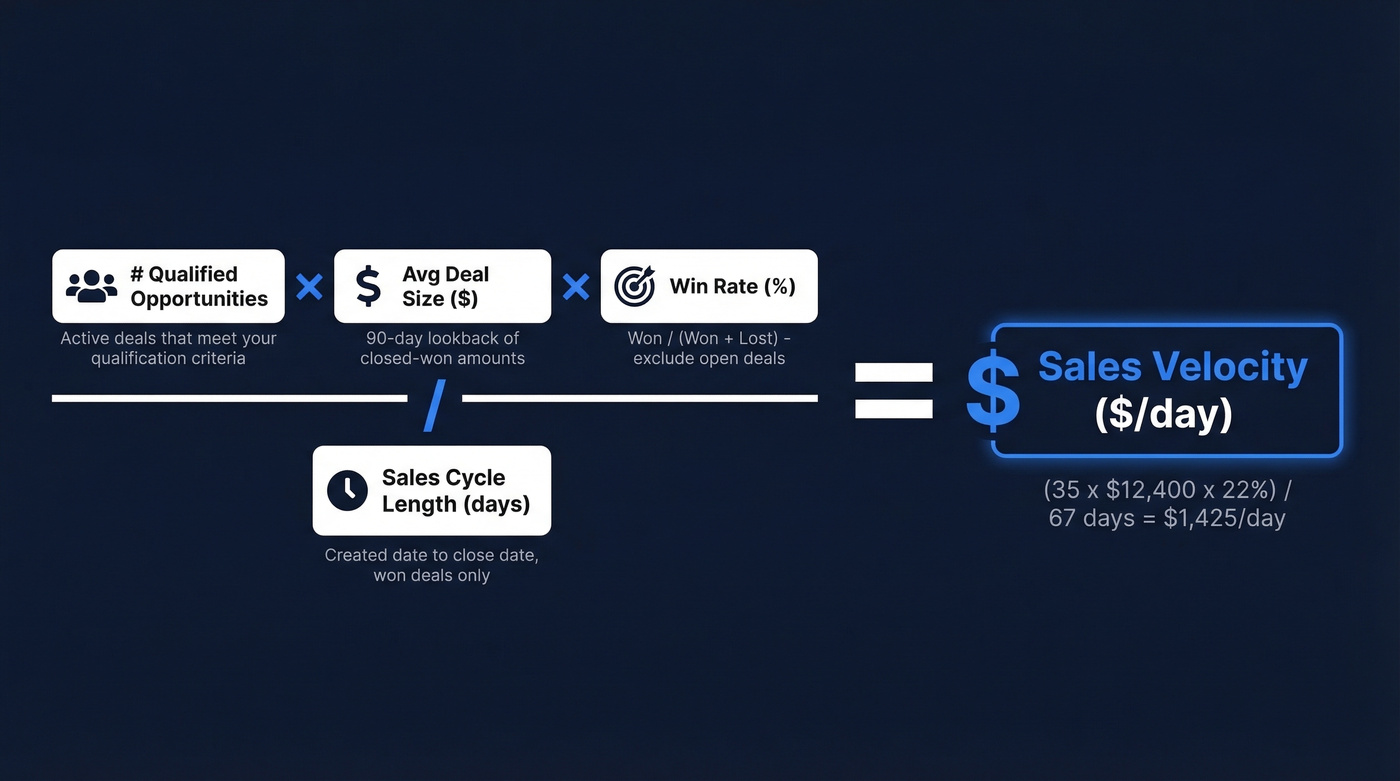
Sales Velocity = (# of Qualified Opportunities x Average Deal Size x Win Rate) / Average Sales Cycle in Days
Qualified Opportunities - deals in your pipeline that meet your qualification criteria (BANT, MEDDIC, whatever you use). Pull from your CRM's opportunity count, filtered to active deals. Don't count leads or MQLs.
Average Deal Size - mean dollar value of closed-won deals. Use a 90-day lookback minimum to smooth outliers. In Salesforce, that's the "Amount" field on won opportunities; in HubSpot, "Deal Amount."
Win Rate - closed-won deals divided by total closed deals (won + lost). Don't include open deals in the denominator. Dividing won deals by total pipeline is a common mistake that gives you a much lower, misleading number.
Sales Cycle Length - average days from opportunity creation to close (won deals only). CreatedDate to CloseDate in Salesforce, or "Date entered pipeline" to "Close date" in HubSpot.
Sales Velocity vs Pipeline Velocity vs Deal Velocity
These terms get used interchangeably, and it causes real confusion in cross-functional meetings.
| Metric | What It Measures | Formula | Best For |
|---|---|---|---|
| Sales velocity | Revenue per day | (Opps x Deal Size x Win Rate) / Cycle Days | Pipeline health, forecasting |
| Pipeline velocity | Same as above | Same formula | Interchangeable term |
| Deal velocity | Time per deal | Total days in pipeline / # deals closed | Bottleneck analysis |
Sales velocity and pipeline velocity are the same metric. Pick one term and standardize across your org. Deal velocity is different - it focuses on how fast individual deals move, including lost ones, which makes it better for diagnosing stage-level bottlenecks.
Worked Calculation Examples
SMB Example
Here's a velocity calculation for an SMB company with $1M-$5M revenue:
- 18 qualified opportunities
- $6,200 average deal value
- 26% win rate
- 43-day average sales cycle
(18 x $6,200 x 0.26) / 43 = $674/day
Right in line with the $687/day benchmark for companies in the $1M-$5M revenue band. But there's not much margin for error at this level. One stalled deal or a bad quarter of win rates and you're underwater.
Mid-Market SaaS Example
- 35 qualified opportunities
- $12,400 average deal value
- 22% win rate
- 67-day average sales cycle
(35 x $12,400 x 0.22) / 67 = $1,425/day
The SaaS & Technology benchmark is $1,847/day - this team is running about 23% below average. The win rate (22%) is right at the SaaS median, so the gap is coming from cycle length or deal size. Shortening the cycle from 67 to 55 days alone would push velocity to $1,736/day. That's the power of the denominator.
Enterprise Example
An enterprise company selling into construction and real estate:
- 12 qualified opportunities
- $89,300 average deal value
- 16% win rate
- 147-day average sales cycle
(12 x $89,300 x 0.16) / 147 = $1,166/day
The Real Estate & Construction benchmark is $2,456/day. Less than half the industry average. With only 12 opportunities, the math is fragile - two more deals in the pipeline at the same win rate would push velocity to $1,360/day. Enterprise teams often have a pipeline volume problem disguised as a velocity problem.
Industry and Company Benchmarks
Benchmarks by Industry
Data from First Page Sage's analysis of 247 B2B organizations:
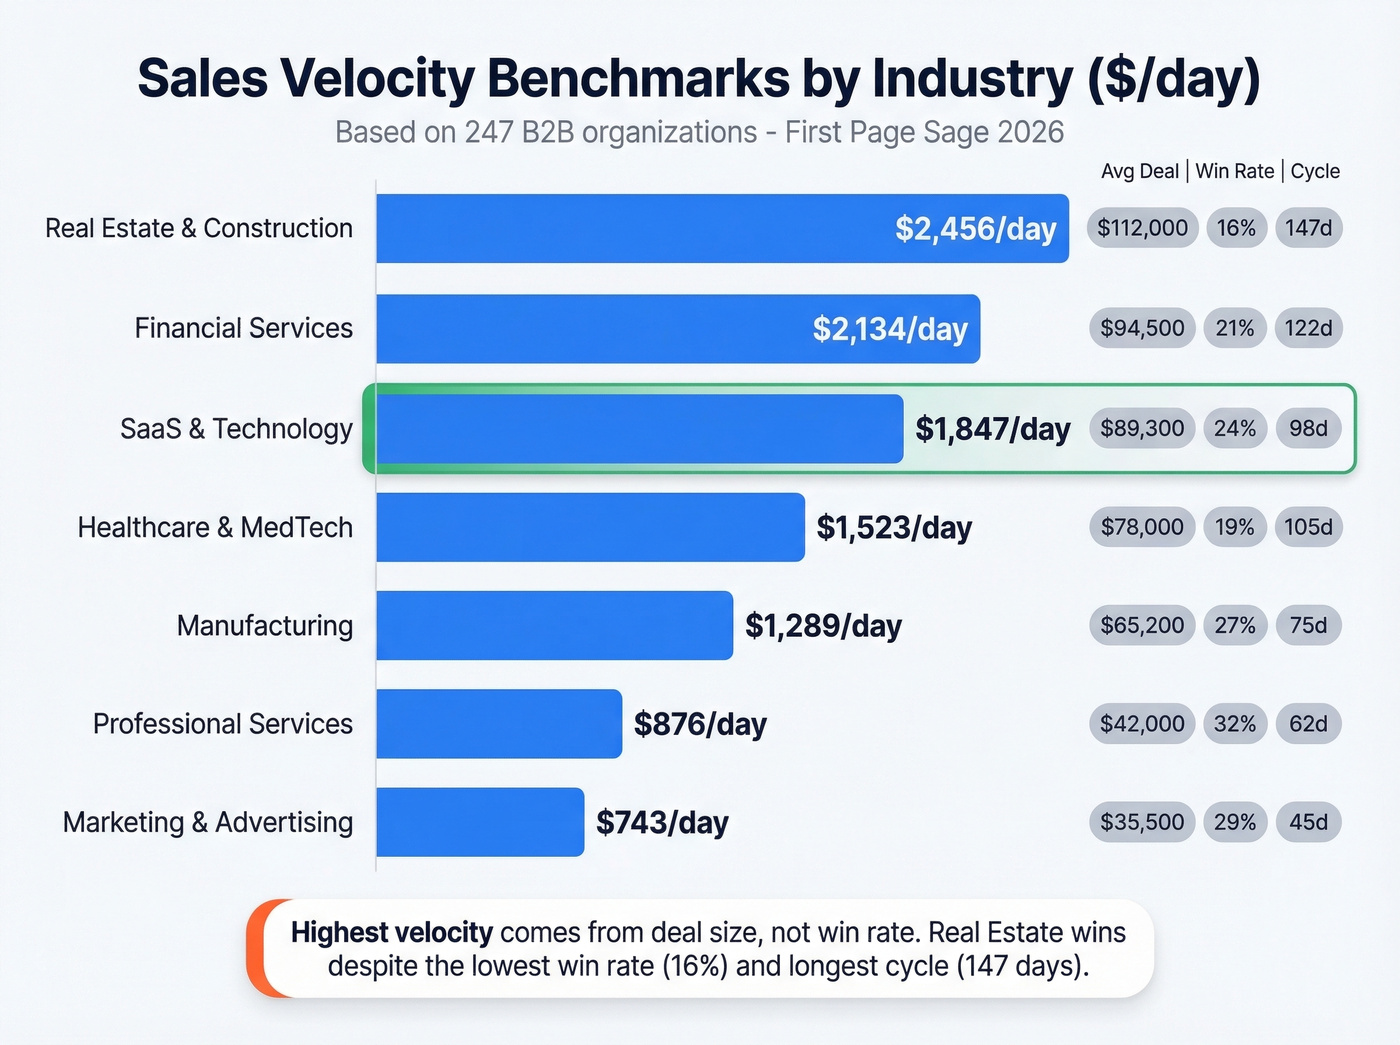
| Industry | Velocity ($/day) | Avg Deal | Win Rate | Cycle (days) |
|---|---|---|---|---|
| Real Estate & Construction | $2,456 | $89,300 | 16% | 147 |
| Financial Services | $2,134 | $31,200 | 18% | 89 |
| SaaS & Technology | $1,847 | $12,400 | 22% | 67 |
| Healthcare & MedTech | $1,523 | $18,700 | 25% | 72 |
| Manufacturing | $1,289 | $47,800 | 19% | 124 |
| Professional Services | $876 | $8,900 | 28% | 51 |
| Marketing & Advertising | $743 | $15,200 | 24% | 58 |
The highest velocity doesn't come from the highest win rate. Real Estate wins on sheer deal size despite having the lowest win rate and longest cycle. Professional Services has the best win rate but the smallest deals, landing near the bottom. The formula rewards balance across all four levers.
One thing we've noticed when running these benchmarks against our own clients: Optifai's dataset of 939 companies (skewing larger) puts Manufacturing at $6,500/day and Professional Services at $5,200/day - significantly higher than First Page Sage's figures, which include smaller companies. Your benchmark depends on which dataset matches your company profile.
Benchmarks by Company Size
| Revenue Band | Velocity ($/day) |
|---|---|
| $1M-$5M | $687 |
| $5M-$25M | $1,303 |
| $25M-$100M | $3,484 |
| $100M-$500M | $6,919 |
| $500M+ | $12,945 |
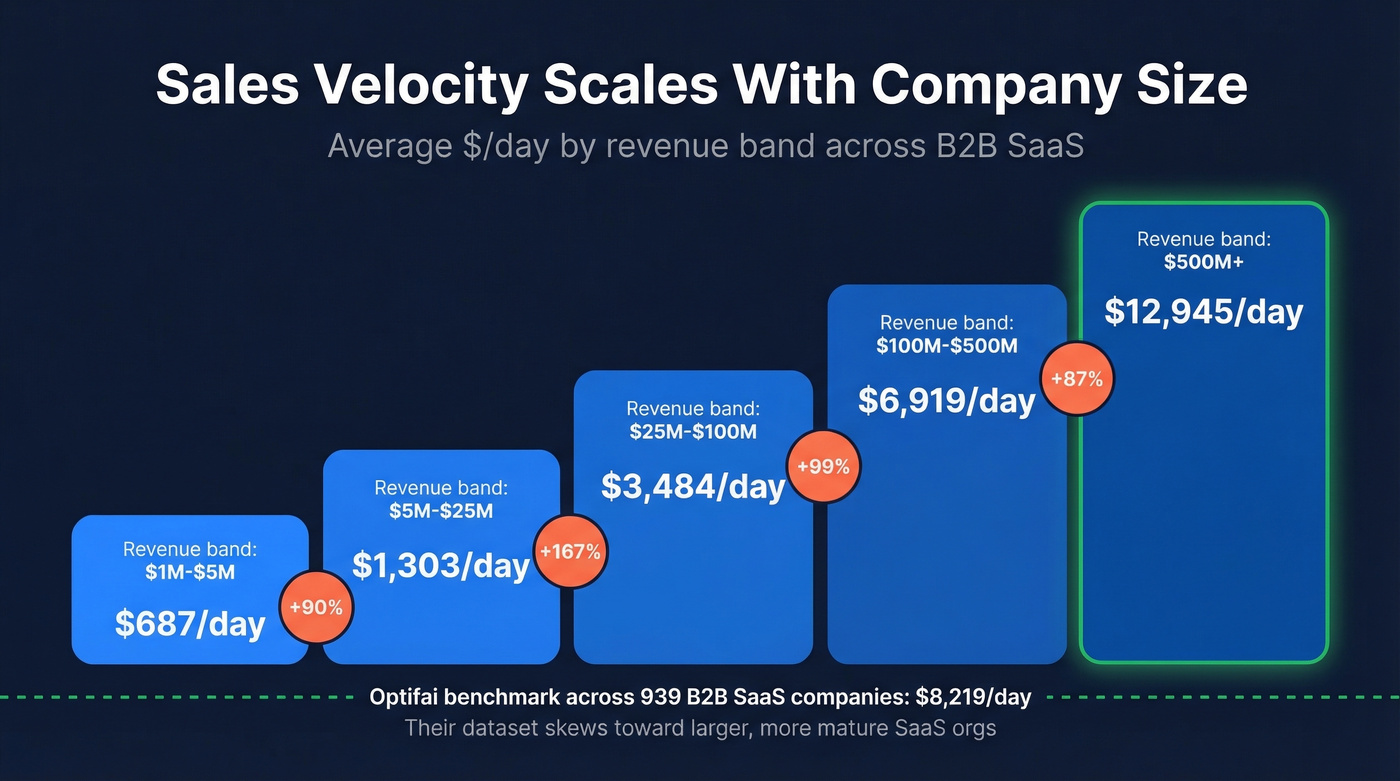
Optifai's overall benchmark across 939 B2B SaaS companies is $8,219/day, which slots between the $100M-$500M and $500M+ bands. That makes sense - their dataset skews toward larger, more mature SaaS orgs.
Enterprise teams with only 12 opportunities don't have a velocity problem - they have a pipeline volume problem. Prospeo's database of 300M+ profiles with 30+ filters (buyer intent, headcount growth, funding, technographics) fills your pipeline with qualified opportunities that actually convert.
Add the numerator your sales velocity formula is starving for.
Which Lever to Pull First
Not all four levers are created equal. Sales cycle length sits in the denominator, which means reducing it has a compounding effect the other three variables can't match.
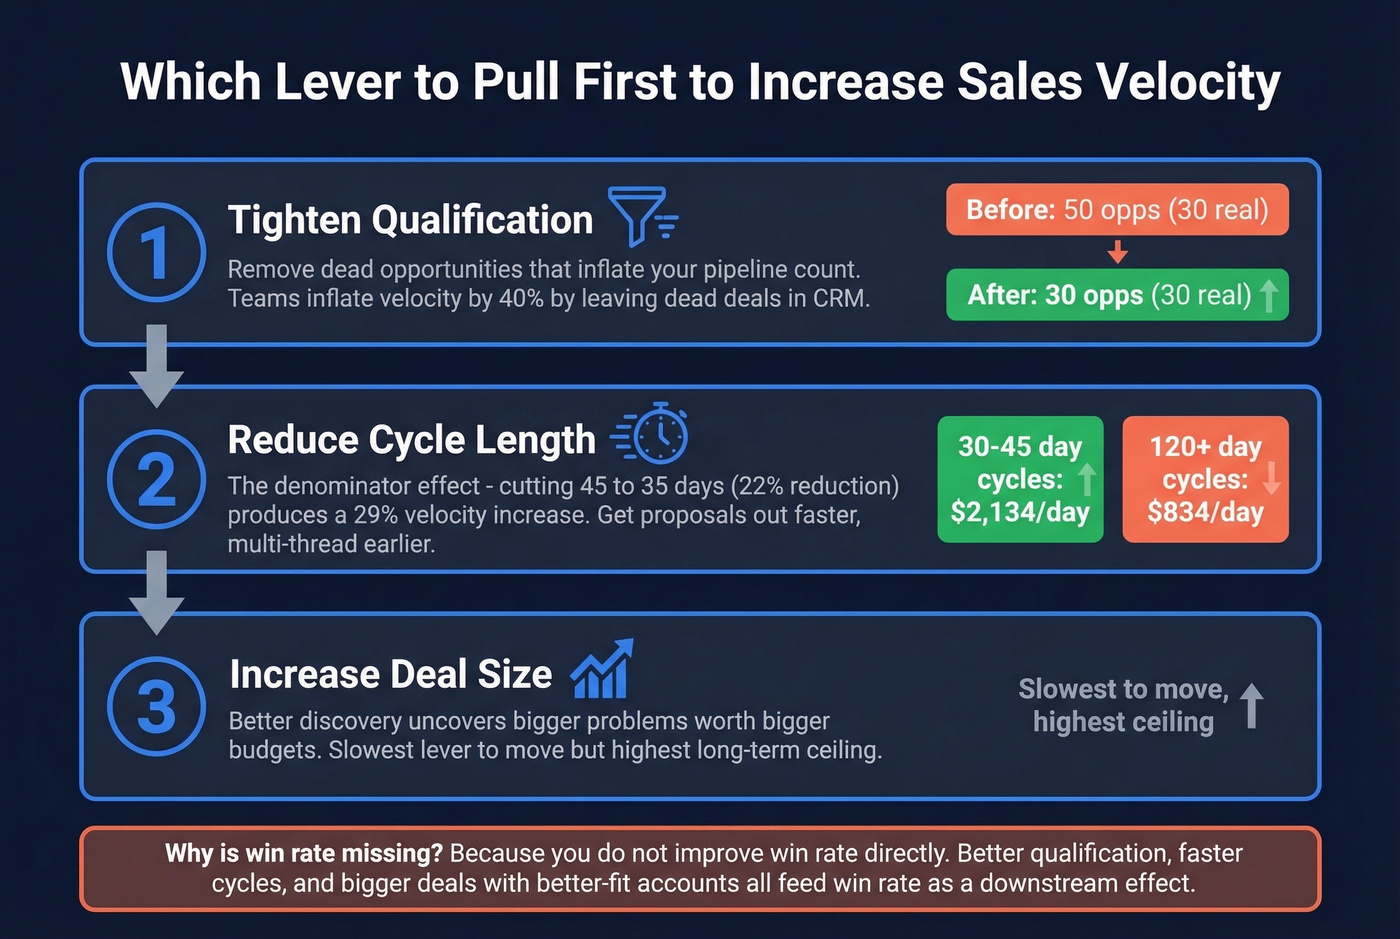
The math is stark. Companies with 30-45 day cycles average $2,134/day; those with 120+ day cycles average just $834/day. And Optifai's analysis shows that cutting cycle length from 45 to 35 days - a 22% reduction - produces a 29% increase in velocity. That's because you're dividing by a smaller number, and the effect amplifies as the numerator stays constant.
Here's the thing: if your average contract value is under $25k, cycle length is almost always your biggest problem. You don't have a closing problem or a deal-size problem - you have a speed problem. Reps are letting deals marinate when they should be forcing a decision.
The ranked order that works best in our experience:
- Tighten qualification - remove dead opportunities that inflate your numerator without converting. We've seen teams inflate their velocity by 40% just by leaving dead opportunities in the pipeline. Every unqualified deal makes your number look better on paper while wasting rep time. (If you need a repeatable scoring system, start with a simple lead scoring model.)
- Reduce cycle length - eliminate handoff delays, get proposals out faster, and multi-thread earlier. Closed-won deals have roughly 2x as many buyer contacts as lost deals, and for deals over $50k, multi-threading boosts win rates by 130%. (This is also where enterprise B2B sales process discipline matters most.)
- Increase deal size - better discovery uncovers bigger problems worth bigger budgets. Slowest lever to move but highest ceiling. Use a tighter discovery questions framework to find budget and urgency earlier.
Why isn't win rate on this list? Because you don't improve win rate directly - you improve it by doing the three things above. Better qualification, faster cycles, and bigger deals with better-fit accounts all feed into win rate as a downstream effect.
Estimating Your Inputs
If you're running a sales velocity calculation for the first time, you might not have clean CRM data for every input. These reference tables will help you sanity-check your numbers.
Sales Cycle Length by ACV
Based on Focus Digital's benchmarks:
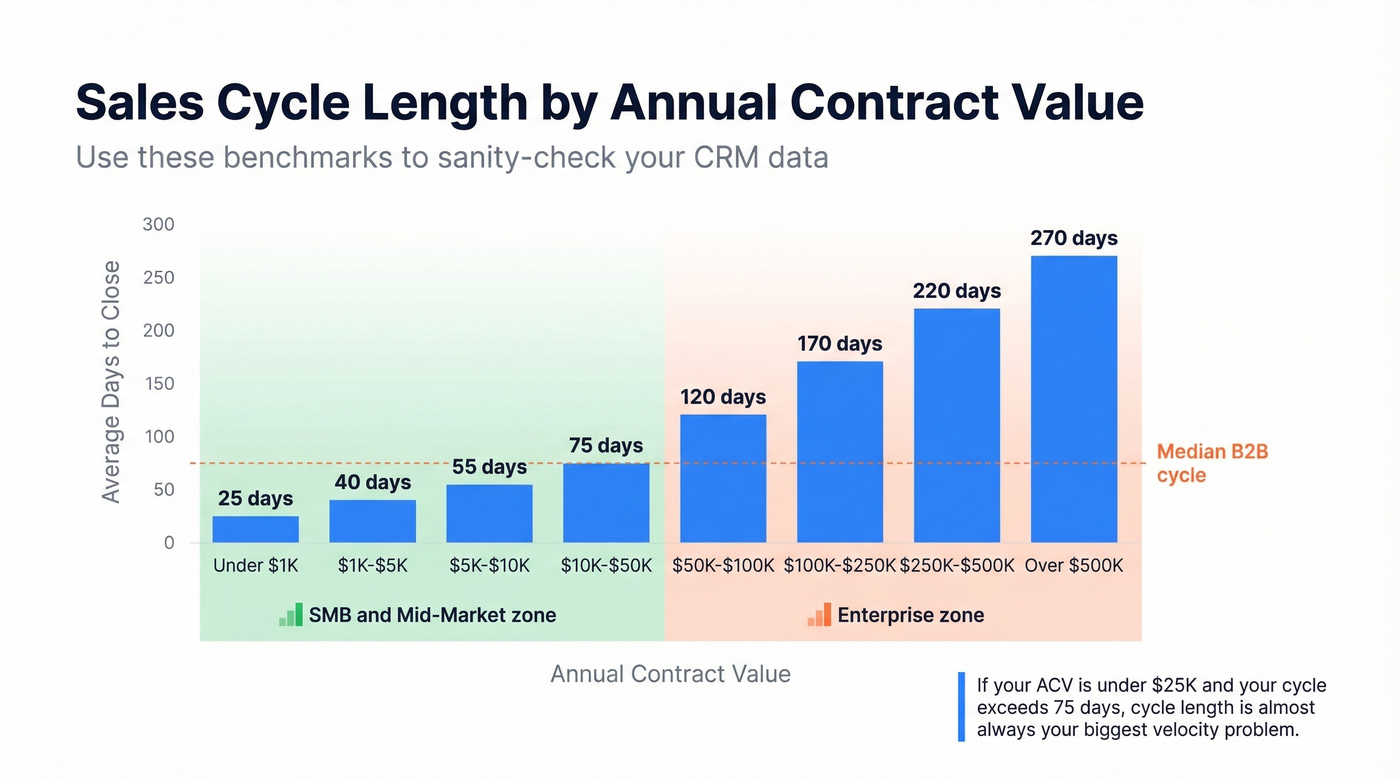
| ACV | Avg Cycle (days) |
|---|---|
| <$1K | 25 |
| $1K-$5K | 40 |
| $5K-$10K | 55 |
| $10K-$50K | 75 |
| $50K-$100K | 120 |
| $100K-$250K | 170 |
| $250K-$500K | 220 |
| >$500K | 270 |
Sales Cycle by Prospect Company Size
| Employee Count | Avg Cycle (days) |
|---|---|
| 1-10 | 38 |
| 11-50 | 57 |
| 51-200 | 77 |
| 201-500 | 95 |
| 501-1,000 | 115 |
| 1,001-5,000 | 135 |
| 5,001-10,000 | 158 |
| 10,001+ | 185 |
Win Rate Ranges
Average B2B win rates run 17-21%. Top performers hit 30%+. A healthy SaaS win rate is 25-30%, though that varies by deal size and sales motion.
For funnel context: Lead to MQL converts at 35-45%, but MQL to SQL drops to roughly 15% - the biggest single-stage drop-off. SQL to Opportunity runs 25-30%, and Opportunity to Closed-won lands at 6-9%. If your win rate looks low, the problem is probably upstream in qualification, not in your closing motion. (See funnel metrics for what to track by stage.)
Common Mistakes That Wreck Your Number
Garbage CRM data. Inconsistent stage definitions, reps who don't update deals, and "opportunities" sitting untouched for 90 days. As LLR Partners notes, you need agreed-upon definitions for what counts as "qualified," "stalled," and "proposal sent." Skip this step and your velocity number is fiction. (This is a common root cause behind broader sales pipeline challenges.)
Counting unqualified opportunities. Every unqualified deal inflates the numerator and makes velocity look artificially healthy - until your forecast is off by 40%. If you're trying to standardize what "qualified" means, use an Ideal Customer Profile and enforce it in your CRM.
Small sample sizes. Don't make budget decisions based on three referral deals that closed in two weeks. RevenueHero flags this explicitly - you need at least a full quarter of data, and for enterprise cycles, 12-18 months before the number stabilizes.
Bad contact data inflating cycle length. This is the one nobody tracks. If 30% of your emails bounce and half your phone numbers are disconnected, reps waste days per deal chasing ghosts. That inflates cycle length and tanks win rate simultaneously. Tools like Prospeo verify emails in real-time with 98% accuracy and provide 125M+ verified mobile numbers, so reps connect with decision-makers on the first attempt instead of the fifth. When every contact in your pipeline is actually reachable, your velocity inputs reflect reality. (If you’re auditing this, start with email bounce rate benchmarks and fixes.)

Tracking Velocity in Your CRM
HubSpot
HubSpot doesn't have a native "sales velocity" report, but you can build one from the Sales Analytics Suite (Sales Hub Professional or Enterprise). Use the Lead funnel report to track cycle time and the Lead response time report to measure engagement speed. Filter by pipeline, owner, and date range, then calculate velocity manually from the component metrics. HubSpot gives you the ingredients but not the recipe - you'll need to export or build a calculated property to get a single velocity number. (If you're comparing stacks, see examples of a CRM and what they can report natively.)
Salesforce
Pull Opportunity data (Amount, Stage, CloseDate, CreatedDate) into Sheets. Compute qualified opp count with COUNTIFS, average deal size with AVERAGEIFS, win rate as closed-won divided by total closed, and average cycle length in days. Apply the formula per rep.
Schedule a refresh every 4 hours and segment by territory, product line, and deal size. This works in Professional edition and above, though most teams running this analysis are on Enterprise (~$165+/user/month). It gives you rep-level velocity leaderboards that Salesforce's native reporting makes surprisingly difficult. Let's be honest - for a platform that costs what Salesforce costs, you'd think they'd have this built in by now. (If you’re pressure-testing your process, pair this with sales operations metrics so velocity doesn’t live in a silo.)
Cutting sales cycle length is the fastest lever to pull - but reps can't close deals faster if 35% of their emails bounce. Prospeo delivers 98% email accuracy and 125M+ verified mobile numbers with a 30% pickup rate, so reps connect with decision-makers on the first attempt instead of chasing dead contacts for weeks.
Stop inflating your cycle length with bad contact data.
FAQ
What's a good sales velocity?
SaaS & Technology companies average $1,847/day; professional services average $876/day; companies in the $1M-$5M revenue band average $687/day. Compare against the benchmark tables above, not an arbitrary number. A "good" velocity is one that's improving quarter over quarter relative to your own baseline.
How often should I recalculate?
Weekly. Teams that track velocity weekly see 34% revenue growth and 87% forecast accuracy versus 11% growth and 52% accuracy for teams that track ad hoc. Daily tracking is noise, but monthly tracking misses trends you could've caught and fixed.
Is pipeline velocity the same thing?
Yes - sales velocity and pipeline velocity use the same formula and produce the same output. The terms are fully interchangeable. Pick one and standardize it across your org to avoid confusion in dashboards and reporting.
How does bad data affect the calculation?
Every input is downstream of data quality. Bounced emails and disconnected numbers add days to each deal, prevent reps from reaching decision-makers, and waste time on unreachable leads. Keeping your CRM current with verified contact data - through regular enrichment and a short refresh cycle - is the fastest way to make sure your velocity inputs reflect reality, not stale records.
What's the fastest lever to improve velocity?
Shorten your sales cycle. Cutting cycle length from 45 to 35 days - a 22% reduction - produces a 29% velocity increase because cycle length is the denominator. For teams with sub-$25k deals, speed almost always matters more than deal size or win rate improvements.