The SDR Metrics Template Your Team Can Actually Use
It's 4:47 on a Friday. Your VP of Sales pings you: "Can you pull together SDR performance numbers for the board deck? Need it by Monday." You open a blank spreadsheet, stare at it, and start Googling for an SDR metrics template. Every result explains what metrics are. None of them hand you the actual spreadsheet.
Let's fix that.
What You Need (Quick Version)
→ Copy the free Google Sheets SDR Metrics Template (make a copy, then customize)
- Copy the template - it uses a 4-layer framework (Effort → Effectiveness → Output → Outcomes) with benchmarks pre-filled from research across 351 B2B companies.
- Adjust targets for your segment and motion (inbound vs. outbound tabs are separate).
- Review weekly with your team.
That's the whole workflow.
How the Scorecard Is Organized
Most SDR scorecards are just activity logs. Dials made, emails sent, meetings booked. That tells you almost nothing about why a rep is underperforming. This template uses a 4-layer framework that diagnoses problems at the right level.
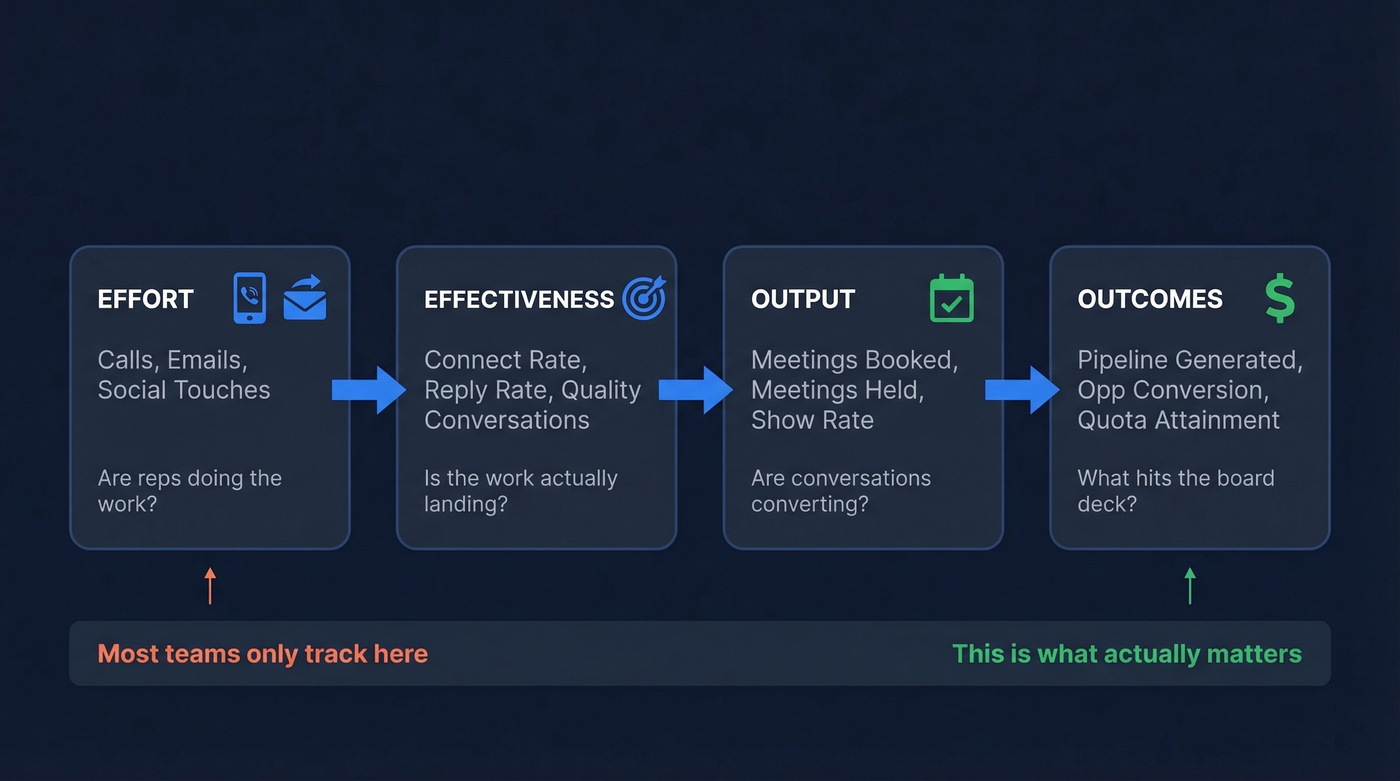
Effort tracks raw activity - calls, emails, social touches. If a rep isn't hitting activity minimums, everything downstream breaks.
Effectiveness is where most teams have a blind spot. It measures quality connects and two-way conversations per activity. Here's a scenario we've seen play out dozens of times: one SDR makes 35 calls and books 7 meetings, while another makes 60 calls and books 3. The difference isn't effort - it's effectiveness. Without this layer, you'd coach the wrong rep.
Output counts qualified meetings booked and held. Not scheduled - held. Show rate separates real pipeline from calendar noise, and the template tracks both so you can spot the gap.
Outcomes ties everything to pipeline dollars and opportunity conversion - what the board deck actually needs.
The workbook includes tabs for daily outreach activity, weekly team rollup, and a dashboard view. Reps log in the input tabs; managers read the dashboard.
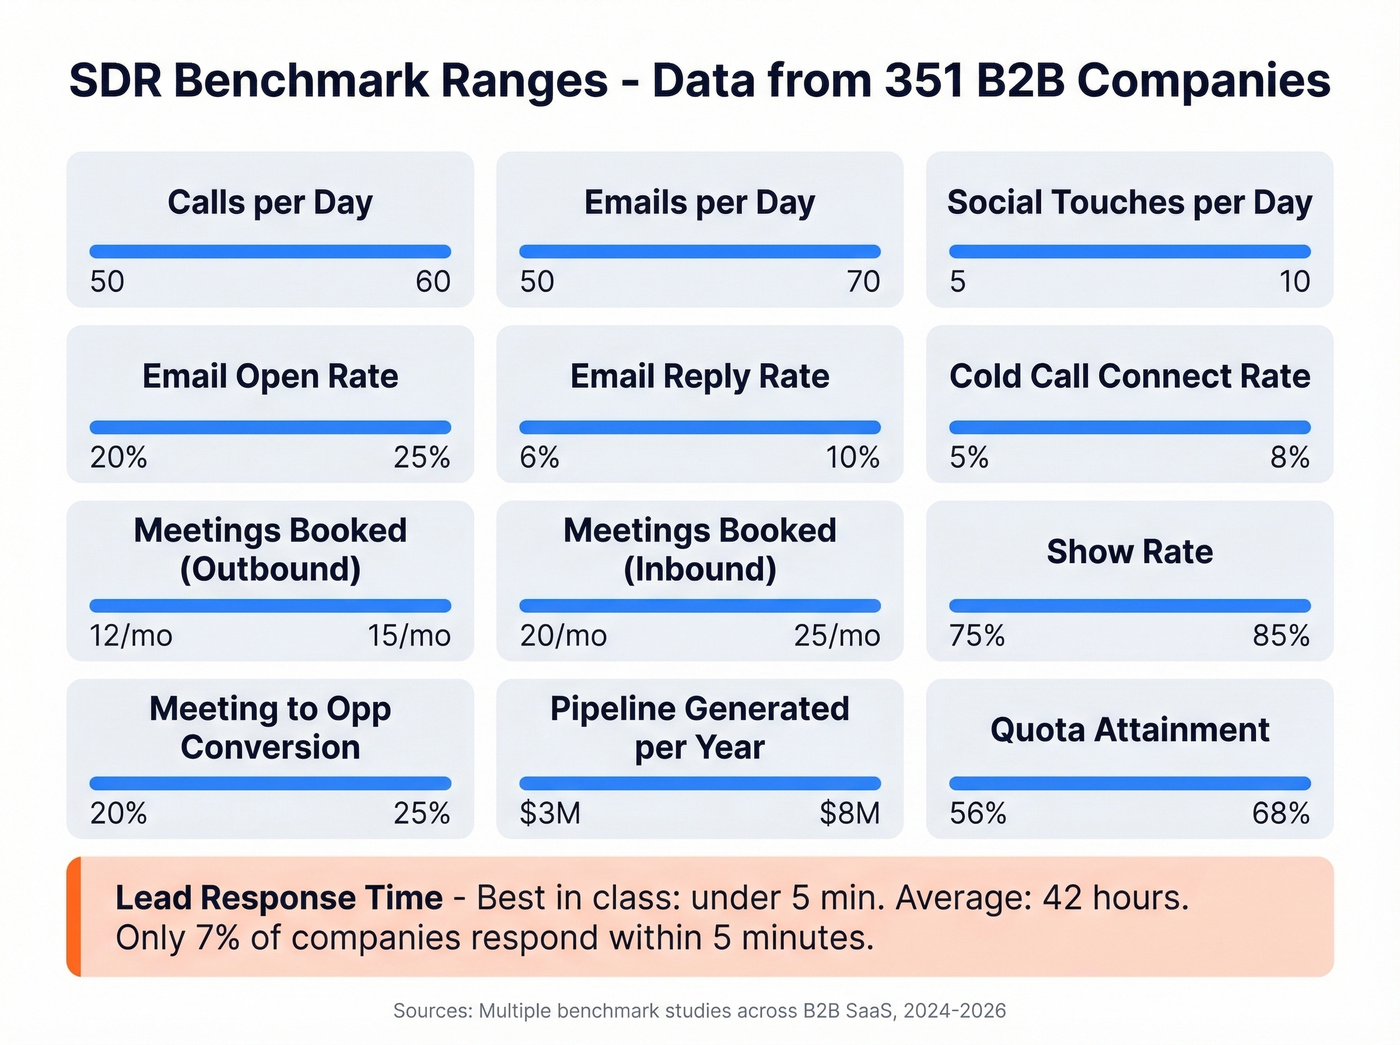
Benchmark Ranges to Pre-Fill Your Targets
Don't start from zero. These ranges come from multiple benchmark studies and give you defensible starting targets.
| Metric | Benchmark Range |
|---|---|
| Calls/day | 50-60 |
| Emails/day | 50-70 |
| Social touches/day | 5-10 |
| Email open rate | 20-25% |
| Email reply rate | 6-10% |
| Cold call connect rate | 5-8% |
| Meetings booked/mo (outbound) | 12-15 |
| Meetings booked/mo (inbound) | 20-25 |
| Show rate | 75-85% |
| Meeting-to-opp conversion | 20-25% |
| Lead response time | <5 min |
| Pipeline generated/year | $3M-$8M |
| Quota attainment | 56-68% |
One stat that should haunt every inbound team: only 7% of companies respond within 5 minutes. The average response time is 42 hours. If your scorecard doesn't track lead response time, you're ignoring the single highest-leverage metric for inbound conversion.
Low connect rates tank every metric on your scorecard. If your SDRs dial 60 numbers and connect on 3, the problem is upstream. Prospeo's 125M+ verified mobile numbers hit a 30% pickup rate - that's 3x the industry average. Stop coaching reps on a data quality problem.
Replace dead numbers with verified direct dials for ~$0.01 each.
Customizing the Template for Your Team
The benchmarks above are starting targets. Your targets need to reflect your reality.
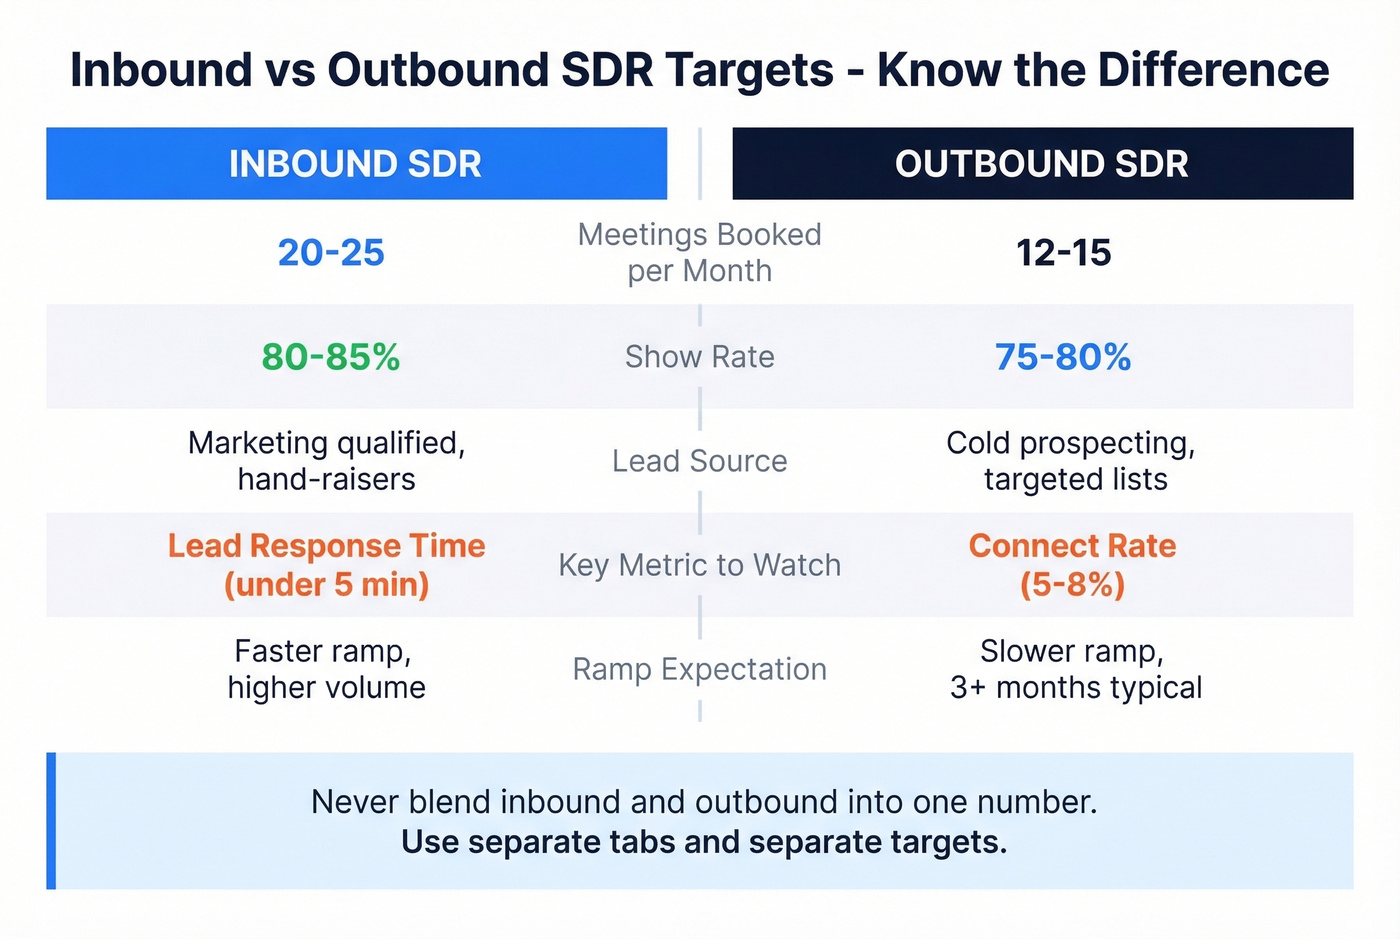
Inbound vs. outbound - Inbound SDRs should book 20-25 meetings/month with higher show rates. Outbound targets are 12-15. The template has separate tabs, so don't blend these into one number.
SMB vs. enterprise - SMB reps run higher volume with shorter cycles. For tougher segments or during ramp, 8-10 meetings/month is a perfectly reasonable target.
Org structure - The average SDR-to-AE ratio is 1:2.4 and average ramp time runs 3.0 months. Don't hold new reps to full targets before that window closes. (If you need a ramp framework, use a 30-60-90 day plan.)
Rep-level vs. team-level - The workbook includes both views. Managers need the team rollup; coaching conversations need the rep-level detail.
Three Mistakes That Break Your Tracking
Tracking volume without conversion context
Sixty calls a day means nothing if the connect rate is 2%. The template calculates conversion rates automatically - calls-to-connects, connects-to-meetings, meetings-to-opps - so you can spot where the funnel breaks. Here's the formula for the one we see teams miss most: Connect Rate = Connected Calls / Total Dials x 100.
No qualitative scoring
We've seen teams where meeting volume looks great but pipeline quality is terrible. The fix is simple: add a 1-5 quality score per meeting in your CRM. It takes 10 seconds and saves months of misdiagnosis. Skip this if your team books fewer than 10 meetings a month - at that volume, you can review each one manually.
Bad contact data inflating activity
Here's the thing: if your reps log 60 dials a day but connect on fewer than 3%, the problem isn't the reps - it's the data. High bounce rates and low connect rates are upstream data quality problems masquerading as rep performance issues. Fix the data before you coach the reps. In our experience, teams that switch to verified contact sources see connect rates jump almost immediately, because they're no longer burning dials on dead numbers and invalid emails. (If you're evaluating vendors, start with data enrichment services and a clean sales prospecting database.)
Most SDR "performance problems" are actually data problems. If your bounce rate is above ~5%, no amount of call coaching will move the needle. For deeper benchmarks and fixes, see our guide to email bounce rate.
Your scorecard tracks bounce rate for a reason - anything above 5% means your reps are burning activity on bad contacts. Prospeo's 5-step verification delivers 98% email accuracy and refreshes every 7 days, so your Effort metrics actually convert to Outcomes.
Fix the data layer and watch every downstream metric climb.
Setting This Up in Your CRM
HubSpot: Build a dashboard with connected calls vs. goal, meetings booked vs. goal, average lead response time, and new contacts not worked. That last widget is the one most teams skip - it catches leads falling through the cracks. If you're standardizing your process, pair this with an ideal customer profile.
Salesforce: Set the SDR dashboard as the homepage for every rep. If they don't see it on login, they won't use it. Create separate targets for calls vs. emails rather than lumping everything into "activities." The consensus on r/salesforce is that blended activity metrics are the number one reason SDR dashboards get ignored. If you're rebuilding reporting, use a sales operations metrics framework.
Google Sheets: For teams under 10 reps, the template workbook is all you need. We've found it's faster to update than a CRM dashboard and easier to customize. Graduate to CRM-native reporting once you've validated which KPIs actually drive coaching conversations. If you want to connect outreach + reporting, follow a sales engagement platform rollout.
FAQ
How many metrics should an SDR team track?
Eight to ten across the four layers. The template includes 13 fields but highlights the 8 that matter most for weekly reviews. Start with those before adding complexity.
What's a good meetings-booked target for outbound SDRs?
Twelve to fifteen qualified meetings per month for a ramped rep. Top performers hit 18-20. Plan for 15-25% no-shows when forecasting pipeline from your scorecard.
How do I improve SDR connect rates without more dials?
Start with data quality - verified emails and direct dials outperform generic company numbers by a wide margin. Prospeo's verified mobile numbers see a 30% pickup rate, compared to 11-12% on most competitor databases. Beyond data, test call timing and sequencing. Pairing a voicemail with a follow-up email within 5 minutes, for example, consistently boosts callbacks more than either channel alone.