Straight Line Forecasting: Formula, Examples & Validation Guide
Your CFO asks for a revenue projection by Friday. You open Excel, plot last year's numbers, add a trendline, and call it done. Then someone on your team points out the R-squared is 0.2784 - meaning the line explains roughly 28% of the variance in your data. That scenario comes from a real r/statistics thread, and straight line forecasting gone wrong is more common than you'd think.
Quick version:
- The formula: Forecasted value = Current value x (1 + growth rate)
- When to use it: Stable, non-seasonal business with several years of consistent historical data
- When to skip it: SaaS/subscription revenue, seasonal businesses, volatile markets
- The rule: If your holdout MAPE is over 10%, switch to moving average or regression
What Is a Straight-Line Forecasting Model?
Straight line forecasting extrapolates prior performance by assuming your growth rate stays constant. You take your most recent period's result, apply a fixed growth or decline rate, and project it forward.
The formula is Forecasted value = Current value x (1 + growth rate), where growth rate = (Current period - Prior period) / Prior period. If revenue grew from $950K to $1M, your growth rate is ($1,000,000 - $950,000) / $950,000 = 5.26%.
The upside? You can explain it to anyone in thirty seconds. The downside is it assumes tomorrow looks exactly like today, compounded forward. That simplicity is exactly what makes this model so popular as a starting point in corporate finance - and a useful baseline alongside revenue forecasting methods that incorporate more drivers.
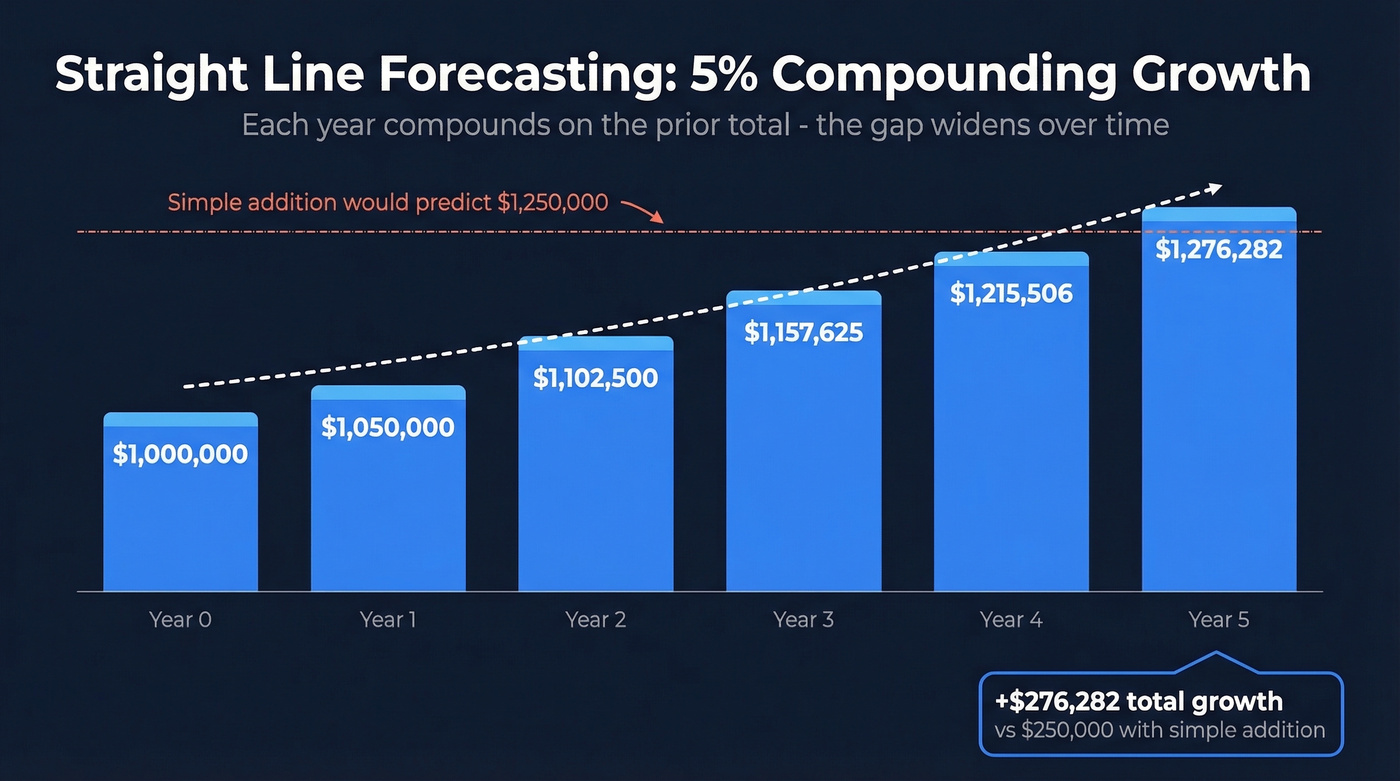
Worked Example - 5-Year Revenue Projection
A restaurant chain generated $1,000,000 in revenue last year with a consistent 5% annual growth rate. Here's what a linear projection produces:
| Year | Starting Revenue | Growth Rate | Projected Revenue |
|---|---|---|---|
| 0 | - | - | $1,000,000 |
| 1 | $1,000,000 | 5% | $1,050,000 |
| 2 | $1,050,000 | 5% | $1,102,500 |
| 3 | $1,102,500 | 5% | $1,157,625 |
| 4 | $1,157,625 | 5% | $1,215,506 |
| 5 | $1,215,506 | 5% | $1,276,282 |
Each year's growth compounds on the prior total, so Year 5 lands at $1,276,282 - not $1,250,000. Over longer horizons, that gap widens fast.
How to Build It in Excel
Step 1: Enter your historical revenue in a row (cells B7 and C7 for two consecutive years).
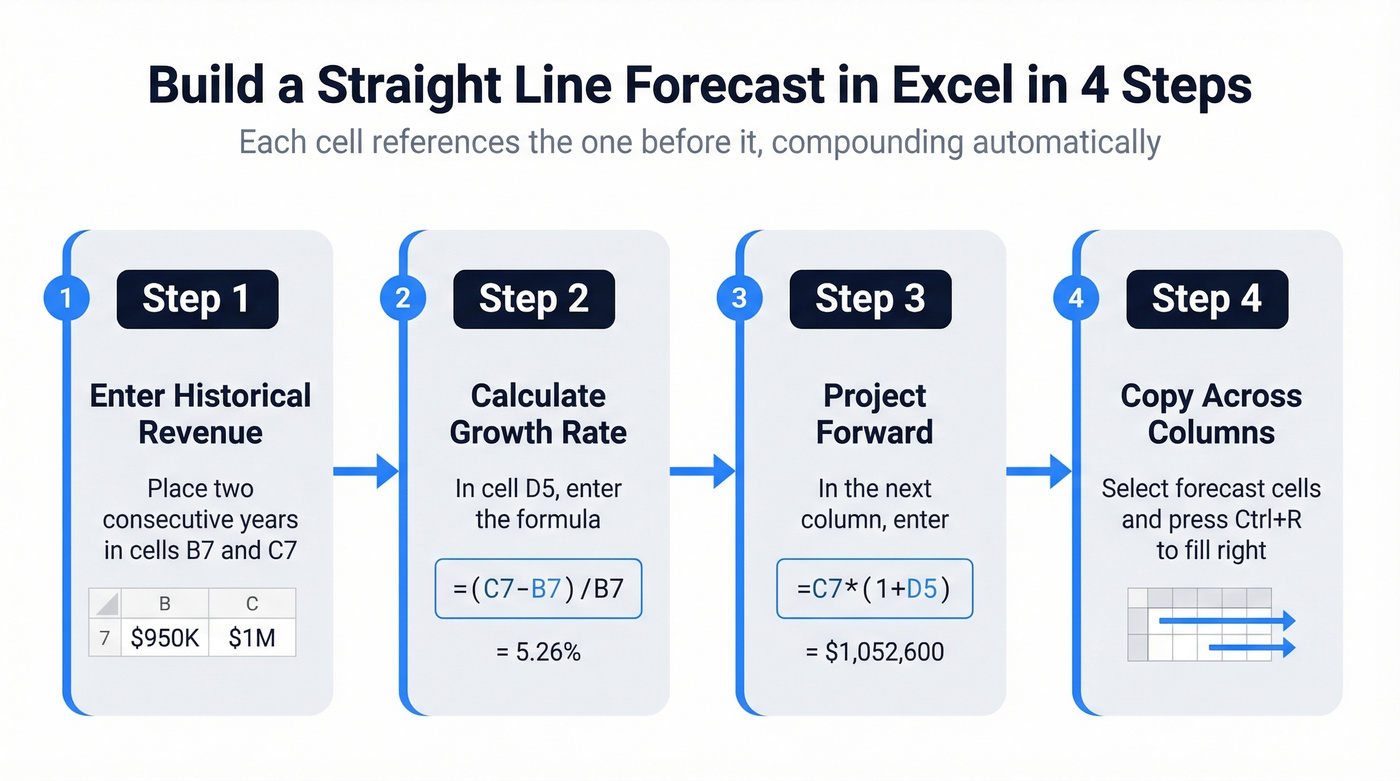
Step 2: Calculate the growth rate in D5 with =(C7-B7)/B7.
Step 3: Project forward with =C7*(1+D5) in the next column.
Step 4: Select the forecast cells and hit Ctrl+R to copy across columns. Each cell references the one before it, compounding automatically.
For a quick sanity check, try Data > Forecast Sheet - Excel generates a projection with confidence bounds and can detect seasonality. We've watched teams spend weeks building complex models when a validated linear forecast plus this built-in tool would've gotten them to a solid answer much faster.
Your straight line forecast is only as reliable as the pipeline underneath it. If 35% of your prospect emails bounce, you're projecting revenue from contacts who never received your outreach. Prospeo delivers 98% email accuracy with a 7-day data refresh - so the pipeline numbers feeding your model reflect real opportunities, not stale CRM records.
Stop compounding bad data forward. Start with verified contacts.
When to Use This Method
Straight line forecasting works best for stable, non-seasonal businesses with predictable revenue patterns - think utilities, established B2B services, or mature retail. You need several years of consistent historical data showing a clear, steady trend, and the forecast horizon should be short: one to three years at most.
It's also great for quick board-level estimates where directional accuracy matters more than precision, and as a baseline comparison before testing whether a more complex method actually improves your numbers - especially if you’re standardizing your forecast management process.
Let's be honest: you don't need to learn nine forecasting methods. Master one, validate it, know when to upgrade. A constant-growth projection is a strong starting point for finance teams that aren't dealing with heavy seasonality or subscription dynamics.
When the Model Breaks
Seasonality and External Shocks
As Hans Rosling argued in Factfulness, many growth patterns are S-shaped - they accelerate, then decelerate. A linear projection misses both the inflection and the plateau. The operational risk is real, too: 60% of finance professionals report that manual data entry leads to critical errors in financial forecasting.
If seasonality is a real driver, you’ll usually get better results with seasonal sales forecasting or at least a moving-average baseline.
SaaS and Subscription Revenue
For SaaS, straight-line revenue forecasting is borderline negligent.
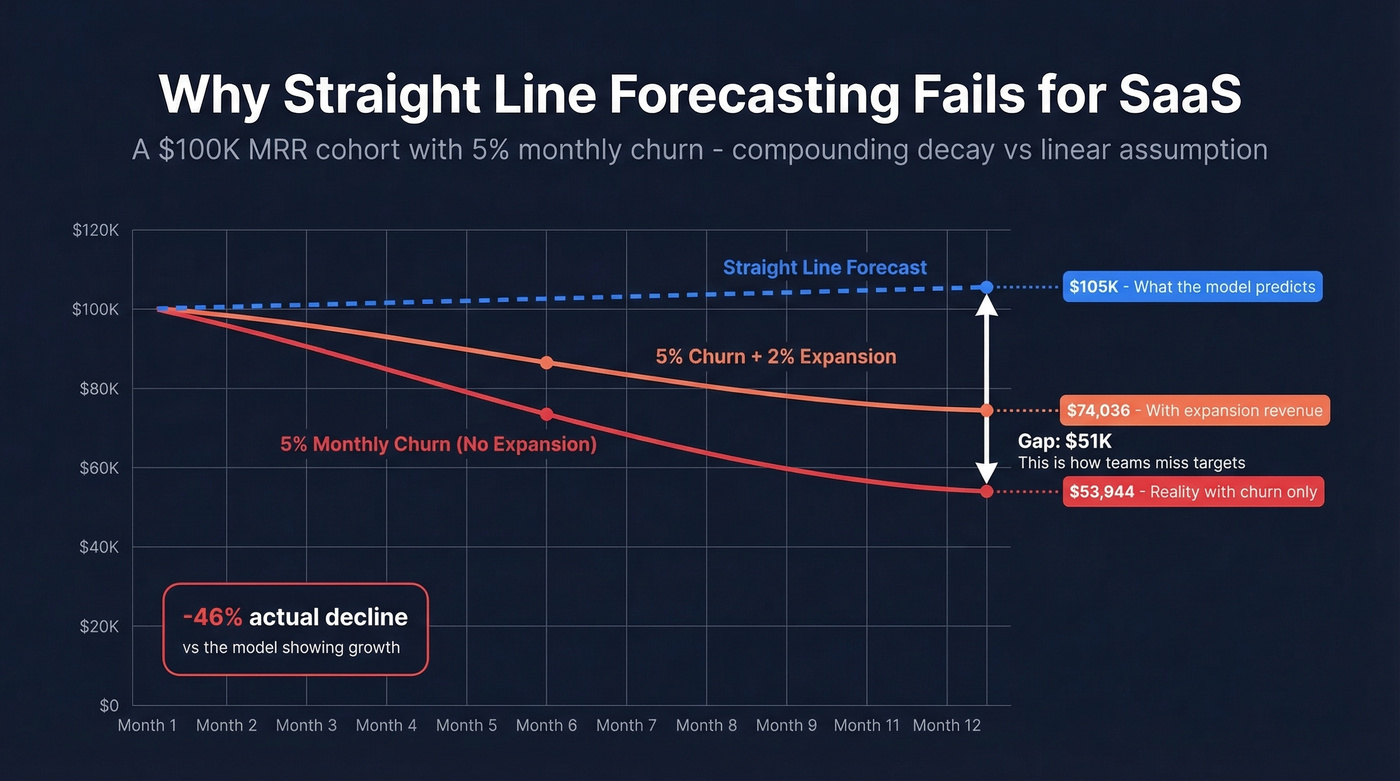
Take a $100K MRR cohort with 5% monthly gross revenue churn and no expansion. By month 12, that cohort is worth $53,944 - a 46% drop. Add 2% monthly expansion revenue, and you're at $74,036. Still contracting. A constant-rate model would've told you revenue was growing, which is exactly the kind of mistake that gets people fired.
Benchmarkit's 2025 benchmark report shows median net revenue retention at 101%, with the 75th percentile at 110%. Even "good" SaaS companies barely hold flat on existing cohorts. We've seen teams miss targets because they applied a linear growth rate to a business with compounding churn underneath - the numbers looked fine until Q3 actuals came in 22% below plan.
If you’re forecasting SaaS, you’ll typically want churn-aware inputs like revenue churn rate and pipeline-weighting logic such as weighted pipeline.
How to Validate Your Forecast
A forecast without validation is just a guess with a spreadsheet attached.
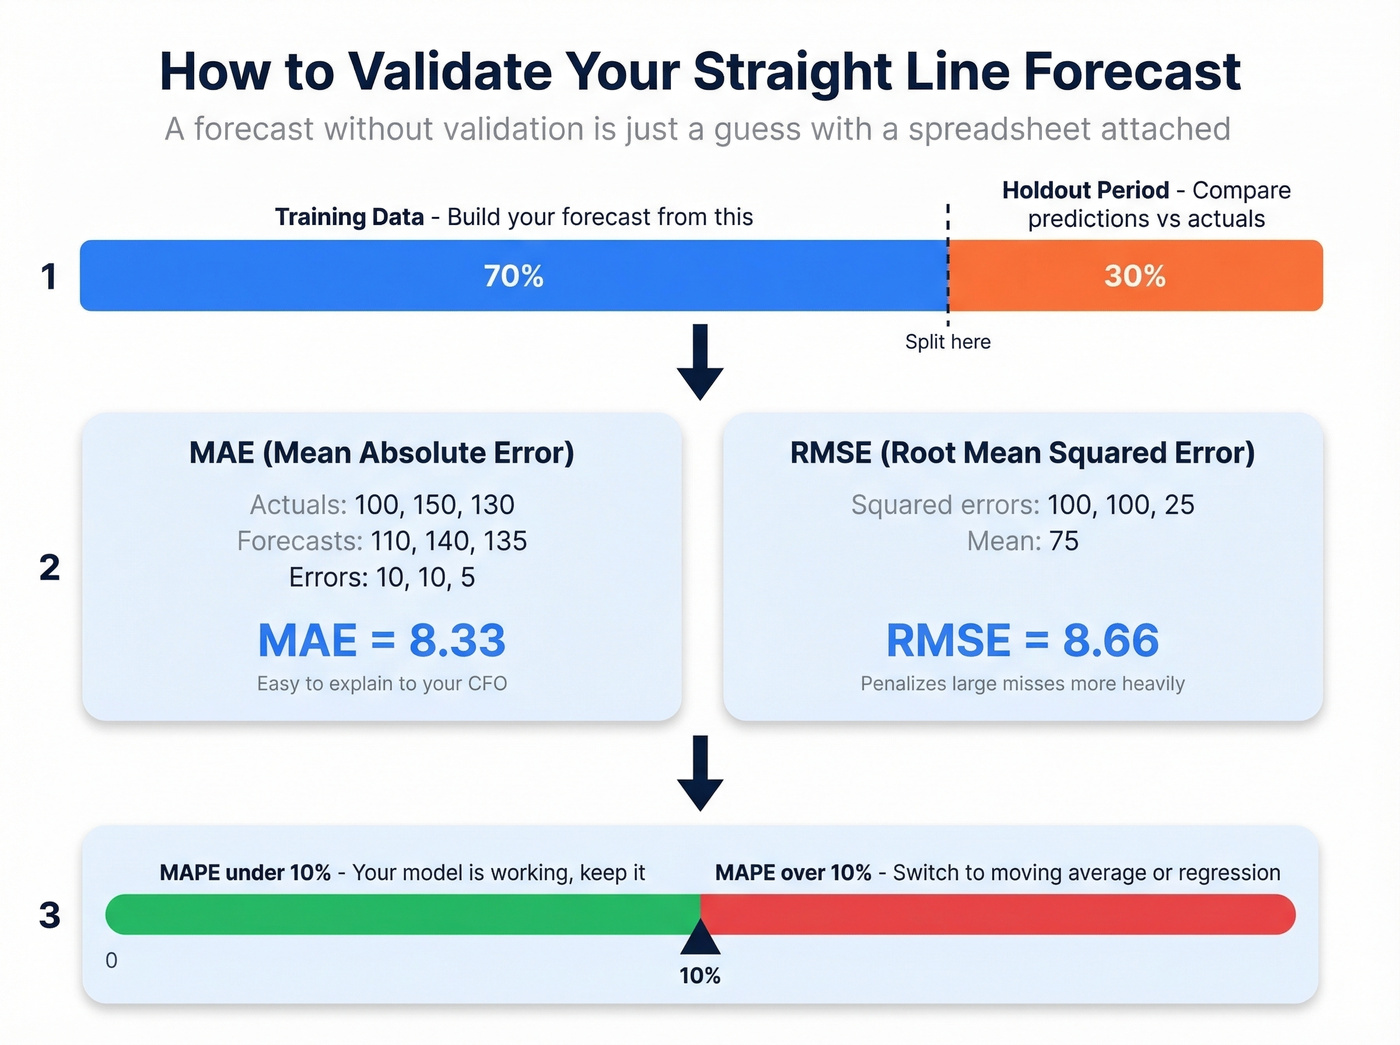
Set aside a holdout period. Reserve a recent slice of historical data. Build your forecast using only the earlier data, then compare predictions against holdout actuals. This is the approach Oracle documents for evaluating forecasting methods on historical data before choosing one.
Calculate MAE and RMSE. Say your actuals are 100, 150, 130 and your forecasts are 110, 140, 135. Absolute errors: 10, 10, 5 - giving you a MAE of 8.33. Squared errors: 100, 100, 25 - mean of 75 - giving you an RMSE of about 8.66. RMSE penalizes large misses more heavily; MAE is easier to explain to your CFO. Use both. In our experience, the holdout test catches problems that R-squared alone misses entirely.
The practical threshold is straightforward: if MAPE is over 10% on stable revenue lines, switch methods. (If you want a broader benchmark framework, see sales forecast accuracy.)
One thing most forecasting guides skip - your revenue forecast is only as good as the pipeline feeding it. If prospect emails bounce at 35%, your pipeline is fiction, and your projection compounds that fiction forward. Prospeo verifies contact data in real time with 98% email accuracy and a 7-day refresh cycle, so the numbers feeding your forecast reflect reality rather than stale CRM records.
Straight Line vs. Other Methods
| Method | Best For | Math Required | Data Needed | Key Limitation |
|---|---|---|---|---|
| Straight line | Stable trends | Minimal | Historical data | Ignores volatility |
| Moving average | Seasonal data | Minimal | Historical data | Lags trend shifts |
| Simple regression | Driver analysis | Moderate | Sample observations | One variable only |
| Multiple regression | Complex drivers | Advanced | Large sample set | Overfitting risk |
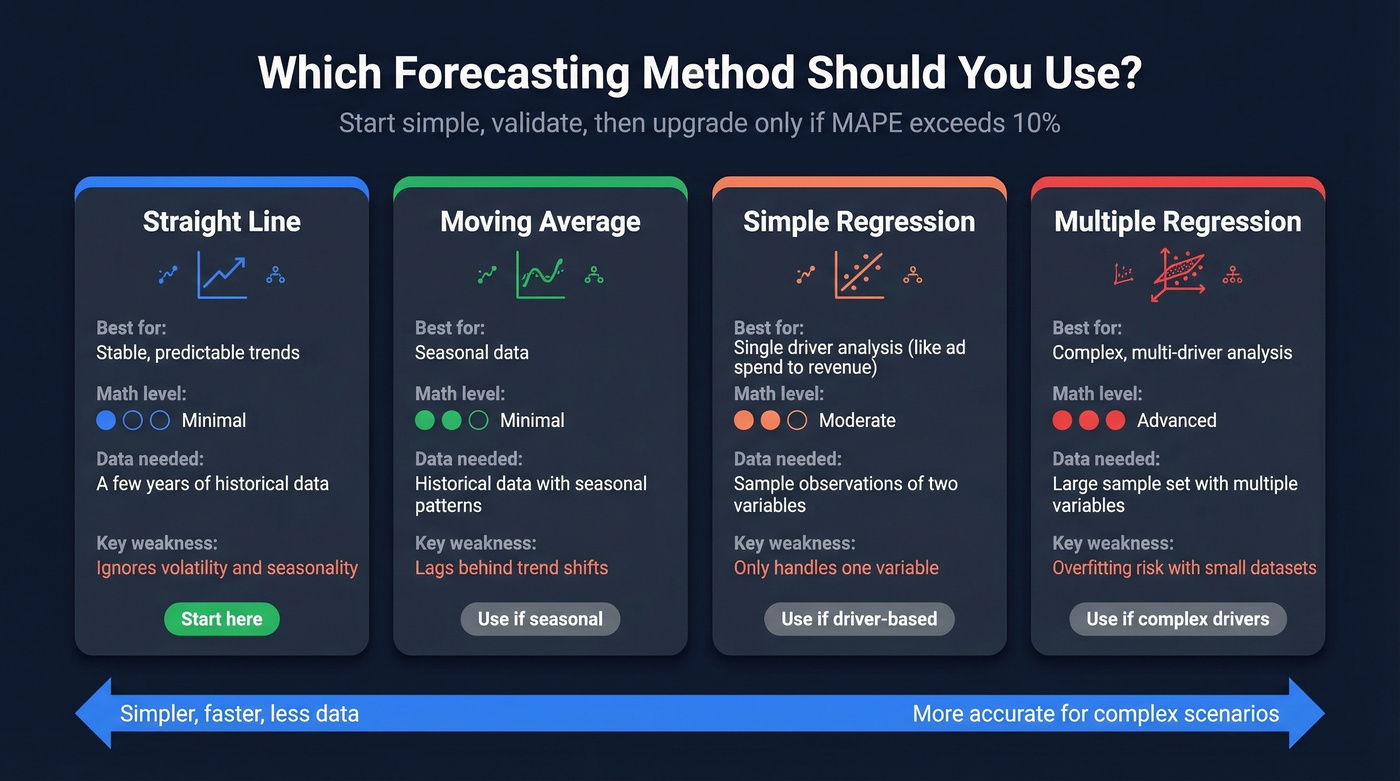
Start with a linear projection. Validate with a holdout test. If MAPE is over 10%, try moving average for seasonal data or regression if you suspect a driver relationship like ad spend to revenue. Gartner estimates 90% of finance teams will deploy at least one AI solution by 2026 - but you still need a baseline method to benchmark against.
Skip straight line entirely if your business has strong seasonality, subscription mechanics, or fewer than three years of historical data. For those situations, a moving average or cohort-based model will save you from projecting a fantasy - especially if your sales org relies on a formal sales forecasting solutions stack.
Here's our hot take: most teams over-invest in model complexity and under-invest in data quality. A straight line forecast built on clean, verified pipeline data will beat a sophisticated model fed garbage inputs every single time. If you’re pressure-testing pipeline integrity, start with the pipeline formula and tighten your pipeline management rules.
You just learned that a MAPE over 10% means your forecast method needs upgrading. Apply the same rigor to your data inputs. Prospeo's 5-step verification and 7-day refresh cycle cut bounce rates from 35% to under 4% - turning pipeline fiction into numbers your CFO can actually trust.
Validate your forecast inputs the way you validate your forecast model.
FAQ
What is the straight line forecasting formula?
Forecasted value = Current value x (1 + growth rate), where growth rate = (Current period - Prior period) / Prior period. The method assumes this rate stays constant, making it a compound growth projection rather than a simple additive one.
Is straight line forecasting accurate?
It's accurate for stable, non-seasonal businesses with consistent growth over several years. For volatile or subscription-based businesses, it systematically mispredicts. Validate with a holdout test - if MAPE exceeds 10%, switch to moving average or regression.
How do you forecast revenue for a sales-driven business?
Start with a constant-growth projection of historical revenue, then validate the pipeline data feeding it. Stale contact data inflates pipeline numbers, which compounds forecast error. Backtest against actuals quarterly, and make sure the emails and phones in your CRM are actually current - bounced outreach doesn't close deals.