TAM vs SAM vs SOM: The Founder's Guide With Real Benchmarks
Your co-founder just dropped "$50B TAM" on the market slide. The investor across the table hasn't blinked - but not in a good way.
Most founders get TAM vs SAM vs SOM wrong, and the mistake costs them the round. Uber's original pitch deck pegged their market at $4.2B, which turned out to be laughably low. Most founders make the opposite mistake: inflating TAM until the number loses all meaning. Here's how to get the math right - with the realistic benchmarks every other guide skips.
The Quick Version
TAM (Total Addressable Market): The entire revenue opportunity if you sold to every possible customer. It's the ceiling.
SAM (Serviceable Addressable Market): The slice of TAM you can actually reach with your product, channels, and geography today.
SOM (Serviceable Obtainable Market): What you'll realistically capture in the next 36 months given your team, budget, and competitive position.
What's a "good" TAM? $1B+ for VC-backed startups. Below that, exit math breaks.
What's a realistic SOM? 1-5% of SAM over 36 months for early-stage companies. If you're claiming 10%+, investors will push back.
What TAM, SAM, and SOM Actually Mean
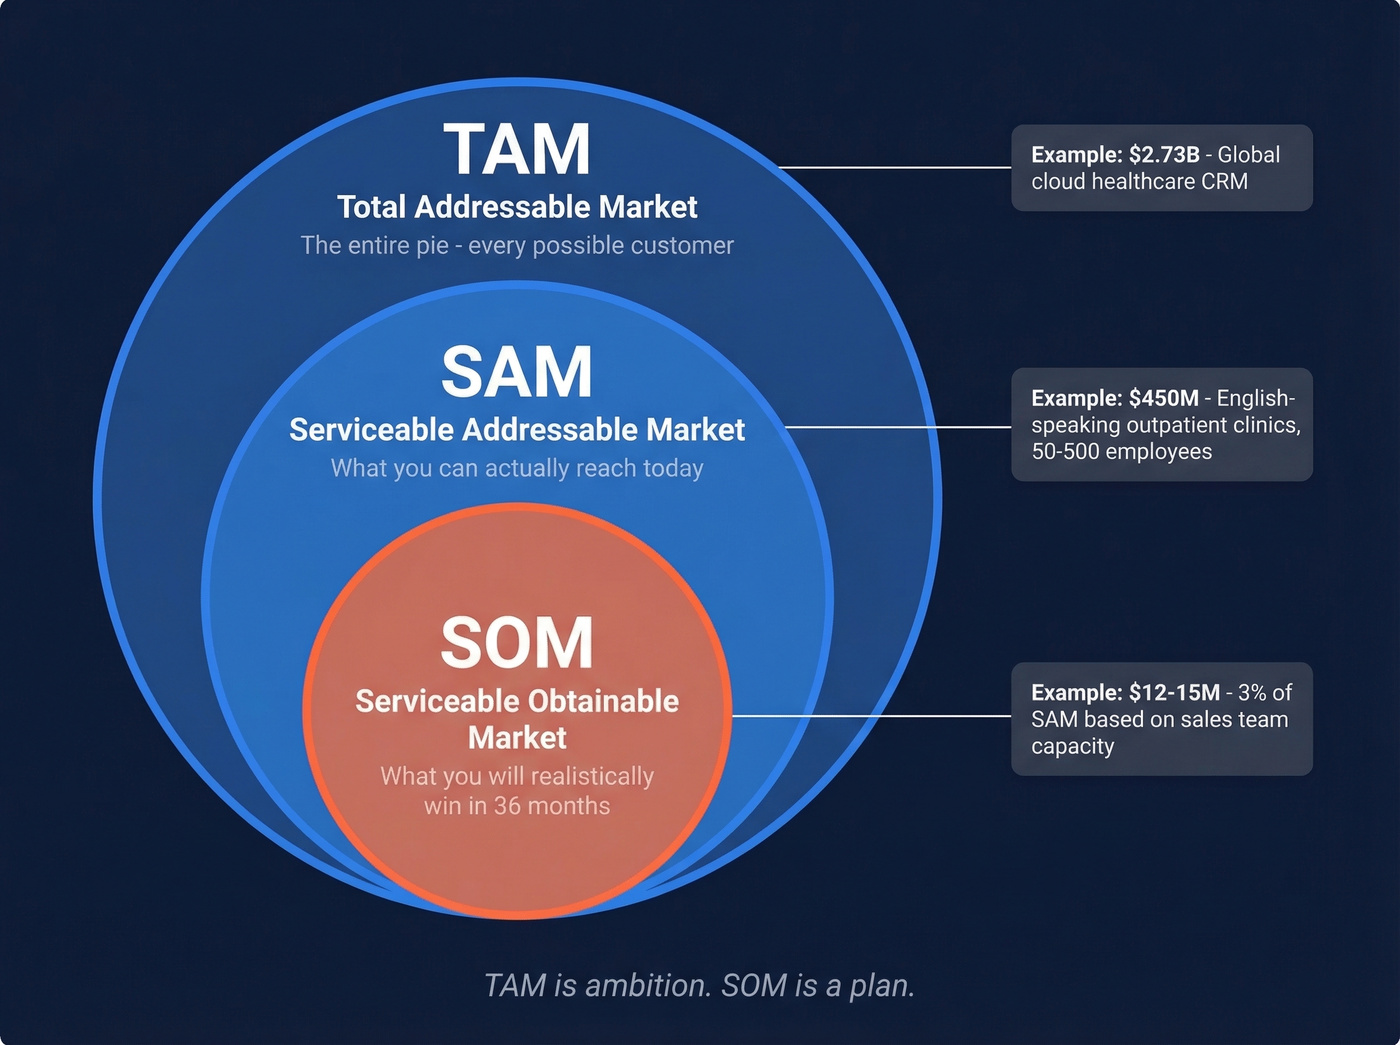
Think of these as three nested circles. TAM is the outer ring - the total market if geography, competition, and product limitations didn't exist. SAM sits inside it, constrained by what you can actually serve. SOM is the bullseye: the revenue you'll realistically book. If you want a deeper definition and examples, see our guide to addressable market.
| Term | Full Name | Question It Answers | Who Cares Most | Common Mistake |
|---|---|---|---|---|
| TAM | Total Addressable Market | How big is the whole pie? | Board, strategy | Inflating with top-down only |
| SAM | Serviceable Addressable Market | How much can we serve? | Product, GTM team | Confusing it with TAM |
| SOM | Serviceable Obtainable Market | What will we actually win? | Sales, finance | Overstating share % |
TAM is ambition. SOM is a plan. Confusing the two is how founders end up with market slides that make investors wince, and understanding this difference early saves you from building a pitch that collapses under basic due diligence.
Why Investors Care
Every VC's reaction to your market slide comes down to one equation.
A venture investor needs a path to a $200M+ exit. If your plan requires roughly $50M in ARR, and your TAM is $200M, you'd need 25% market share to hit that number - and even mature companies rarely exceed ~20%. The math just doesn't work.
That's why the $1B TAM threshold exists. It's not arbitrary. It's the minimum where a startup can capture a plausible 5-10% slice and still generate venture-scale returns. Below $1B, you're telling the investor their upside is capped before you've even started.
Here's the thing: stop obsessing over TAM. Every founder can find a way to justify a big number. What actually separates fundable decks from forgettable ones is a credible SOM - a bottoms-up estimate of what you'll capture in the next 36 months, grounded in your team's capacity, conversion rates, and go-to-market motion. (If you need a framework for the motion itself, use a B2B sales funnel template to map stages and assumptions.) In our experience reviewing pitch decks, the founders who get funded fastest lead with SOM, not TAM. Nail your SOM, and investors will trust your TAM.
Three Ways to Calculate TAM
Top-Down: Start Here, Don't Stop Here
This is the method investors trust least. You start with a broad industry number from an analyst report and filter down to your niche. It's fast, but it's never enough on its own.
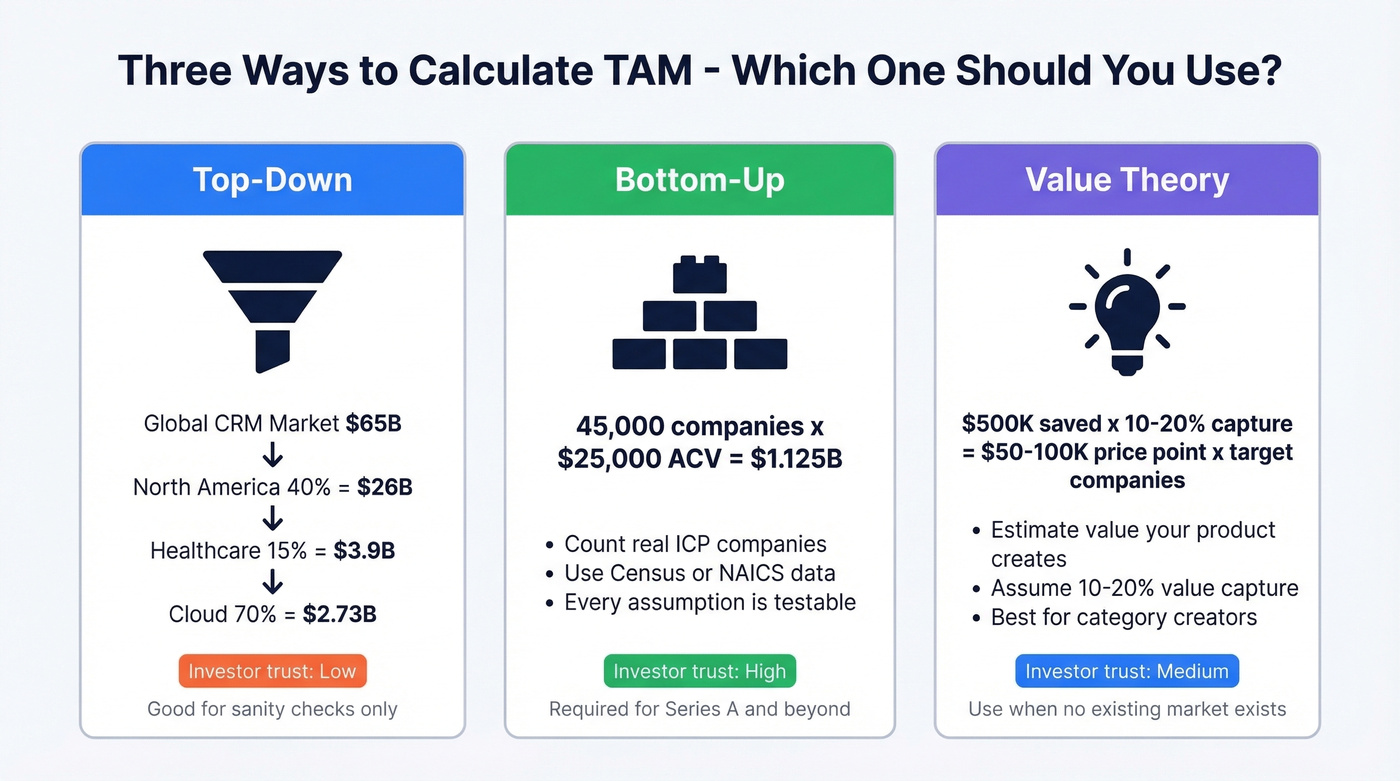
A healthcare CRM example shows why. The global CRM market is roughly $65B. North America represents about 40%, or $26B. Healthcare accounts for 15% of CRM spend, giving you $3.9B. Cloud-deployed solutions - your product - make up 70% of new purchases: $2.73B TAM. Every one of those percentages is debatable, and the Gartner or IDC report you'd need to source them often costs thousands. Investors know this. Top-down is a sanity check, not a strategy.
Bottom-Up: The Method That Matters for Series A
Bottom-up is the only approach that earns real credibility, because it forces you to define your ICP precisely. Count your actual potential customers and multiply by what they'd pay. (If you need a starting point, use an Ideal Customer Profile template.)
Step 1: Identify your ICP. For an HR analytics platform targeting mid-sized tech companies, that means companies with 100-1,000 employees in the technology sector across North America.
Step 2: Count them. NAICS codes and County Business Patterns data from the Census Bureau give you roughly 45,000 mid-sized tech companies in North America.
Step 3: Multiply by ACV. At $25,000 per year, that's a TAM of $1.125B.
The beauty is that every assumption is testable. Someone can challenge "45,000 companies" and you can point to the data source. You can also cross-reference government estimates against a sales prospecting database like Prospeo, filtering by industry, headcount, tech stack, and funding to see how many companies actually match your buyer profile.
Value Theory: For Category Creators
When you're building something genuinely new, value theory is your best option. Instead of counting existing buyers, estimate the value your product creates and assume you'll capture a portion of it.
If your software saves a mid-market company $500K per year in operational costs, and software typically captures 10-20% of the value it creates, your price point is $50-100K. Multiply by the number of companies with this problem, and you've got a TAM. Antler's framework suggests starting with comparable product pricing, then adding a premium for differentiated value. It's less precise than bottom-up, but for pre-revenue, category-creating products, it's often the only honest approach.
Bottom-up TAM requires counting real companies that match your ICP. Prospeo's database of 300M+ profiles with 30+ filters - headcount, industry, funding, tech stack, department size - lets you validate market sizing assumptions with actual buyer counts instead of analyst estimates.
Replace guesswork with real ICP counts. Start for free.
How to Calculate SAM and SOM
Narrowing TAM to SAM
SAM is TAM minus everything you can't actually serve right now. The gap comes down to practical constraint filters: geography, product fit, channel reach, language, and compliance requirements.
Continuing the healthcare CRM example: your $2.73B TAM drops significantly once you limit to outpatient clinics (roughly 30% of healthcare CRM spend), English-speaking markets, and organizations with 50-500 employees that fit your product's sweet spot. You land at a SAM of $400-500M. That's still a strong number, but it's honest about where your product fits today.
Realistic SOM Benchmarks
This is where most guides fail. The consensus on r/startups is that there are "lots of definitions, but no information about what really realistic assumptions are." One founder asked whether TAM/SAM/SOM even belongs in a pre-seed deck - it does, but the bar is lower than you think.
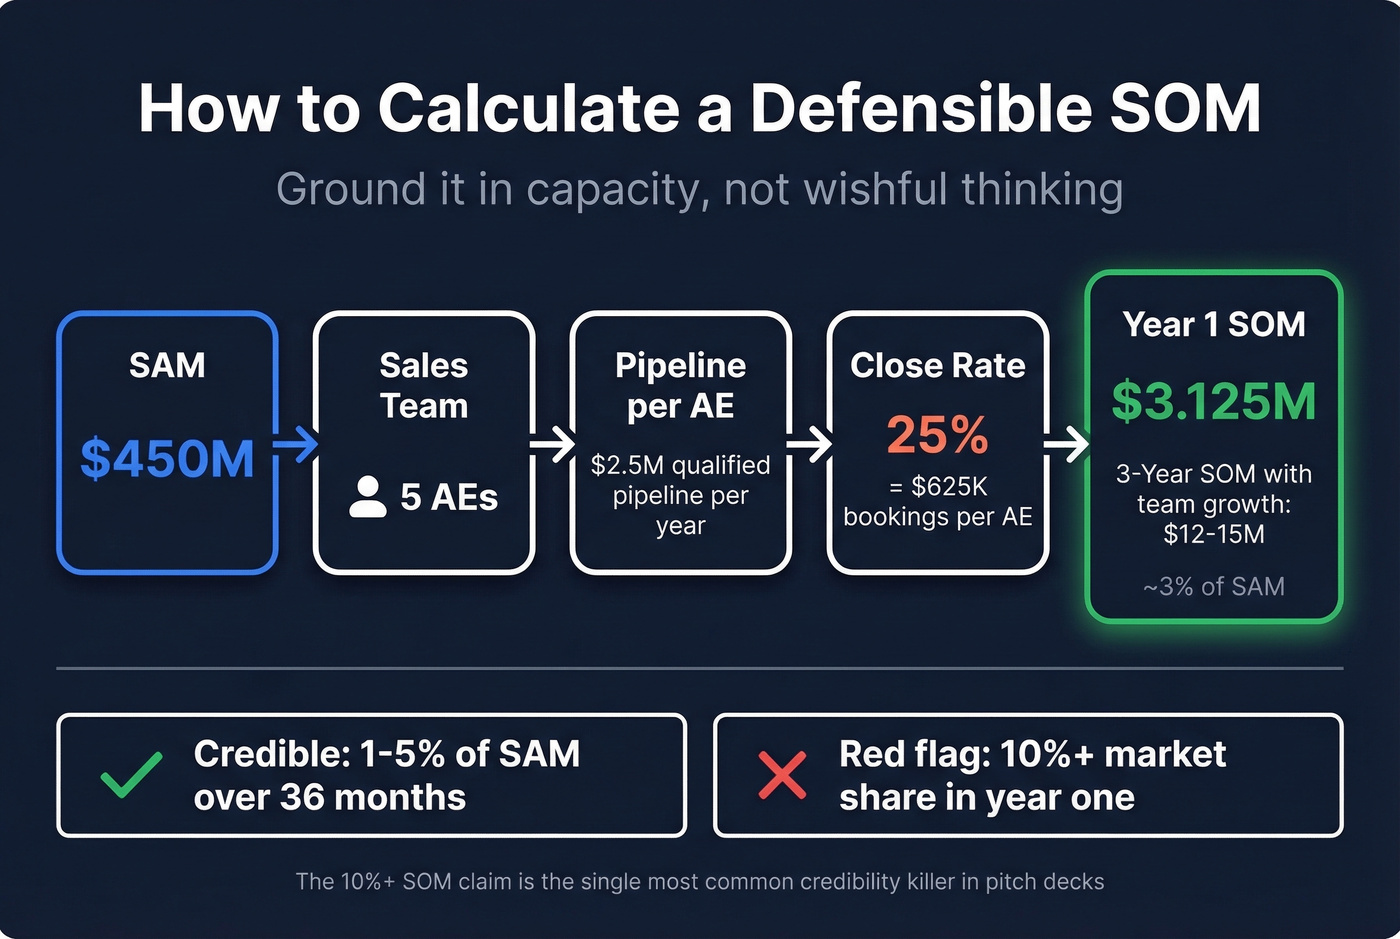
SOM should represent a 36-month horizon. For early-stage companies, 1-5% of SAM is the realistic range. Ground it in capacity, not wishful thinking.
Say your SAM is $450M. You have 5 AEs, each generating $2.5M in qualified pipeline annually, with a 25% close rate. That's $625K in bookings per AE, or $3.125M total in year one. Over three years with modest team growth, you hit $12-15M - roughly 3% of SAM. That's a defensible SOM. (To sanity-check your assumptions, compare against sales pipeline benchmarks and your own historical conversion rates.)
Let's be honest: claiming 10%+ market share in year one isn't ambitious. It's a red flag. We've reviewed a lot of pitch decks, and the 10%+ SOM claim is the single most common credibility killer. It signals you haven't thought about sales capacity, competitive dynamics, or the reality that enterprise deals often take months to close.
Free Data Sources for Market Sizing
Skip the Gartner report. Census + BLS data gets you most of the way there for free - and investors respect the hustle.
| Source | What It Gives You | Best For |
|---|---|---|
| US Census Bureau | Business counts by industry, size, state | Broad company counts |
| Bureau of Labor Statistics | Job role counts by industry | User-based TAM |
| County Business Patterns | Establishments by geography + NAICS | Geo-filtered SAM |
| SEC Filings (EDGAR) | Public company financials | Comp analysis |
| UN Data | Global population, trade, production | International TAM |
| ITC Trade Map | Export/import by product + country | Cross-border markets |
For B2B SaaS, the combination of Census data for company counts and BLS data for job title counts covers most bottom-up estimation needs. NAICS codes are your best friend - they let you slice industries precisely enough to defend your numbers in a pitch.
From Market Size to Prospect List
You've sized your SAM at $150M. Now what?
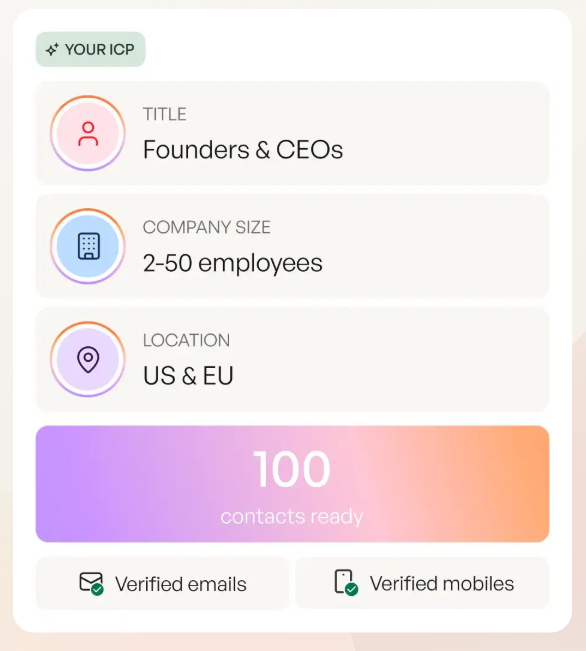
The gap between "I know my market is big enough" and "I have a list of companies to call" is where most market-sizing exercises die. Your analysis identified the characteristics of your ideal customer - industry, headcount, geography, tech stack. The next step is turning those filters into actual companies and contacts you can reach this week.
Prospeo's database covers 300M+ professional profiles with 30+ search filters, including buyer intent across 15,000 topics. Take the exact ICP criteria from your bottom-up calculation, plug them in, and get a verified prospect list with 98% email accuracy. It turns a spreadsheet estimate into something your sales team can work. (If you're building outbound from scratch, start with these sales prospecting techniques.)
Your SOM is only as good as your ability to reach buyers. Prospeo gives you 98% accurate emails and 125M+ verified mobiles for the exact ICP segments in your SAM - filtered by job title, company size, intent signals, and geography. Turn market sizing into pipeline.
Know your SOM. Now go capture it at $0.01 per verified email.
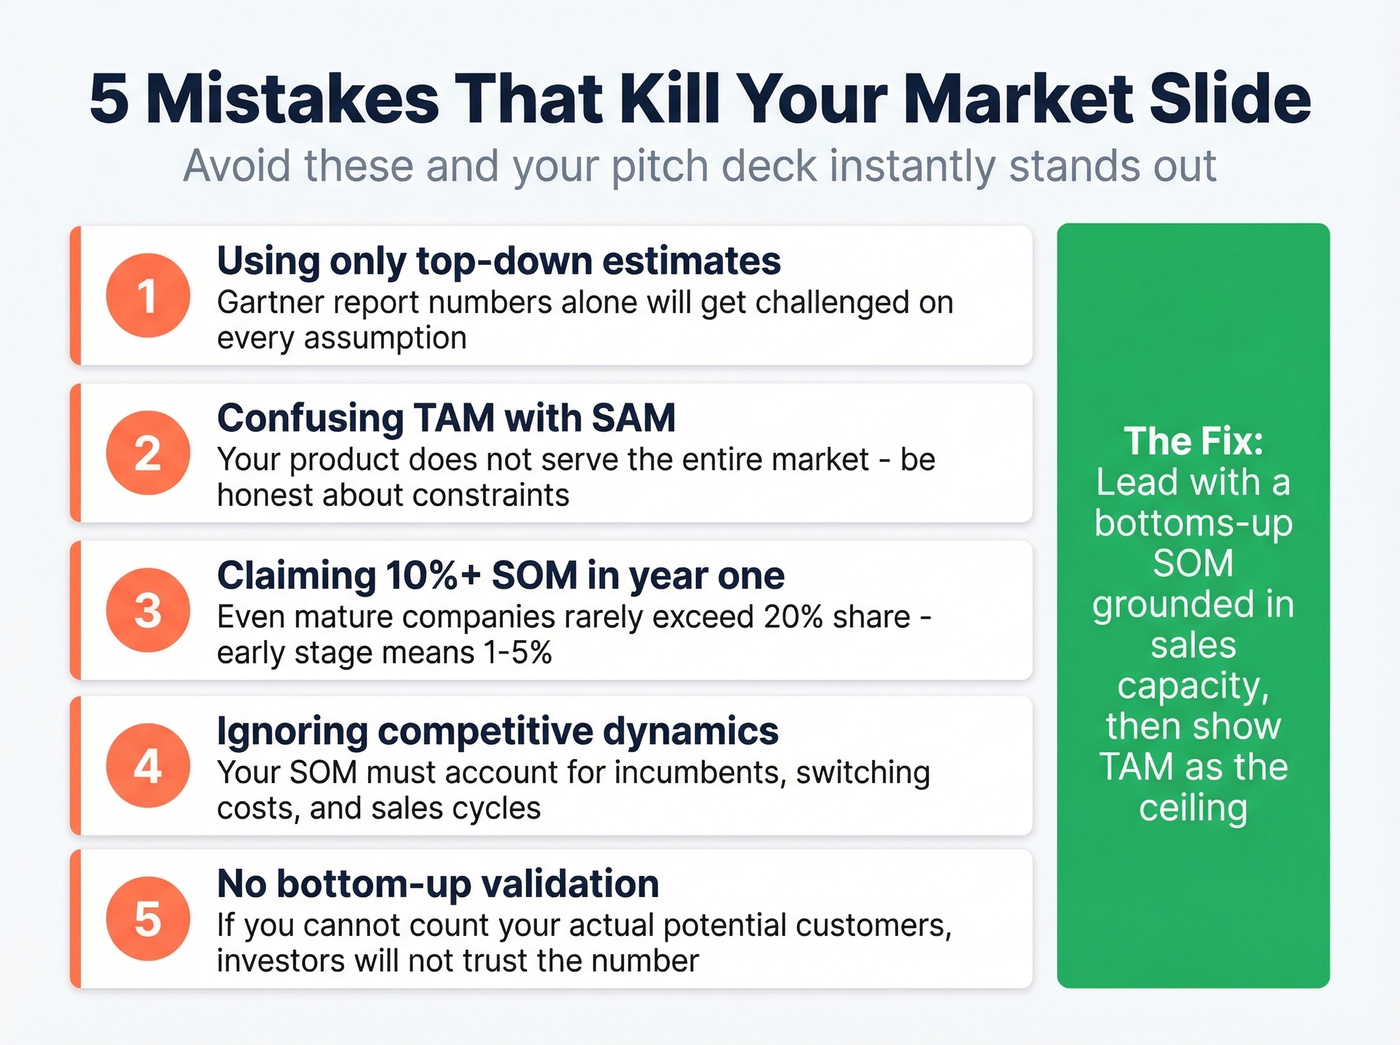
Five Mistakes That Kill Your Market Slide
1. Using only top-down estimates. An "AI-driven CRM" startup that sizes TAM from a Gartner report alone will get challenged on every filter assumption. Without bottom-up validation, the number feels made up.
2. Treating TAM as static. Markets expand. If your market slide shows the same TAM in year one and year five, you're telling investors you have no expansion strategy.
3. Overstating SOM. Claiming 20% market share when mature companies rarely hit that ceiling is the fastest way to lose credibility. Ground SOM in sales capacity, not ambition. (If you need a tighter model, build it from your sales conversion rate and pipeline math.)
4. No bottom-up validation. Top-down gives you a story. Bottom-up gives you proof. Always have the company count ready when an investor asks how many businesses actually match your ICP.
5. Ignoring how TAM constrains fundraising. A $50M TAM doesn't just limit your business - it limits your ability to fund the business. Small SOM caps plausible revenue, which caps exit value, which caps how much you can raise.
FAQ
What's a good TAM for VC?
$1B+ is the standard threshold for venture-scale returns. A $200M TAM requires 25% capture just to hit $50M ARR - and almost no company achieves that. Angel and seed investors accept smaller markets, but Series A and beyond generally won't.
What's the difference between SAM and TAM?
TAM represents total revenue if you had zero constraints; SAM filters that through real-world limits like geography, product capabilities, and channel reach. Think of TAM as the theoretical maximum and SAM as the practical maximum your business model can serve today.
What timeframe should SOM cover?
Thirty-six months - what you'll realistically capture given your current team, channels, and go-to-market capacity. Anchor it to headcount, quota attainment, and conversion rates rather than market share percentages. For early-stage companies, 1-5% of SAM is the defensible range.
Do I need market sizing at pre-seed?
Yes, but keep it simple. A defensible bottom-up estimate with clear ICP criteria beats a polished top-down guess every time. Even a napkin-math version shows investors you understand the opportunity's scale and have thought critically about who you're selling to.
How do I validate my company count for bottom-up TAM?
Start with Census Bureau, BLS, and County Business Patterns for broad counts by industry, geography, and size. Then cross-check with a B2B database - filter by headcount, tech stack, and funding stage. If government data says 45,000 companies and your filtered search returns 40,000, your estimate holds up under scrutiny.