Unique Open Rate: Definition, Formula, Benchmarks & Why It's Broken
You're staring at your campaign dashboard and it says 65% unique open rate. You feel great for about ten seconds - until you remember a big chunk of your list uses Apple Mail, and many of those "opens" are phantoms triggered by a proxy server before anyone read a word.
In 2026, this metric is noisy, inflated, and widely misunderstood. On r/emailmarketing, practitioners still ask "does opening multiple times increase the open rate?" - which tells you the metric isn't just unreliable, it's fundamentally confusing to the people relying on it.
The Short Version
- Unique open rate = unique opens / emails delivered x 100
- A "healthy" range in 2026 sits between 30-45%, depending on industry and list quality
- Apple Mail Privacy Protection often adds 30-60% phantom opens on consumer-heavy lists
- Track it for trend analysis and deliverability signals, not individual-level automation
- Pair it with click rate, CTOR, reply rate, and conversion rate for anything that actually matters
What Is Unique Open Rate?
This metric counts how many distinct recipients opened your email at least once, divided by the number of emails successfully delivered. It's the de-duplicated version of open tracking - the only version worth looking at.
Here's a quick example: you send an email to 500 people. Five of them open it twice each. Your unique opens are 5. Your total opens are 10. The rate is 5 / 500 x 100 = 1%. Total open rate would use 10 in the numerator, inflating the number and telling you nothing useful about reach.
Most ESPs - Klaviyo, Mailchimp, ActiveCampaign, HubSpot - report "open rate" using unique opens by default. If your platform still shows total opens as the headline metric, it belongs in 2015.
| Metric | What It Measures | Formula |
|---|---|---|
| Unique opens | Recipients who opened at least once | Count of distinct openers |
| Total opens | Every open event | All opens, including re-opens |
| Unique open rate | Reach among delivered | Unique opens / delivered x 100 |
| CTOR | Content engagement | Unique clicks / unique opens x 100 |
How to Calculate It
The formula is straightforward, but the denominator trips people up.
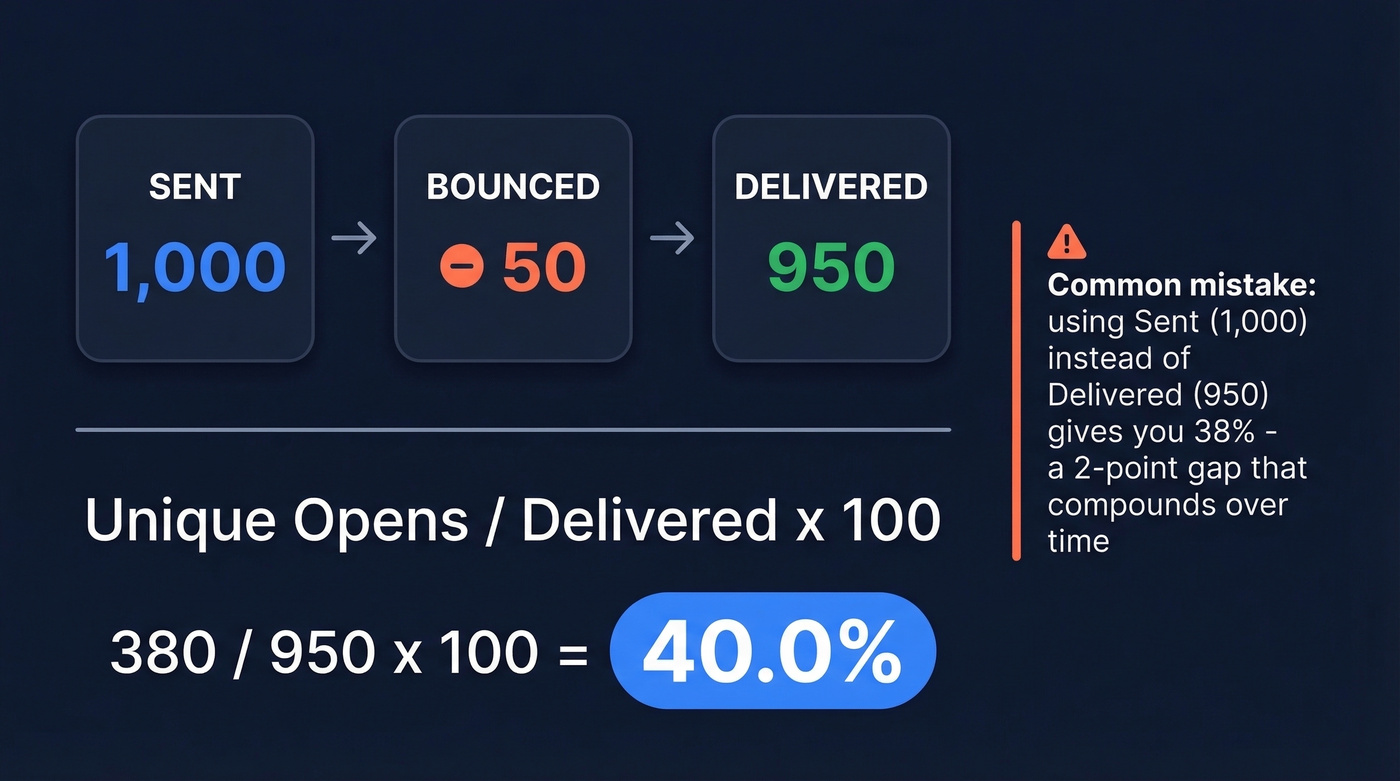
Unique open rate = (Unique opens / Delivered emails) x 100
"Delivered" means sent minus bounces. Bounces never reached an inbox, so they shouldn't be in the denominator.
Let's walk through a real example. You send 1,000 emails. 50 bounce. That leaves 950 delivered. 380 unique recipients open the email. The result is 380 / 950 x 100 = 40%. If you mistakenly used 1,000 as the denominator, you'd get 38% - a two-point gap that compounds across campaigns and distorts trend analysis over months.
How Open Tracking Actually Works
Every open you see in your dashboard traces back to a 1x1 invisible tracking pixel - a tiny image embedded in the HTML of your email. When a recipient's email client loads that image, it pings the sender's server. That server request is your "open."
This pixel used to capture the recipient's IP address, device type, email client, and timestamp. Imperfect but useful. Then privacy proxies arrived and broke most of that signal. Gmail routes image loads through Google Image Proxy, so opens appear to come from Google's servers with a generic user agent. Yahoo does the same. The pixel still fires, but the metadata it returns is increasingly meaningless.
If you're trying to diagnose inboxing issues, start with the fundamentals in our email deliverability guide.
Inflated open rates start with bad data. When 30-40% of your list bounces, every metric downstream is fiction. Prospeo's 5-step email verification delivers 98% accuracy - so the opens you do see come from real people, not phantom pixels on dead addresses.
Fix your open rate at the source: start with emails that actually deliver.
Why Your Numbers Are Wrong
Your open rate isn't just noisy - it's systematically inflated by at least three forces working simultaneously.
Apple Mail Privacy Protection
Apple Mail Privacy Protection (MPP), rolled out in 2021, pre-loads tracking pixels through proxy servers before the recipient ever sees the email. The pixel fires. Your ESP records an "open." Nobody read anything.
Here's the detail most people miss: this applies to anyone using the Apple Mail app, regardless of their email address. A Gmail address opened in Apple Mail on an iPhone? Still affected by MPP. For B2C lists with significant iOS adoption, a huge share of recorded opens can be phantoms.
In iOS 18, Apple also introduced inbox changes like categories and digest-style views that affect visibility before someone decides to open. And Apple's Link Tracking Protection in Mail and Safari can strip tracking parameters like UTMs, which makes attribution harder downstream.
ESPs prominently displaying open rate as the hero metric - knowing it can be heavily inflated by MPP - is borderline irresponsible.
Gmail & Yahoo Proxies
Even outside Apple's ecosystem, Gmail and Yahoo route image loads through their own proxy servers. Opens appear to come from Google or Yahoo infrastructure, not from the actual recipient. The user agent becomes generic. Location and device data degrade to near-useless. The pixel still fires, so the open "counts," but the contextual data that made opens analytically interesting is gone.
Bots & Security Prefetching
In B2B environments, corporate firewalls and email security tools like Barracuda, Mimecast, and Proofpoint routinely pre-fetch email content to scan for threats. Every prefetch triggers the tracking pixel.
One SendGrid user on Reddit reported open rates 4x their benchmark and couldn't figure out why - bots were the culprit. For lists targeting enterprise companies with aggressive security stacks, bot opens can add double-digit inflation. Most ESPs don't cleanly separate bot opens from human ones, which means you're flying blind.
If you're seeing weird spikes, it can also help to monitor your email bounce rate alongside opens.
2026 Benchmarks by Industry
Two large benchmark studies give us a usable range.
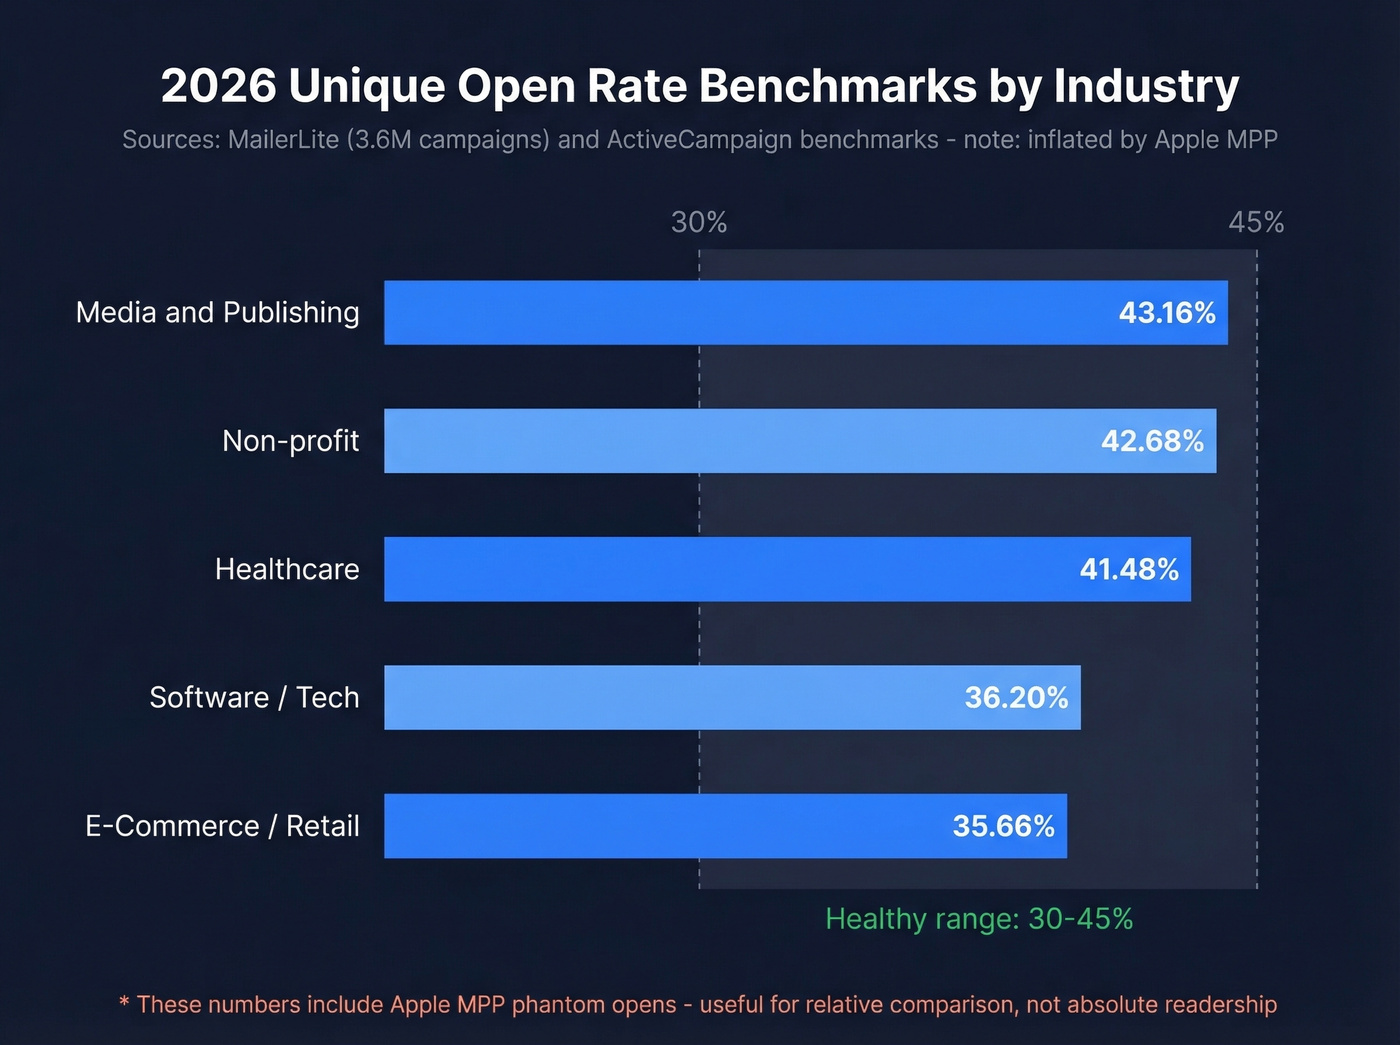
MailerLite's 2025 benchmark report analyzed 3.6M campaigns across 181,000 accounts and found a median open rate of 43.46%, with a 2.09% click rate and 6.81% CTOR. ActiveCampaign's benchmarks show an average open rate of 39.26%, and they call 30-40% a solid baseline.
In most ESP reporting, "open rate" is calculated as unique opens / delivered, so these benchmarks are the practical baseline for comparison. For more context, compare against a broader standard email open rate breakdown.
| Industry | Open Rate |
|---|---|
| Media & Publishing | 43.16% |
| Non-profit | 42.68% |
| Healthcare | 41.48% |
| Software/Tech | 36.20% |
| E-Commerce/Retail | 35.66% |
A healthy range in 2026 falls between 30-45%, depending on your industry, list age, and audience device mix.
These benchmarks are inflated by Apple MPP - MailerLite acknowledges this directly. But since everyone's affected, they're still useful for relative comparison. Your 38% vs. the industry's 36% is a meaningful signal. Your 38% as an absolute measure of readership is not.
Should You Still Track It?
Here's the thing: unique open rate is a broken speedometer. It still tells you if you're accelerating or decelerating, but the actual number on the dial is fiction.
Track it for trend analysis over time, deliverability monitoring, and subject line A/B testing at aggregate level. A sustained 10-point drop across multiple campaigns is a strong deliverability warning sign, regardless of MPP noise.
Don't use it for individual-level automation. Routing someone into a "not engaged" sequence because they didn't "open" is dangerous when MPP falsely reports opens and pixel blockers falsely report non-opens. You end up punishing engaged subscribers and rewarding ghosts.
One Reddit marketer ran a test where the variant with below-average opens had a 10% click rate and 8% form submission rate. Opens picked the wrong winner. Click rate, reply rate, and conversion rate told the real story.
If you're making automation decisions based on individual-level "opened vs. didn't open," you're routing people into the wrong sequences. Full stop. If you need a better north star, use funnel metrics that tie to revenue.
How to Improve Open Rates
Most "15 tips to improve open rate" guides are noise. Only three things meaningfully move the needle, and we've seen this play out across hundreds of campaigns our team has analyzed.
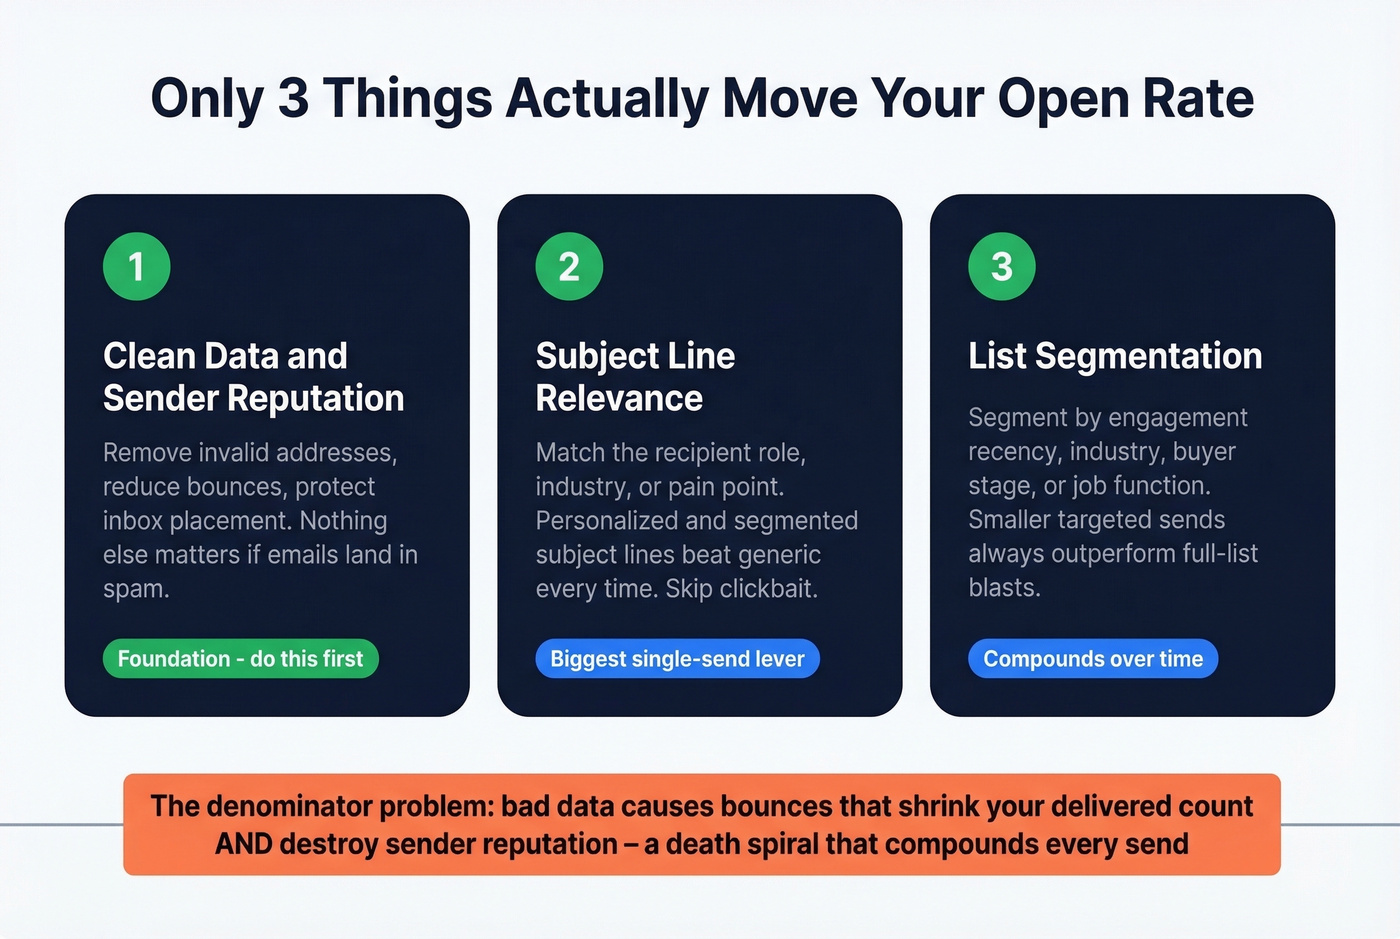
Sender Reputation Through Clean Data
If your list is full of invalid addresses, bounces shrink your delivered count (distorting the rate) and damage your sender reputation (pushing future emails to spam). Nothing else matters if your emails don't reach the inbox. We've watched teams obsess over subject line emojis while sending to lists with 15% invalid addresses - that's optimizing the paint job on a car with no engine.
If you want a practical playbook, see how to improve sender reputation without guessing.
Subject Line Relevance
Not "hacks" or emoji tricks. Relevance to the recipient's role, industry, or pain point. Personalized subject lines consistently outperform generic ones, and segmented campaigns beat unsegmented sends on open rate almost every time. Skip the clickbait - it might inflate opens once, but it craters trust and tanks long-term engagement.
If you're stuck, borrow patterns from these email subject line examples.
List Segmentation
Sending the same email to your entire list guarantees mediocre results. Segment by engagement recency, industry, buyer stage, or job function. Smaller, targeted sends outperform blasts every time. If you aren't segmenting, you're averaging your best and worst performers into one disappointing number.
For a more systematic approach, use intent based segmentation to align messaging with buying signals.
The Denominator Problem
Bad email data doesn't just cause bounces - it corrupts the math. Every bounced email shrinks your denominator, artificially inflating your rate. Worse, high bounce rates destroy sender reputation, which means future emails land in spam and your open rate craters over time. It's a death spiral that compounds with every send.
Prospeo runs a 5-step verification process with catch-all domain handling, spam-trap removal, and honeypot filtering - delivering 98% email accuracy. Upload a CSV, get results in minutes, and send knowing your denominator is honest and your sender reputation is protected. The free tier covers 75 verifications per month, so there's no reason to skip this step. If you need remediation guidance, start with spam trap removal.

You just read that bot prefetching and bounces wreck your unique open rate. The fix isn't better tracking - it's cleaner data. Prospeo refreshes 300M+ profiles every 7 days and removes spam traps, honeypots, and catch-all dead ends before you ever hit send.
Stop analyzing noise. Send to verified contacts at $0.01 per email.
FAQ
Does re-opening an email change unique open rate?
No. Unique open rate counts each recipient exactly once, regardless of how many times they open. Re-opens increase your total open count but have zero effect on unique opens. A big gap between total and unique opens usually means a small group of engaged readers keeps returning to your content - which is actually a good signal about content quality.
Can you track opens on plain-text emails?
No. Open tracking depends on a 1x1 tracking pixel embedded as an image in the email's HTML. Plain-text emails don't load images, so the pixel never fires. If you need open tracking, you need HTML emails - no workaround exists.
How do bounces affect unique open rate?
Bounces reduce your "delivered" count - the denominator in the formula. A high bounce rate from bad email data artificially inflates your percentage, because fewer delivered emails means the same number of opens produces a higher rate. Verifying your list before sending keeps the denominator honest and protects sender reputation from bounce-related damage.
What's a good unique open rate in 2026?
For most industries, 30-45% is the healthy range based on MailerLite and ActiveCampaign benchmark data. Software and tech averages around 36%, while media and non-profits trend above 42%. These numbers are inflated by Apple MPP - use them for relative comparison against your vertical, not as absolute readership measures.