What's a Good Funnel Conversion Rate? (It Depends on 5 Things)
Your VP of Sales just asked why only 4% of leads become customers. Is that a crisis or business as usual?
Here's the short answer: B2B funnels typically convert 3-7% end-to-end. eCommerce sits around 2.79% globally. Ruler Analytics pegged the average across 14 industries at 2.9% from 100M+ data points - with form fills accounting for 1.7% and phone calls for 1.2%. But that single number is meaningless without knowing your traffic source, device split, industry, company size, and intent type. We've found that teams who segment by these five variables usually discover their "bad" rate is perfectly normal for their traffic mix.
What Is a Funnel Conversion Rate?
It's the percentage of people who enter your funnel and complete the desired action at the other end:
Conversions / Total Entries x 100 = Funnel Conversion Rate
The distinction that matters: overall funnel rate (visitor to closed deal) versus stage-to-stage rate (like MQL to SQL). Overall rates look terrible because they compress every drop-off into one number. Stage-to-stage rates tell you where the problem actually lives.
When someone asks about the average sales funnel conversion rate, they're usually thinking about that end-to-end number. It only becomes useful once you break it apart.
Stage-by-Stage Benchmarks
First Page Sage's 2017-2025 dataset covering 65% B2B and 20% B2C clients breaks conversion by stage and industry:
| Industry | Lead to MQL | MQL to SQL | SQL to Opp | Opp to Closed |
|---|---|---|---|---|
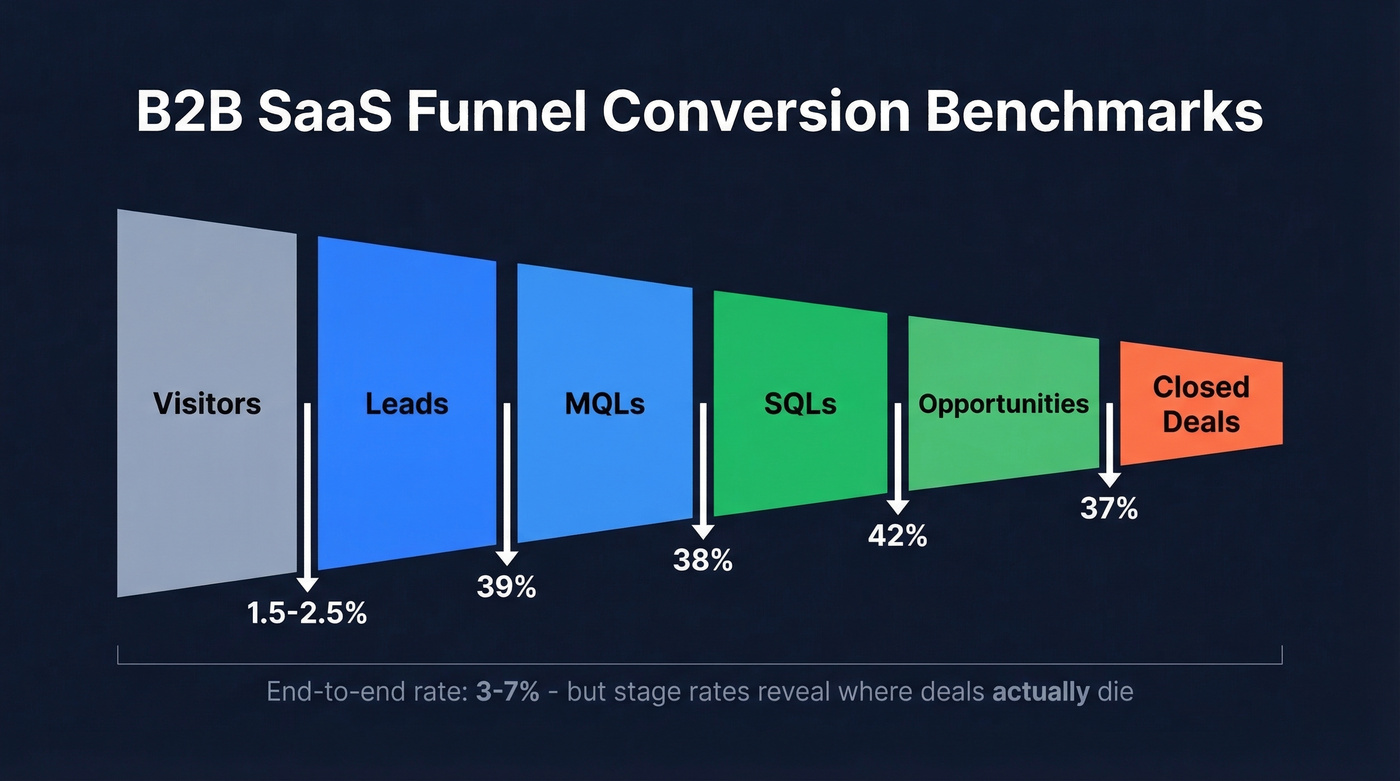
| B2B SaaS | 39% | 38% | 42% | 37% |
| eCommerce | 23% | 58% | 66% | 60% |
| Financial Svcs | 29% | 38% | 49% | 53% |
| Higher Ed | 45% | 46% | 61% | 66% |
These stage rates look high because the visitor-to-lead conversion happens earlier and is notably lower. For B2B SaaS specifically, visitor-to-lead averages 1.5-2.5%, and strong performers hit 3-5%.
Stop obsessing over your overall rate. It's a vanity metric. Stage-to-stage rate is the real diagnostic.
Stage-to-stage benchmarks only matter if you're measuring real prospects. When 20-35% of your emails bounce, every conversion rate downstream is a lie. Prospeo's 98% email accuracy and 7-day data refresh cycle ensure your funnel metrics reflect actual buyer behavior - not stale records.
Stop diagnosing a funnel built on bad data. Clean it first.
Five Variables That Shift Your Rate
Traffic Source
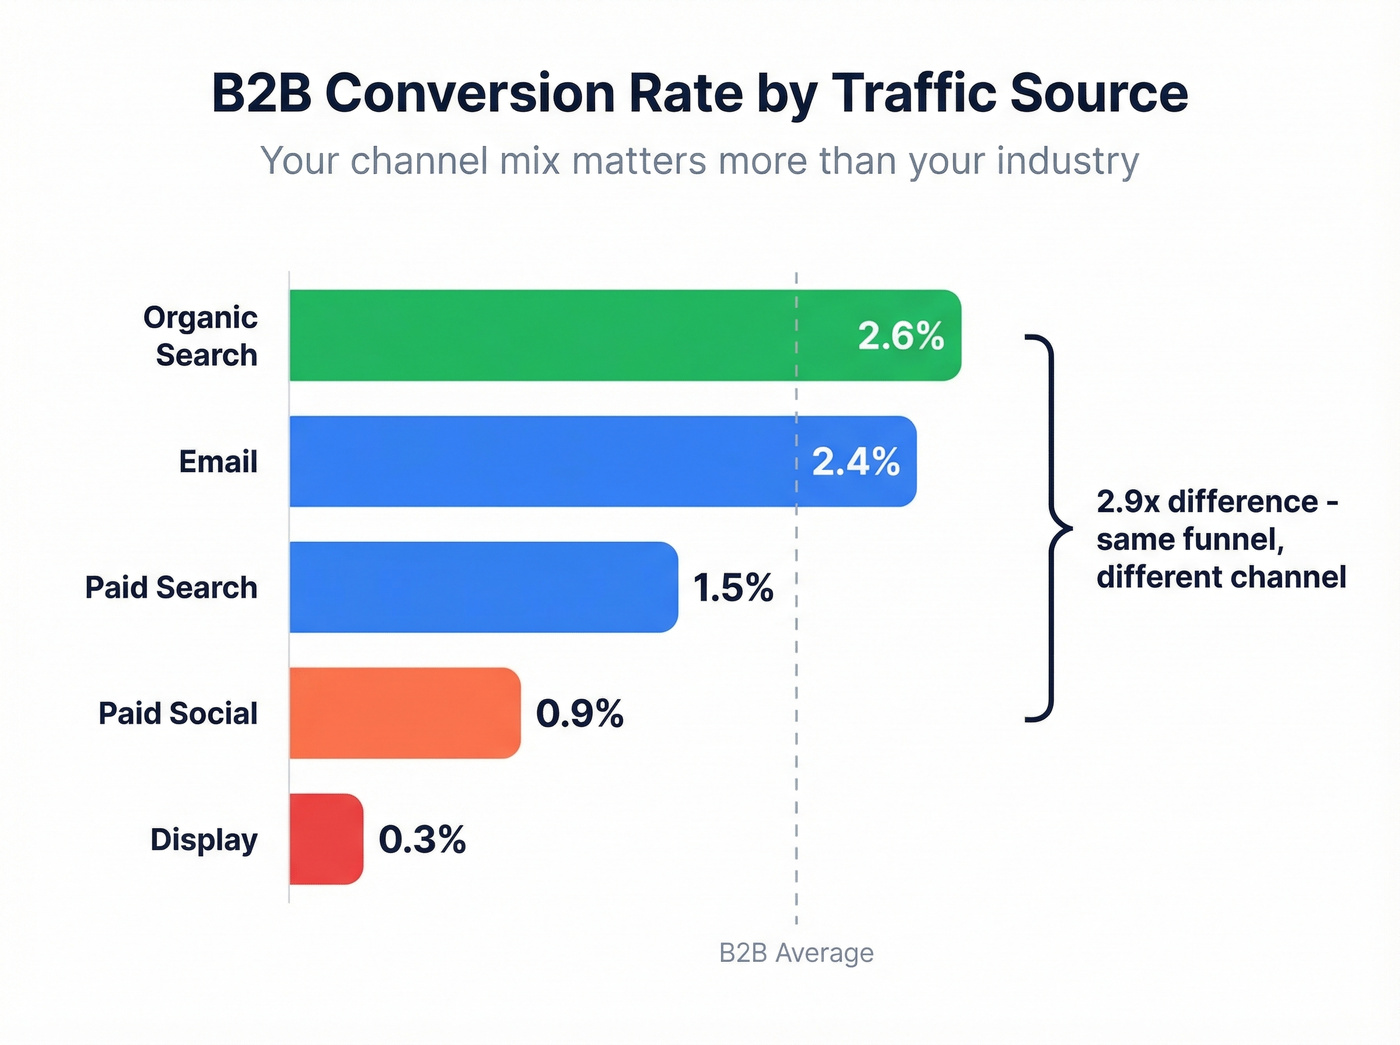
Your channel mix matters more than your industry. The gap between organic search and paid social dwarfs most industry differences.
| Channel | B2B | B2C |
|---|---|---|
| Organic Search | 2.6% | 2.1% |
| 2.4% | 2.8% | |
| Paid Search | 1.5% | 1.2% |
| Paid Social | 0.9% | 2.1% |
| Display | 0.3% | 0.7% |
Look at that: organic search at 2.6% versus paid social at 0.9% for B2B - nearly a 3x difference from the same funnel. For SaaS specifically, organic search converts at 1.9% versus paid social at 0.7% across 41 SaaS companies tracked by First Page Sage. If your conversion rate tanked last quarter, check whether your traffic mix shifted before blaming your landing pages.
If you need a clean way to track this, start with consistent funnel metrics and a simple B2B sales funnel template so every channel is measured the same way.
Device
Desktop conversion rates run 52% higher than mobile, per Microsoft Advertising. The gap varies by measurement approach - Dynamic Yield's eCommerce dataset shows desktop and mobile nearly converging, while Shopify benchmarks put desktop at 3.5-3.9% versus 1.5-2.9% on mobile. Mobile drives roughly 75% of eCommerce traffic but only about 57% of revenue.
If your funnel benchmarks don't segment by device, they're lying to you.
Industry
Even within eCommerce, the spread is enormous. Dynamic Yield's dataset shows Food & Beverage converting at 6% while Luxury & Jewelry sits at 0.9%. Rates also spike in November around Black Friday, so always compare like months or use annual averages.
For a broader view of what “normal” looks like, compare against an average B2B lead conversion rate and your overall sales conversion rate.
Company Size
Enterprise funnels and SMB funnels behave differently at every stage. For B2B organic search, SMEs convert at 3.6%, small businesses at 2.5%, and enterprise at just 1.6%.
The flip side? Enterprise close rates average around 31% while SMBs hit roughly 39%. Longer sales cycles compress top-of-funnel rates but don't necessarily kill revenue - they just redistribute where the conversion happens.
If you're selling upmarket, it helps to align your stages with how enterprise B2B sales actually runs.
Branded vs. Non-Branded Traffic
This is the variable most teams ignore entirely. Branded search converts 3-5x higher than non-branded. Branded keywords land at 15-25%, competitor comparison terms at 8-12%, and broad discovery queries at 2-4%.
If your competitor just ran a Super Bowl ad and you didn't, your "declining conversion rate" might just be a shift in search intent mix. Not a funnel problem. A brand awareness problem.
If you want to operationalize this, build an intent based segmentation model and keep your lead scoring rules consistent across channels.

Revenue Impact of Stage Fixes
Small stage improvements compound through every downstream stage. A Kluster analysis showed improving one stage from 57% to 62% generated roughly £50K in additional revenue.
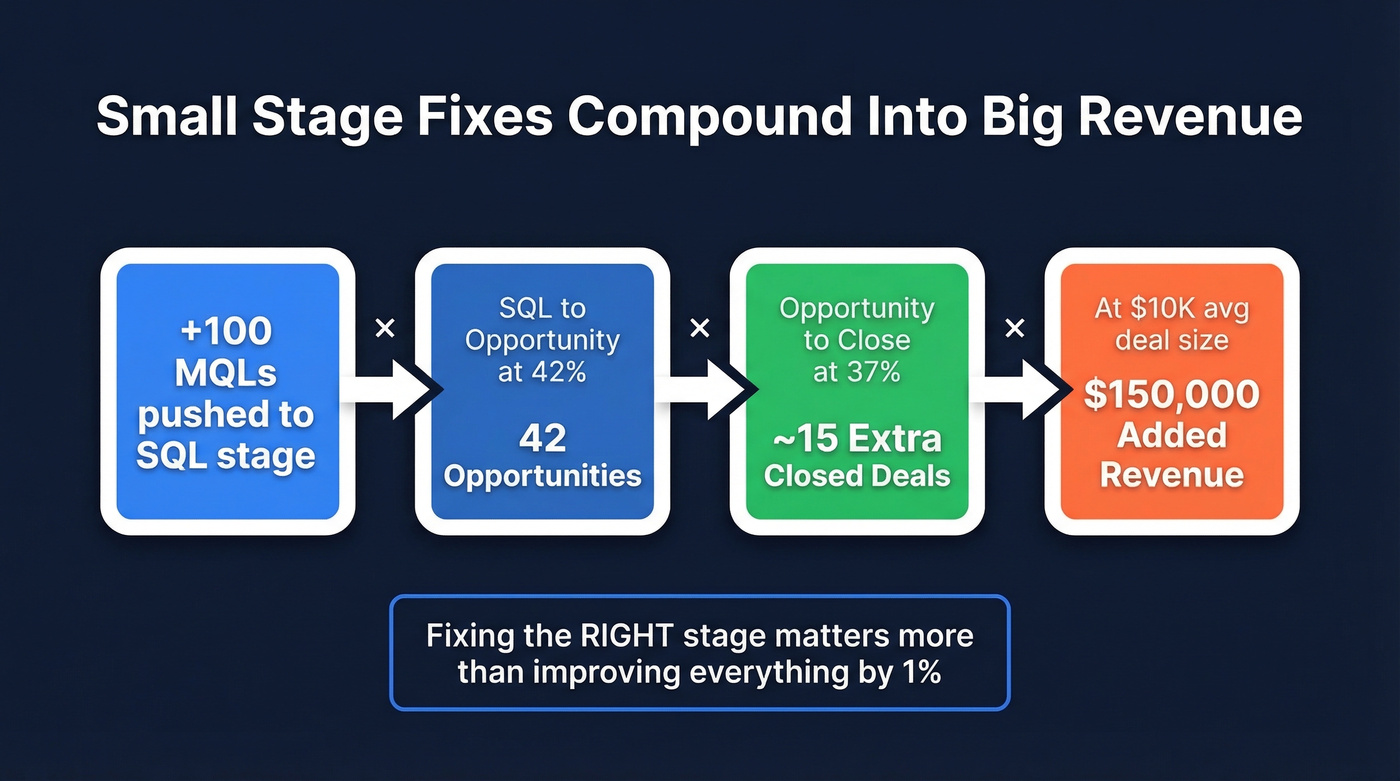
Let's do the math on a concrete example. Push 100 more leads from MQL to SQL, and your SQL-to-Opp rate is 42%, and your Opp-to-Close rate is 37% - that's 100 x 0.42 x 0.37 = roughly 15 extra closed deals. Multiply by your average deal size. Fixing the right stage matters more than improving everything by 1%.
How to Improve Your Rate
Diagnose the bottleneck first. Compare each stage-to-stage rate against the benchmarks above. The stage furthest below its benchmark is where you start. Don't spray optimizations everywhere - we've seen teams run five simultaneous A/B tests and learn nothing. Isolate one variable, measure the stage, move on.
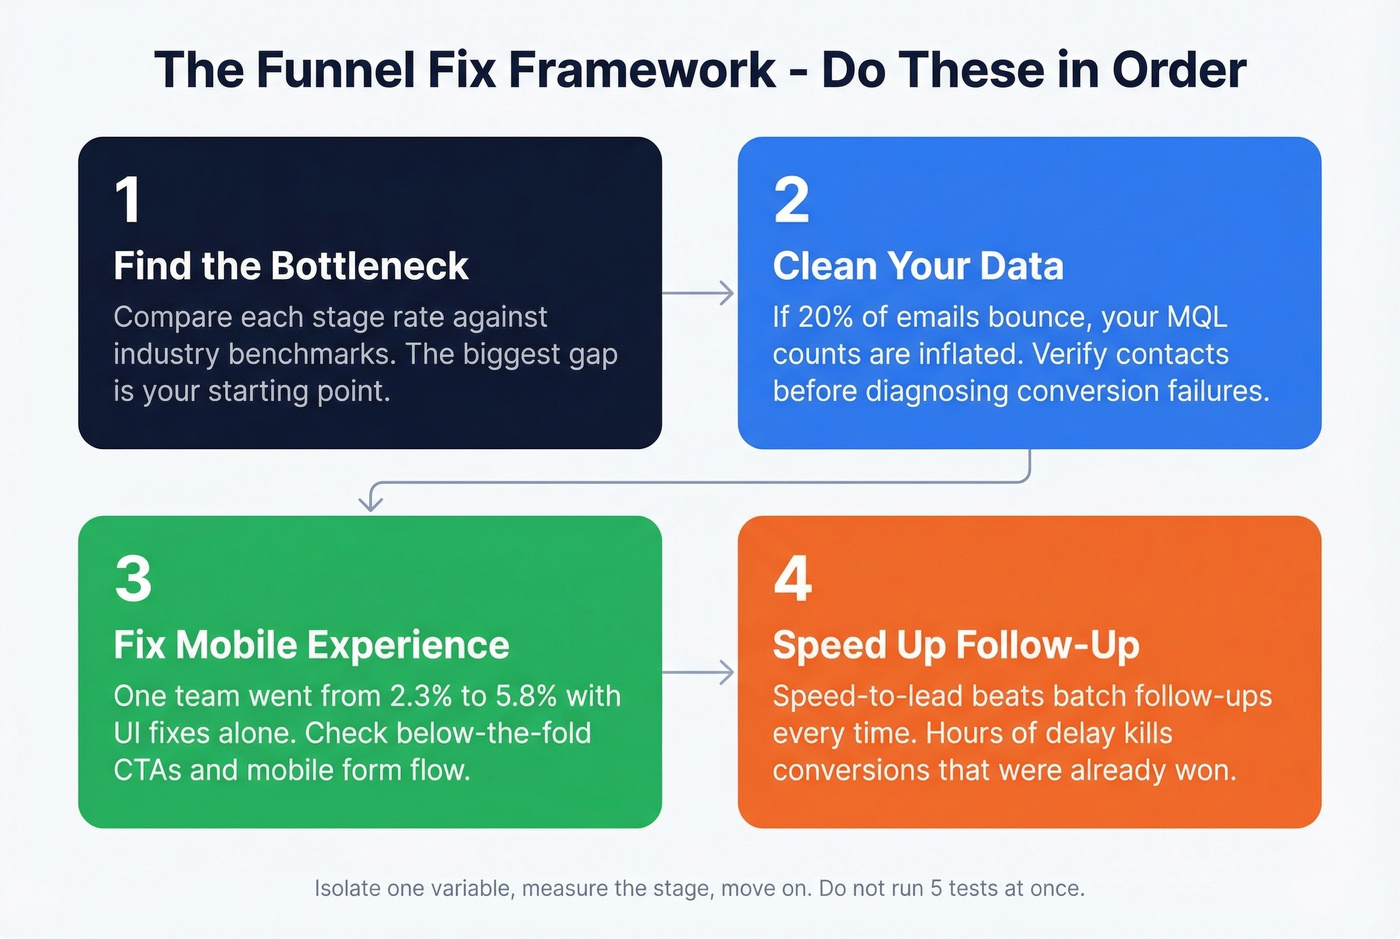
Fix mobile experience. One practitioner on r/b2bmarketing went from 2.3% to 5.8% after fixing below-the-fold CTAs, adding urgency signals, and cleaning up mobile flow. A 2.5x improvement from UI changes alone.
Follow up fast. Speed-to-lead beats batch follow-ups every time. If your SDRs wait hours to respond, you're leaving conversions on the table. This isn't a hot take - it's been validated by every lead response study published in the last decade. If you need a starting point, use proven sales follow-up templates and standardize your sequence management.
Clean your data. Here's the thing: if 20% of your emails bounce, your Lead-to-MQL rate is artificially deflated. You're measuring ghosts, not conversion failures. Prospeo's 98% email accuracy and 7-day data refresh cycle help ensure your funnel metrics reflect actual performance rather than stale contact records. The free tier gives you 75 verified emails per month to start cleaning things up.
Skip the "optimize everything at once" playbook. Find the one stage that's bleeding, fix it, then move to the next.
Improving MQL-to-SQL by 5 points can mean 15+ extra closed deals per quarter. But that math only works when your leads are real people at real companies with verified contact info. Prospeo gives you 300M+ profiles with 98% email accuracy at $0.01/lead - so every stage conversion reflects genuine pipeline.
Feed your funnel verified leads and watch every stage rate climb.
FAQ
What's a good B2B funnel conversion rate?
Most B2B funnels convert 3-7% end-to-end. For SaaS, visitor-to-lead averages 1.5-2.5%, while SQL-to-Opportunity averages 40-48%. The stage furthest below its industry benchmark is where you should focus first.
What's a good eCommerce conversion rate?
The global average is 2.79%, ranging from 0.9% (luxury) to 6% (food & beverage). Desktop converts roughly 1.7x better than mobile. Always segment by product category and device before comparing against benchmarks.
How do I know which funnel stage to fix first?
Map each stage's conversion rate against its industry benchmark - the stage with the largest gap is your bottleneck. Fix that first, and verify your contact data isn't creating phantom leads that deflate rates artificially. Invalid emails pollute your MQL counts and make healthy funnels look broken.