What Is a Good Win Rate in Sales? (And Why Every Benchmark Gives You a Different Number)
A sales rep we know hit a 22-28% win rate at one company, then moved to a new org and watched it crater to 4%. Same skills, same effort, completely different denominator. Every sales blog gives you a different "average" - 21%, 29%, 47%, 60%+ - and none explain why. That's because understanding what a good win rate actually looks like requires knowing exactly what's being measured, and most benchmarks don't disclose that.
The Short Answer
A good win rate in sales is usually 20-30% when you measure from the full pipeline, but it can look like ~47% if you measure from proposal or quote stage.
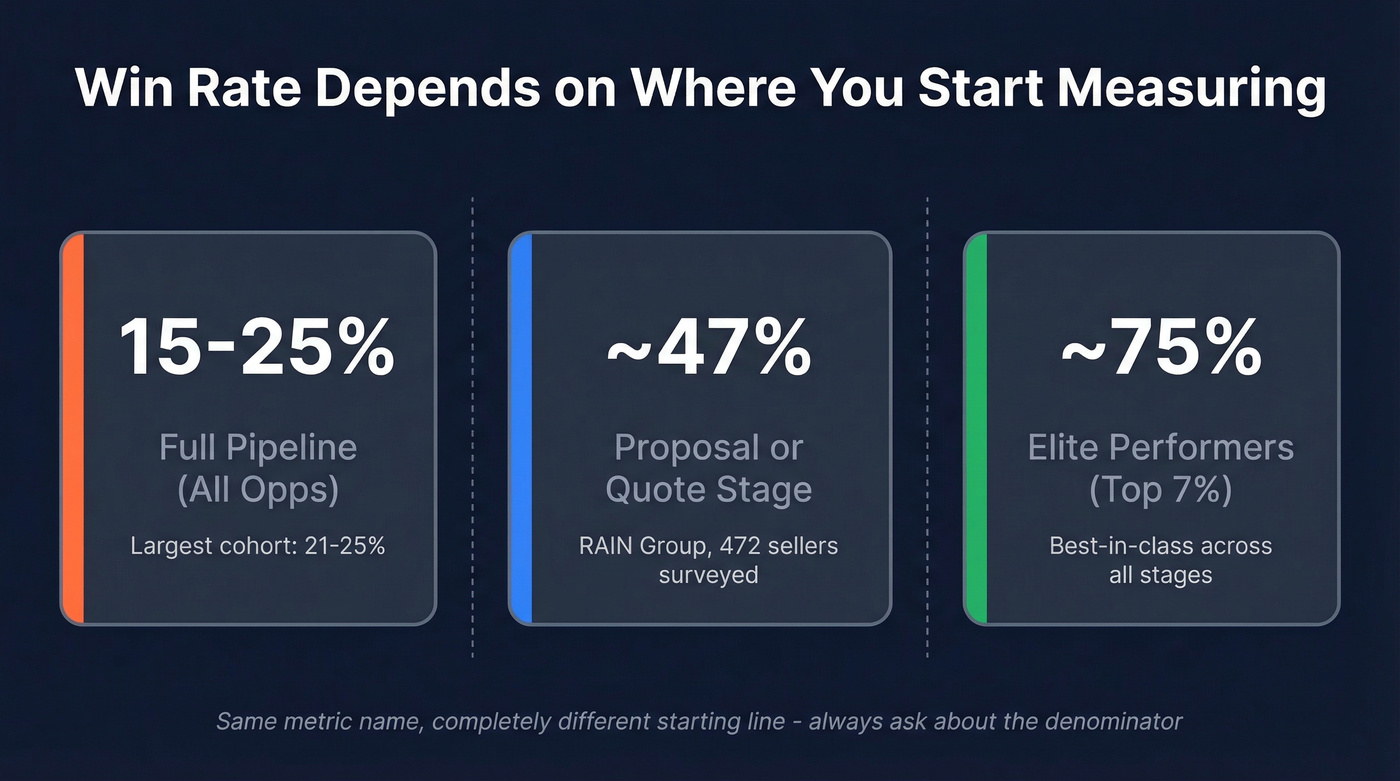
Teams measuring from proposal stage average ~47%. Teams measuring from all pipeline opportunities typically land in the 15-25% range, with a big cohort clustered around 21-25%. Neither is wrong. They're measuring different things.
| Measurement Stage | Typical Win Rate |
|---|---|
| Proposal/quote stage | ~47% (often 40-50%) |
| Full pipeline (all opps) | 15-25% |
| Elite performers (top 7%) | ~75% |
Why Every Benchmark Disagrees
The confusion comes down to three things.
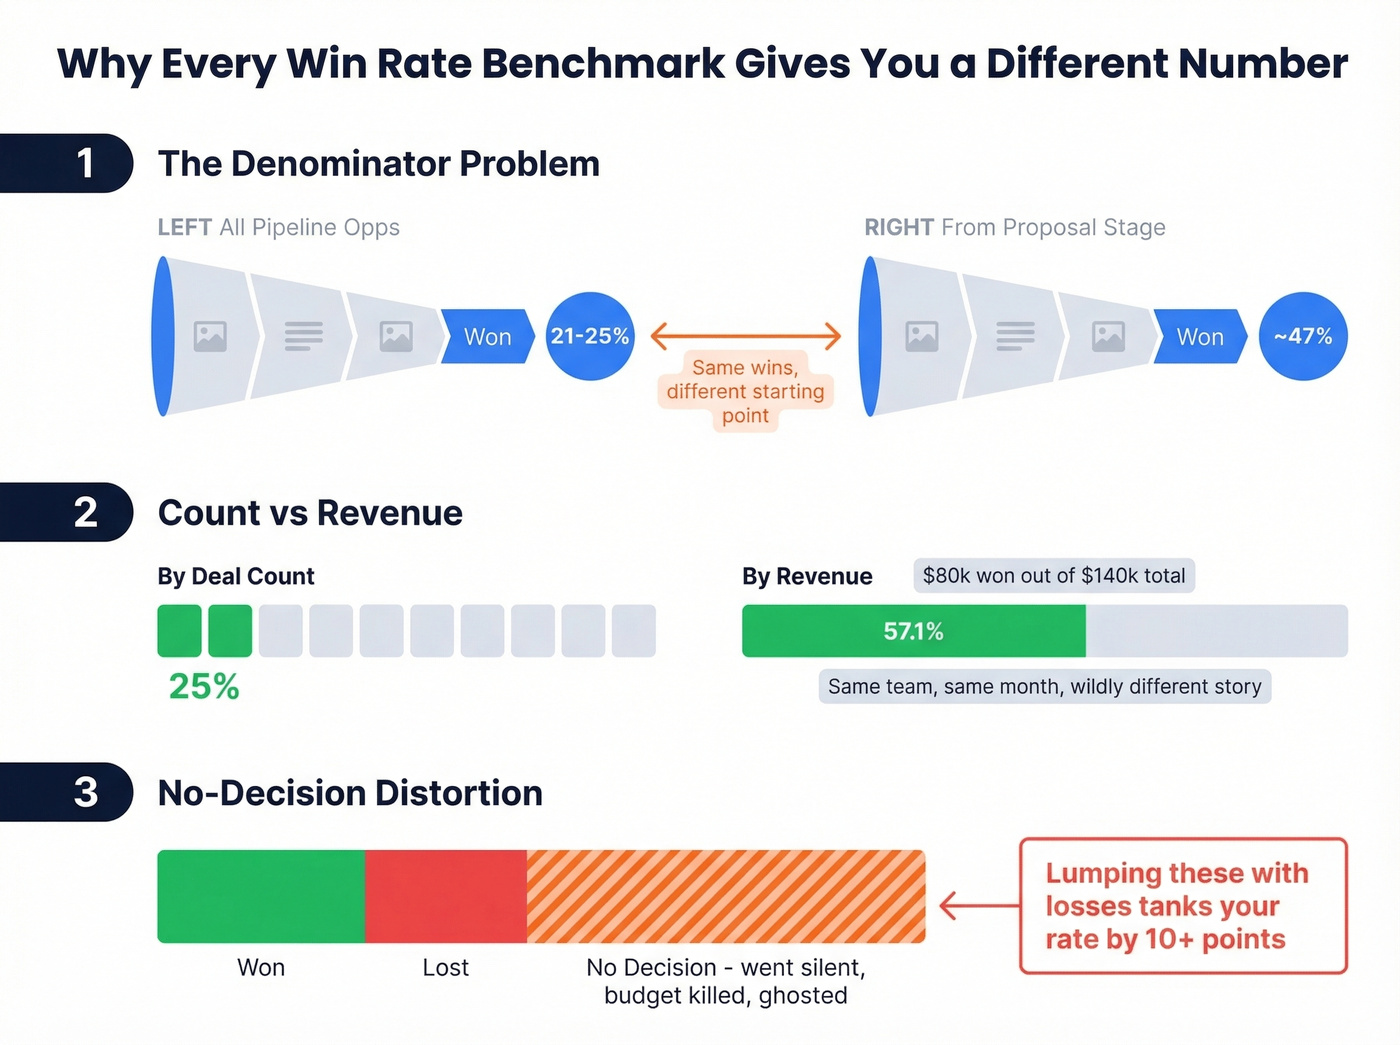
The denominator problem. RAIN Group's 47% average comes from a survey of 472 sellers measuring wins against proposals sent. Outreach's data shows the largest cohort landing in the 21-25% bracket - but they're measuring from all pipeline opportunities. Same metric name, completely different starting line. The r/sales subreddit calls this out constantly: nobody discloses their denominator, which is why win rate benchmarks vary so wildly across sources.
Count vs. revenue. Clozd breaks this down well: in the same month, a team can show a 25% win rate by deal count but 57.1% by revenue. If you're closing fewer deals but landing the big ones, your count-based rate looks terrible while your revenue-based rate looks great. Track both.
No-decision distortion. In complex B2B sales, a huge chunk of deals end in "no decision" - the prospect goes silent, punts the budget, or just stops responding. If you lump those with losses, your win rate tanks. The fix: track no-decision outcomes separately in your CRM and analyze where in the funnel deals stall. A healthy pipeline shows declining no-decision rates as stages progress. Gartner's research on B2B buying complexity confirms that buying group dysfunction - not seller failure - drives most no-decisions.
The article is clear: deals with verified contacts win at 37% vs 19% for cold outreach. That gap starts with data quality. Prospeo delivers 98% email accuracy on 300M+ profiles, refreshed every 7 days - so every opportunity in your pipeline is a real person you can actually reach.
Stop inflating your pipeline with contacts that bounce. Start reaching real buyers.
Win Rate Benchmarks by Segment
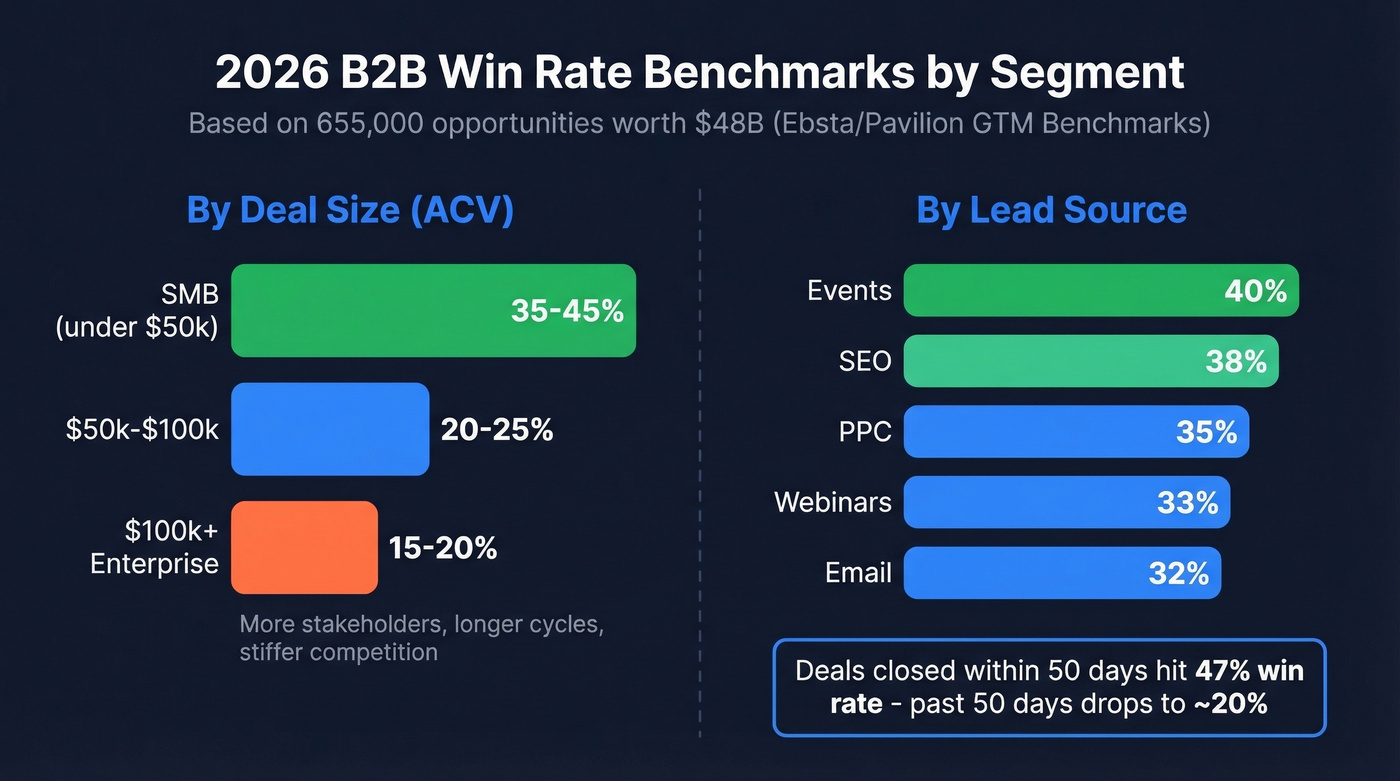
The Ebsta/Pavilion GTM Benchmarks - analyzing 655,000 opportunities worth $48B - confirm what most experienced reps already feel: win rates vary dramatically by deal size and lead source.
By deal size / ACV:
| ACV Range | Expected Win Rate |
|---|---|
| $100k+ | 15-20% |
| $50-100k | 20-25% |
| SMB (<$50k) | 35-45% |
Enterprise deals take longer, involve more stakeholders, and face stiffer competition. Compiled data from Digital Bloom puts the average at 31% for enterprise vs. 39% for SMB at the opportunity-to-close stage.
By lead source:
| Channel | Opp-to-Close Rate |
|---|---|
| Events | 40% |
| SEO | 38% |
| PPC | 35% |
| Webinars | 33% |
| 32% |
Inbound opportunities generally convert 1.5-2.5x higher than cold outbound. One stat worth internalizing: deals closed within 50 days hit a 47% win rate, while deals dragging past that threshold drop to ~20%. Speed kills - in a good way.
How to Calculate Your Win Rate
Win Rate = (Deals Won / Total Decided Deals) x 100
"Decided deals" means won plus lost. Exclude open and stalled opportunities from the denominator - they haven't resolved yet and will artificially depress your number. Quick example: 2 wins out of 8 closed deals = 25% by count. But if those 2 wins totaled $80k out of $140k in total closed revenue, your revenue-based win rate is 57.1%.
Count-based tells you how many opportunities you need to generate. Revenue-based tells you whether you're winning the deals that matter.
How to Improve Your Win Rate
Four levers, ranked by impact.
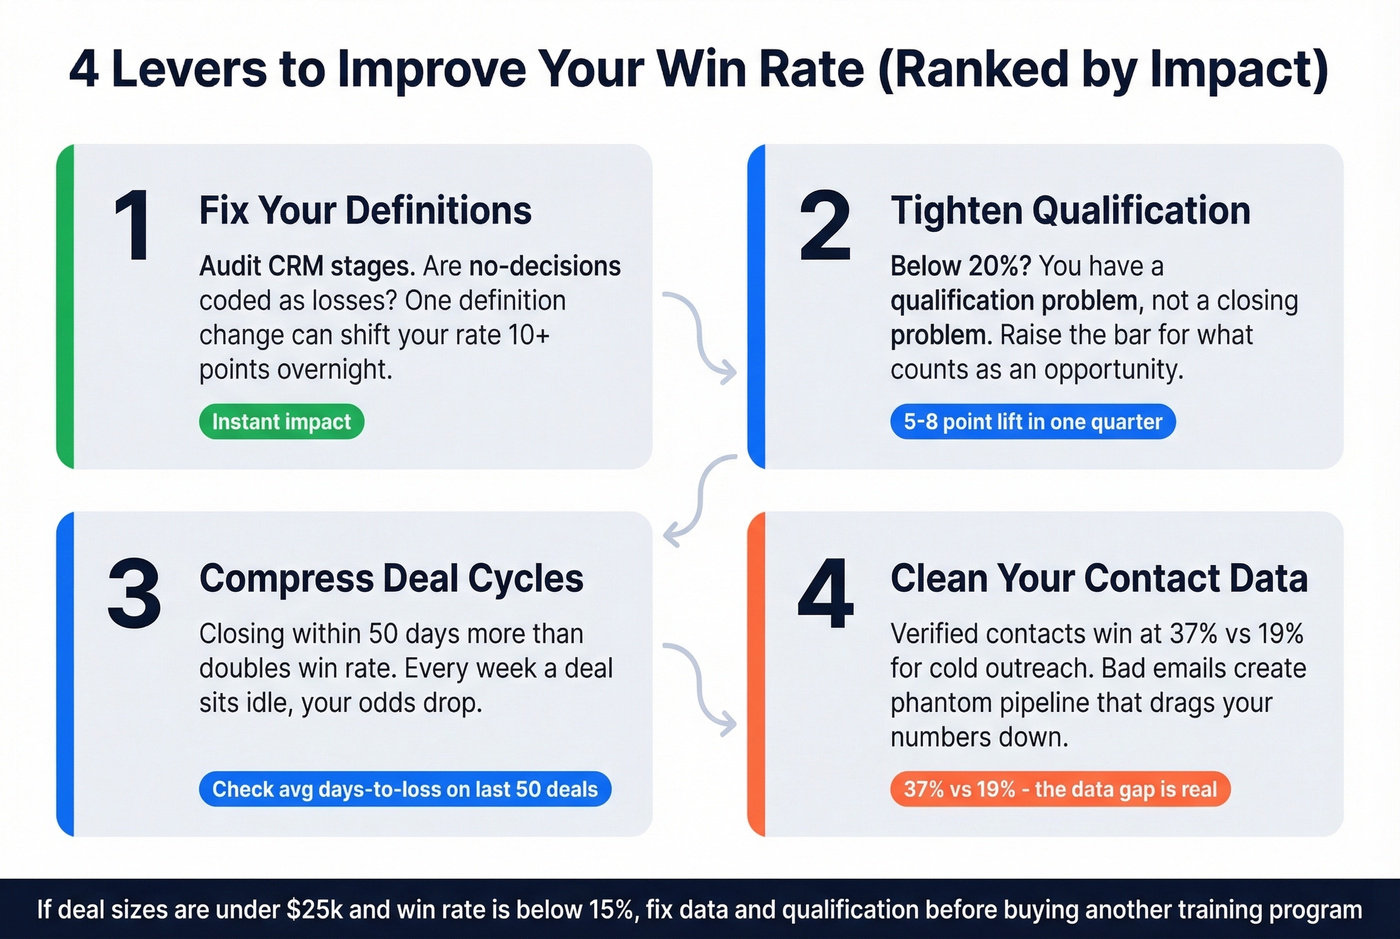
Fix your definitions first. Audit your CRM opportunity stages. Are no-decisions coded as losses? Are stalled deals sitting in the denominator? One definition change can shift your reported win rate by 10+ points overnight - not because you got better, but because you got honest about what you're measuring. Before comparing yourself to any benchmark, make sure you're counting the same way. HubSpot's guide to pipeline management walks through stage definitions if you need a starting framework.
Tighten qualification. Here's the thing: if your win rate is below 20%, you probably have a qualification problem, not a closing problem. You're letting unqualified deals into the pipeline and then wondering why they don't close. Raise the bar for what counts as an opportunity. This is the single highest-leverage change most teams can make, and we've seen it move win rates 5-8 points in a single quarter. If you need a structured way to do it, start with an ideal customer profile and a consistent lead scoring model.
Compress deal cycles. The data is clear - closing within 50 days more than doubles win rate compared to longer cycles. Map your process for unnecessary delays. Every week a deal sits idle, your odds drop. Run a report on your last 50 closed-lost deals and check the average days-to-loss. If it's over 60, you're holding dead weight. This is also where pipeline health and broader funnel metrics make the problem obvious fast.
Clean your contact data. Bad emails and wrong phone numbers create phantom pipeline - prospects counted as opportunities who were never actually reachable. Champify data shows that deals with a known, verified contact had a 37% win rate versus 19% for cold outreach. That gap is enormous, and it starts with data quality. After switching to Prospeo, teams like GreyScout cut bounce rates from 38% to under 4% and saw pipeline increase 140% - because their reps were finally reaching real people instead of chasing dead-end records. If bounce is a recurring issue, it’s worth tracking your email bounce rate and tightening your email deliverability basics.
Let's be honest about something most sales leaders won't say out loud: if your deal sizes are under $25k and your win rate is below 15%, you don't have a sales problem. You have a data and qualification problem wearing a sales costume. Fix those two things before you invest in another training program.
Win rates crater when reps chase phantom contacts. GreyScout cut bounce rates from 38% to under 4% with Prospeo and grew pipeline 140%. At $0.01 per verified email, cleaning up your data costs less than a single lost deal.
Your win rate problem might be a data problem. Find out in 5 minutes.
If you only do one thing after reading this, audit how your CRM defines a "closed" opportunity. That single change will tell you whether your win rate is a real number or a fiction your CRM invented.
FAQ
What's the difference between win rate and close rate?
Win rate divides wins by decided deals (won plus lost). Close rate often includes open and stalled deals in the denominator, producing a lower number. Use win rate for pipeline health; use close rate for forecasting total throughput.
Is a 20% win rate bad?
Not if you're measuring from all opportunities including early-stage - 20% sits squarely within the B2B average. From proposal stage, though, 20% signals a qualification or competitive gap worth investigating immediately.
How does bad contact data affect win rate?
Bounced emails and wrong numbers create phantom pipeline - counted as losses but never actually engaged. Cleaning contacts with a verification tool removes this drag and gives you an accurate picture of real performance. We've seen teams gain 5-10 points on their win rate just by purging undeliverable contacts from the denominator.