What Is a Sales Forecast (And Why Do 80% of Leaders Still Get It Wrong)?
It's Thursday at 4pm. Your VP of Sales pings the Slack channel: "Need updated forecast numbers for the board deck by EOD tomorrow." You open your CRM, stare at a pipeline full of deals you haven't touched in weeks, and start guessing.
That's not forecasting. That's fiction writing with a spreadsheet.
So what is a sales forecast, really? It's a data-driven estimate of how much revenue your team will close over a specific period - a week, a month, a quarter, a year. It's the number your CFO uses to plan headcount, your CEO uses to set expectations with the board, and your reps use to figure out if they're about to have a very good or very bad quarter.
Here's what it's not: a quota (that's a target), a goal (that's aspirational), or a pipeline total (that's a fantasy number). Your pipeline shows $2M. Your forecast should tell you that $800K of it will actually close. The gap between those two numbers is where most teams get into trouble.
What You Need (Quick Version)
Just need the definition? Sales forecasting predicts future revenue based on pipeline data, historical trends, and deal-stage probabilities. You're covered - keep reading for the nuance.
Need to build a forecast today? Jump to the step-by-step section and grab a free template from Zapier.
Your forecasts keep missing? The problem probably isn't your method - it's your data. Jump to the data quality section for the fix that 93% of teams overlook.
Why Sales Forecasting Matters (And Why Most Teams Get It Wrong)
Accurate forecasting pays for itself. Companies with trustworthy forecasts see a 10 percentage point greater increase in annual revenue compared to those without. Teams using data-driven forecasting achieve quota attainment 20 percentage points higher than teams relying on gut feel. And a 15% improvement in forecast accuracy translates to a 3% pre-tax profit improvement - for a $50M company, that's $1.5M straight to the bottom line.
Accurate forecasts let you hire ahead of demand instead of scrambling. They let finance plan cash flow without padding every number by 30%. They prevent the end-of-quarter panic where reps start discounting deals just to hit a number that was wrong from the start.
Revenue prediction isn't optional. It's the foundation every other department builds on.
The Reality Check
The stats on forecast accuracy are brutal:

- 80% of sales and finance leaders missed a quarterly forecast in the past year. Over half missed it two or more times.
- Only 7% of sales organizations achieve 90%+ accuracy.
- Fewer than 25% of organizations achieve even 75%+ accuracy.
- 84% of sales reps didn't meet quota last year - and bad forecasts are a major reason why.
- 60% of forecasted deals don't close.
That last stat deserves a pause. Six out of ten deals your team says will close... won't. Some stall. Some go dark. And some were never real opportunities to begin with - because the contact info was wrong, the outreach never landed, or the "champion" left the company three months ago.
For a mid-market company, a badly missed forecast can mean $1-5M in misallocated resources: hiring plans that don't match reality, inventory that doesn't move, marketing spend aimed at the wrong segments. Consequences of missed forecasts include organizational restructuring, benefits cuts, and layoffs.
Types of Sales Forecasts
Before getting into methods, know that "sales forecast" isn't monolithic. Different business questions demand different forecast types:

- Opportunity Forecasting: Predicts revenue from specific deals in your pipeline. The most common type for B2B sales teams.
- Run-Rate Forecasting: Projects future revenue based on current recurring revenue trends. Essential for SaaS and subscription businesses.
- Pipeline Forecasting: Aggregates all pipeline value by stage to estimate total potential revenue. Broader than opportunity-level forecasting.
- Consumption-Based Forecasting: Predicts revenue based on product usage patterns. Critical for usage-based pricing models (think AWS, Twilio).
- Top-Down Forecasting: Starts with total market size and works down to your expected share. Useful for board-level strategic planning and setting multi-year direction.
- Bottom-Up Forecasting: Starts with individual rep capacity and deal data, then rolls up. More accurate for operational planning - it's account executive forecasting at the rep level aggregated into a team-wide number.
Most teams need opportunity forecasting for weekly pipeline reviews and either top-down or bottom-up for quarterly and annual planning. Pick the type that matches the question you're answering.
60% of forecasted deals don't close - and bad contact data is a leading cause. When emails bounce and calls hit dead numbers, your pipeline is fiction. Prospeo's 98% email accuracy and 7-day data refresh cycle mean every deal in your forecast is built on contacts that actually connect.
Stop forecasting on bad data. Start with contacts that convert.
Sales Forecasting Methods Explained
There's no single "right" method. But there is a right number of methods: two. Teams that combine two approaches (like weighted pipeline + AI-powered analysis) achieve 89% average accuracy versus 67% for a single method. Pick two, not five.
Quantitative Methods
These are the workhorses. They use numbers you already have - deal values, close rates, historical revenue - to project forward.
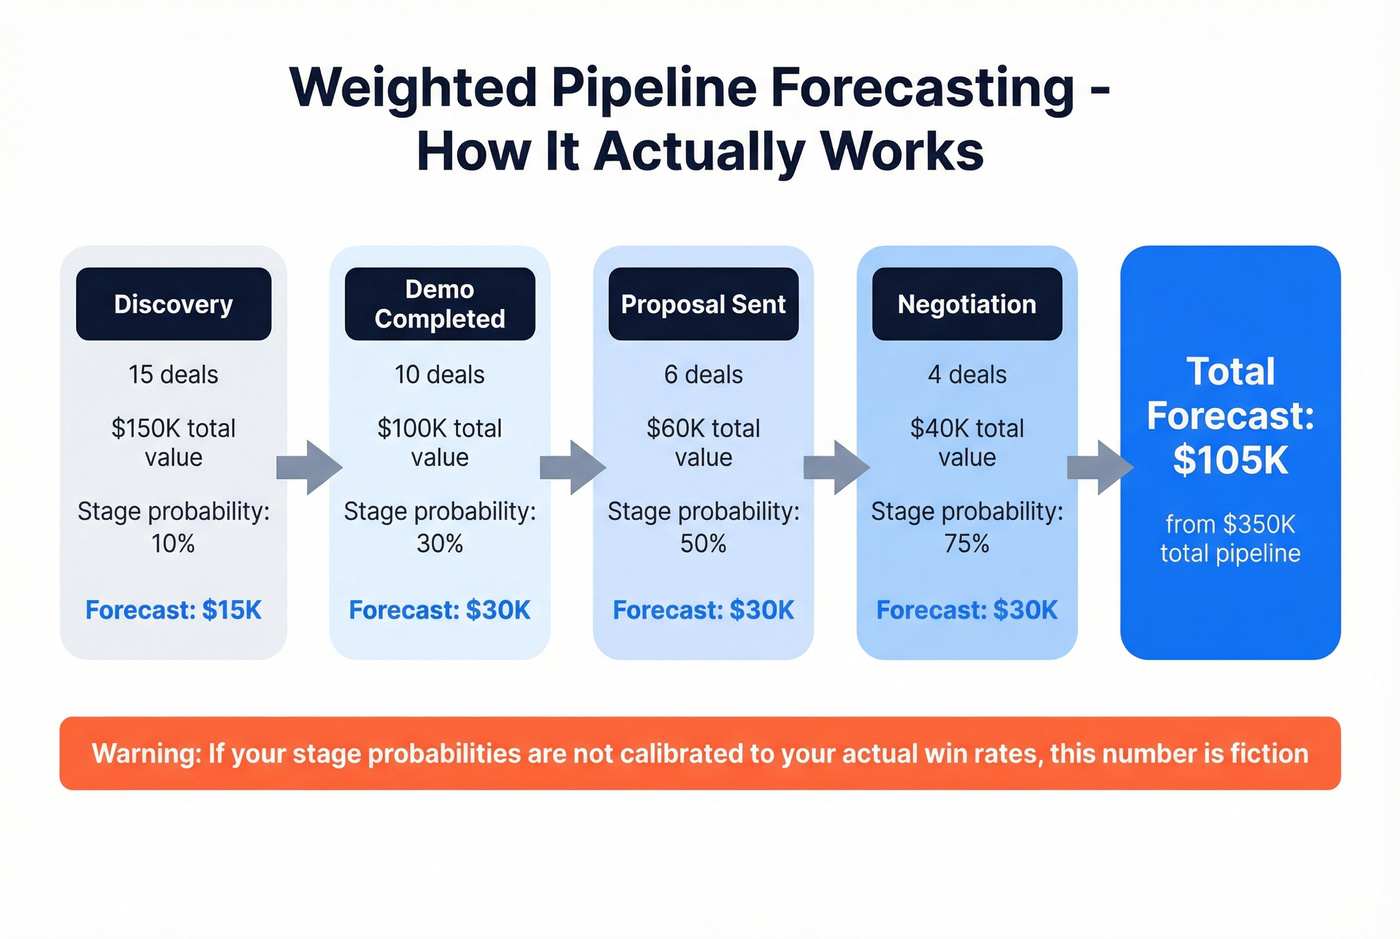
Weighted Pipeline Forecasting
The most common method for a reason. It's intuitive and works with data you already track in your CRM.
Formula: Forecasted Revenue = Σ (Deal Value × Stage Probability)
Worked example: You've got 10 deals worth $10,000 each sitting at the "Demo Completed" stage, where your historical close rate is 30%.
10 × $10,000 × 0.30 = $30,000 forecasted revenue from that stage.
Roll this up across all stages and you've got a forecast. The catch? 74% of organizations rely on weighted pipeline forecasting, but fewer than 50% achieve accuracy higher than 75%. The method is only as good as your stage probabilities - and most teams never calibrate those against actual outcomes.
Historical Growth Forecasting
Simple and useful when you've got consistent historical data.
Formula: Forecast = Prior Period Revenue × (1 + Growth Rate)
If you closed $500K last Q3 and you're growing at 15% year-over-year: $500,000 × 1.15 = $575,000. Clean, fast, and dangerous if your market conditions have changed.
Opportunity Stage Probability
A refinement of weighted pipeline that uses your own win rates instead of generic benchmarks.
Formula: Stage Probability = (Deals Won from This Stage ÷ Total Deals That Reached This Stage) × 100
If 200 deals reached your "Proposal Sent" stage last year and 60 closed, your actual probability is 30% - not the 50% your CRM defaulted to when you set it up three years ago.
Multivariable Analysis and Time Series
This layers in additional factors: deal size, industry, sales cycle length, lead source, number of stakeholders. Time series analysis - where you decompose historical data into trend, seasonality, and noise components - works well for businesses with cyclical patterns. Exponential smoothing, a statistical technique that weights recent data more heavily, is another powerful option here. Most teams don't have the data for multivariable analysis until they're 50+ reps with a mature CRM.
AI/ML Forecasting
ML-powered forecasting reduces errors by 20-50% compared to traditional methods. Traditional approaches typically hit 15-40% MAPE (mean absolute percentage error). Advanced ML systems get that down to 5-15%. And adoption is accelerating: 81% of sales teams now use AI in some capacity.
But the implementation cost ranges from $75,000 to $500,000+, with ROI typically taking 12-24 months. For most SMBs, a well-maintained weighted pipeline in a CRM will outperform a poorly implemented AI tool every single time.
Qualitative Methods
When you don't have historical data - new product, new market, early-stage company - you need human judgment, structured properly.
Delphi Technique: A panel of experts provides independent estimates, then iterates through rounds of feedback until consensus emerges. Slow but useful for market-entry decisions.
Executive Opinion: Leadership estimates based on experience and market knowledge. Fast, cheap, and biased. Use it as a sanity check, not a primary method.
Test-Market Method: Launch in a limited market, measure actual results, extrapolate. The most reliable qualitative method but requires time and budget.
Survey Method: Ask your prospects or customers about purchase intent. Useful for demand planning, less so for pipeline forecasting.
A veteran sales rep on Reddit - someone who's been filling out the same forecast spreadsheet for 15+ years - put it well: the best approach combines narrative planning ("here's what I'm focusing on, here's what I'm trying to achieve") alongside the quantitative models. Numbers without context are just numbers.
Forecasting When You Have No Historical Data
If you're launching a new product or entering a new market, you can't use historical methods. Here's the playbook: start with a bottom-up forecast using your reps' capacity (calls per day × connect rate × close rate × average deal size). Cross-check it against a top-down estimate from your TAM. Run a test market or pilot if possible, and use the Delphi technique with your leadership team to triangulate.
Your first quarter will be off - accept that. The goal is to build the data foundation so quarter two is better.
Adjusting Forecasts During Market Disruption
When the market shifts - recession, new competitor, regulatory change - your historical data becomes unreliable. Shorten your forecast window from quarterly to monthly or even bi-weekly. Weight recent data more heavily than older trends. Layer in qualitative signals: are deal cycles lengthening? Are more deals stalling at the same stage?
I've watched teams cling to pre-disruption models for two full quarters before admitting reality had changed. Don't be that team. When the inputs change, the model has to change.
Choosing the Best Forecasting Method
| Method | Accuracy Range | Best For | Complexity | Data Required |
|---|---|---|---|---|
| AI-Powered | ±3-8% | Large teams, complex cycles | High | Years of clean CRM data |
| Multivariable | ±5-10% | Mid-market, 20+ reps | Medium-High | Multiple deal attributes |
| Weighted Pipeline | ±10-15% | SMBs, 1-3 month cycles | Low-Medium | Deal values + stage data |
| Opportunity Stage | ±10-15% | Teams with win-rate data | Low-Medium | Historical close rates |
| Historical | ±15-20% | Stable, predictable markets | Low | 2+ years of revenue data |
| Qualitative | Varies widely | New products, new markets | Low | Expert judgment |

The sweet spot for most teams: combine weighted pipeline with one other method. If you've got the data, add AI. If you don't, add historical growth as a cross-check. Combined methods achieve 89% accuracy versus 67% for a single method - that's not a marginal improvement, it's a different league.
How to Build a Sales Forecast Step by Step
66% of companies still use spreadsheets for forecasting. That's not a failure - it's pragmatic. A spreadsheet you actually maintain beats a $100K platform nobody trusts. Here's how to make one that works.
Step 1: Define your forecasting period and goals.
Are you forecasting the quarter for the board? The month for your team? The year for finance? Each period needs different inputs and different update cadences. Start with the period your leadership actually asks about. Align the cadence with the decisions it supports - weekly for pipeline management, monthly for resource allocation, quarterly for board reporting.
Step 2: Audit your pipeline data.
Before you forecast anything, answer three questions about every deal in your pipeline: Is the contact information current? When was the last meaningful activity? Is the deal stage accurate? If you can't answer all three, your forecast is already compromised. Tools like Prospeo's bulk email verification can flag invalid contacts across your entire pipeline in minutes - so you know which deals are real before you start counting them.
Step 3: Choose two forecasting methods that match your data maturity.
No historical data? Start with weighted pipeline + qualitative. Two years of CRM data? Weighted pipeline + historical growth. Mature data infrastructure? Weighted pipeline + AI/ML. Think of this as your forecast maturity model - you graduate to more sophisticated approaches as your data quality improves.
Step 4: Build your template.
Your template needs five core columns at minimum:
| Deal Name | Stage | Deal Value | Stage Probability | Weighted Value |
|---|---|---|---|---|
| Acme Corp | Proposal | $25,000 | 30% | $7,500 |
| Beta Inc | Negotiation | $40,000 | 60% | $24,000 |
| Gamma Ltd | Demo | $15,000 | 15% | $2,250 |
Zapier offers free downloadable templates in five flavors: Simple, Daily, Monthly, 1-Year, and 5-Year. Grab one and customize it. Don't overthink this step.
Step 5: Run the forecast and compare against actuals.
Sum your weighted values. That's your forecast. Now - and this is the step most teams skip - compare it against what actually closed last period. If your forecast said $400K and you closed $320K, your model is 20% optimistic. Adjust your probabilities downward. For a complete picture, subtract your cost of sales from the forecasted revenue to estimate gross profit - that's the number finance actually cares about.
Step 6: Iterate monthly.
Track forecast-vs-actual variance every month. Over time, your stage probabilities will calibrate to reality. A forecast that's 25% off in month one can be within 10% by month six if you're disciplined about updating.
Sales Forecasting Tools Worth Considering in 2026
A Reddit thread in r/SalesOperations captured the state of forecasting tools perfectly. A sales leader running Salesforce + Gong for deal insights still defaults to spreadsheets for weekly forecasts. Managers forecast upward in Excel because it gives them the detail they want.
The tools exist. The trust doesn't.
Here's what's actually worth your time:
| Tool | Category | Starting Price | Best For | Key Limitation |
|---|---|---|---|---|
| Google Sheets / Excel | Spreadsheet | Free | Starting out, max flexibility | Manual everything |
| Prospeo | Data Quality | Free tier; paid ~$39/mo | Verifying pipeline contacts | Pair with CRM for forecasting |
| Pipedrive | CRM | ~$39/user/mo | SMBs, built-in forecasting | Limited at scale |
| HubSpot Sales Hub | CRM | Free; paid ~$45/user/mo | HubSpot ecosystem teams | Forecasting in higher tiers |
| Salesforce Sales Cloud | CRM + AI | $25-$330/user/mo | Mid-market to enterprise | Einstein costs extra |
| Zoho CRM | CRM | $14-$40/user/mo | Budget-conscious teams | AI features are basic |
| Gong Forecast | Revenue Intel | ~$250/user/mo | Conversation intel + forecast | Expensive for small teams |
| Clari | Revenue Intel | ~$100-$120/user/mo | Complex pipeline management | Requires clean CRM data |
| Forecastio | AI Forecasting | ~$49-$99/user/mo | Mid-market AI forecasting | Newer, smaller ecosystem |
| Anaplan | Enterprise Planning | $50K-$150K+/yr | Cross-functional planning | Overkill for most |
Revenue intelligence platforms like Gong and Clari save RevOps teams an estimated 30 hours per week by automating deal inspection and pipeline analysis. Built-in analytics surface deal risk signals that spreadsheets simply can't catch. That's real time back - but only if you've got the team size to justify the cost.
The spreadsheet paradox is real: 66% of companies still use them even when they've got a CRM. That's not laziness - it's a signal that CRM forecasting features don't give people the control they want.
Here's the thing: if your average deal size is under $15K, you almost certainly don't need a dedicated forecasting platform. A well-maintained weighted pipeline in Pipedrive or HubSpot is enough. Skip Clari until you've got 20+ reps and a RevOps team. Skip Anaplan until you're doing cross-functional planning across sales, finance, and supply chain. In our experience, teams that start with spreadsheets and graduate to a CRM forecast more accurately than those who jump straight to enterprise tools - because they actually understand their numbers.
And if you're considering ML implementation? Budget $75,000-$500,000+ with a 12-24 month ROI timeline. That's real money. Make sure your CRM data is clean first - garbage in, garbage out applies doubly to machine learning.
Sales Forecasting Mistakes That Kill Accuracy
Fewer than 50% of sales leaders have high confidence in their forecasts. Here's why - and how to fix each one.
Mistake 1: Trusting rep gut-feel over data
Reps leave deal probabilities at 90% after weeks of no contact. They're optimists by nature - it's what makes them good at selling and terrible at forecasting. If a deal hasn't had meaningful activity in 14+ days, the probability should drop automatically.
Mistake 2: Tolerating dirty CRM data
"Sales forecasts are never gonna be perfect. It's human-entered data... personality types, optimism levels, it could be all sorts of stuff." - Rachel Krall, former Head of GTM Strategy at LinkedIn
She's right. Incomplete records, stale contacts, wrong emails - the fix isn't perfection. It's systematic hygiene. Enrich your pipeline contacts quarterly at minimum. Flag deals where the primary contact's email bounces. The forecast can only be as good as the data underneath it.
Mistake 3: Treating all deals in a stage as equal
A $10K deal and a $500K deal both sitting at "Proposal Sent" don't have the same close probability. Static stage probabilities are a lie. Segment by deal size, industry, and sales cycle length at minimum.
Mistake 4: Using a single forecasting method
67% accuracy with one method. 89% with two.
This is the single easiest improvement most teams can make, and most still don't do it. Add a second method today - even if it's just a historical growth cross-check on the back of a napkin.
Mistake 5: Misalignment between Sales and Finance
97% of leaders say Sales and Finance need to work better together. When finance builds their models on different assumptions than sales, you get two forecasts that don't match and a board meeting nobody enjoys. Schedule a monthly alignment meeting. It takes 30 minutes and saves you a quarter of pain.
Mistake 6: Treating the forecast as a static document
A quarterly forecast that doesn't get updated weekly is a historical artifact, not a planning tool. Deals move. Contacts change. Markets shift. Your forecast should too - teams that treat it as a living operational tool catch pipeline problems 3x faster than those who only revisit numbers once a quarter.
Mistake 7: Ignoring the upstream data problem
This is the one nobody talks about. You're forecasting against prospects who changed jobs months ago. Outreach is bouncing. Deals are "open" in the CRM but the contact hasn't been reachable in weeks. The forecast says $2M. Reality says $1.2M. And the gap isn't methodology - it's data.
One Reddit user summed up the frustration: "Inputting and maintaining CRM data is almost like having a 2nd job."
That's the core tension. Reps don't want to maintain data. Leaders need accurate data to forecast. Something has to give. And that last mistake deserves its own section.
The Data Quality Problem Nobody Talks About
Here's the contrarian take most forecasting guides won't give you: the biggest forecasting problem isn't your methodology. It's your data.
Bad data quality costs companies an average of $12.9 million annually. And 97% of sales and finance leaders agree that the right data would make delivering accurate forecasts easier. So why does everyone keep writing articles about forecasting methods while ignoring the data those methods run on?
The logical chain is simple. Bad contact data leads to outreach that never lands, which creates deals that look "open" but are actually dead, which inflates your pipeline, which produces an inaccurate forecast. 60% of forecasted deals don't close. Some of those were never real opportunities because the email bounced, the phone number was disconnected, or the prospect left the company six months ago.
I've seen teams spend weeks calibrating stage probabilities and building ML models on top of a pipeline where 30% of the contact records are stale. That's like tuning a race car engine while the tires are flat.
Before you optimize your forecasting methodology, audit your pipeline data. How many of those open opportunities have verified contact information? A forecast built on verified contacts is fundamentally more accurate than one built on hope.

The fix isn't complicated. Enrich your pipeline contacts quarterly at minimum. Flag deals where the primary contact's email bounces. Auto-decay stage probabilities when outreach goes unanswered. These are operational changes, not technology purchases - though the right data tool makes them dramatically easier. If you want a repeatable system, start with a simple CRM hygiene checklist and a quarterly refresh cadence.
Your weighted pipeline formula is useless if your reps are reaching voicemail and bounced inboxes. Prospeo gives you 125M+ verified mobiles with a 30% pickup rate and 143M+ verified emails - so the deals in your forecast have real conversations behind them, not ghost pipeline.
Turn pipeline fiction into revenue fact for $0.01 per email.
Sales Forecast FAQ: Common Questions Answered
What is a sales forecast and why does it matter?
A sales forecast is a data-driven estimate of future revenue over a defined period, built from pipeline data, historical performance, and market signals. Every downstream business decision - hiring, budgeting, inventory, marketing spend - depends on knowing what revenue is coming in. Companies with accurate forecasts grow revenue 10 percentage points faster than those without.
What's the difference between a sales forecast and a sales quota?
A forecast predicts what your team will likely sell based on pipeline data and historical trends; a quota is a target leadership expects the team to hit. Forecasts should inform quotas, but one is analytical and the other is aspirational. Confusing the two is how you end up with unrealistic targets and demoralized reps.
How often should you update a sales forecast?
Weekly for pipeline-driven forecasts during active sales cycles, monthly for historical trend analysis. Teams that update weekly catch pipeline problems before they become quarterly misses. Treating a forecast as a quarterly exercise is the single most common reason teams are blindsided by revenue shortfalls.
What's a good forecast accuracy rate?
Only 7% of organizations hit 90%+ accuracy. Consistently landing within 10% of your forecast puts you ahead of 79% of sales organizations. Combining two methods - like weighted pipeline plus AI-powered analysis - can push accuracy to 89%, which is achievable for most mid-market teams with clean CRM data.
How does data quality affect forecast accuracy?
Bad contact data inflates your pipeline with deals that were never real - wrong emails mean outreach never lands, stale records mean you're forecasting against people who changed jobs. Verifying your pipeline contacts and refreshing records regularly ensures your forecast reflects actual reachable prospects rather than ghosts.