What Is the Average Open Rate for Email Marketing? (It Depends Who You Ask)
Ask five platforms for the average open rate for email marketing and you'll get five different answers. The number ranges from 21.5% to 43.46% depending on which platform measured it, when they measured it, and how much Apple's privacy features inflated the result. With 376.4 billion emails sent daily, the inbox is noisier than ever - and the metric you're benchmarking against is shakier than most marketers realize.
The Short Answer
- The range: Latest reported email marketing open rates fall between 31% and 43%, depending on the ESP and audience type.
- The catch: Apple Mail Privacy Protection accounts for 49.29% of all tracked opens. It pre-fetches tracking pixels whether or not anyone reads your email, inflating reported rates by 15-20+ percentage points.
- The better metric: Click-to-open rate (CTOR) measures engagement among people who actually opened. Privacy features can't fake a click.
Why Every Source Reports a Different Number
HubSpot says 42.35%. Klaviyo says 31%. Both are correct - for their dataset. The gap comes down to three things: who's sending (ecommerce brands vs. SMB newsletters), how big the sample is, and whether the measurement period caught the full impact of Apple MPP.
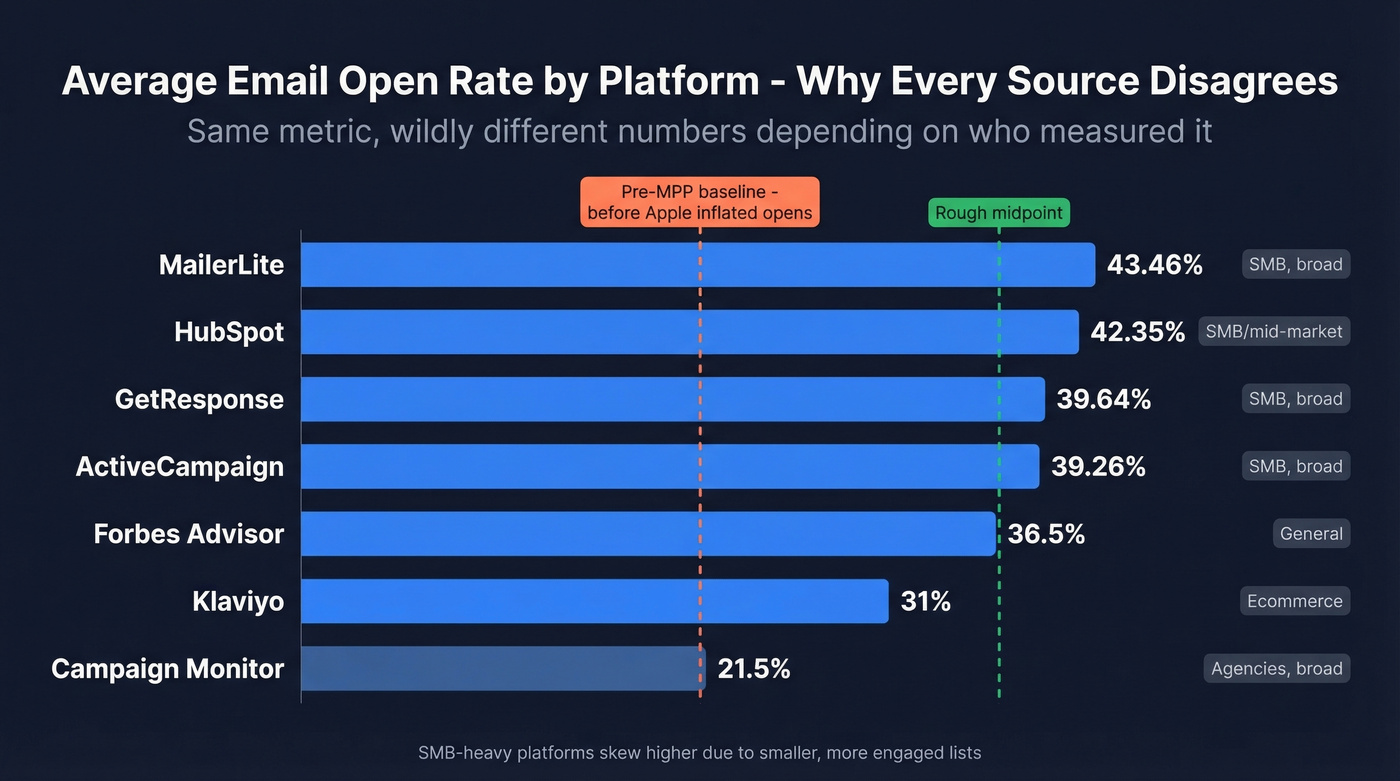
| Source | Avg. Open Rate | Dataset | Audience Skew |
|---|---|---|---|
| MailerLite | 43.46% (median) | 3.6M campaigns | SMB, broad |
| HubSpot | 42.35% | Not disclosed | SMB/mid-market |
| GetResponse | 39.64% | 4.4B messages | SMB, broad |
| ActiveCampaign | 39.26% | Not disclosed | SMB, broad |
| Forbes Advisor | 36.5% | Aggregated | General |
| Klaviyo | 31% | 183K+ brands | Ecommerce |
| Campaign Monitor | 21.5% | 100B+ emails | Agencies, broad |
Campaign Monitor's 21.5% looks like an outlier, but it's actually the most honest number in the table - it was measured before Apple MPP started inflating opens in late 2021. Every number above it includes some degree of phantom opens.
SMB-heavy platforms skew higher because their user bases are dominated by smaller, engaged lists. Ecommerce benchmarks skew lower because those brands blast larger segments with promotional campaigns. Neither is wrong. They're measuring different populations.
List size matters more than you think
Here's a rule of thumb you won't find in most benchmark reports: smaller lists consistently report open rates 10-20 points higher than large ones. A 2,000-subscriber newsletter hitting 48% isn't outperforming a 200,000-subscriber ecommerce list at 30%. It's operating in a completely different context, with subscribers who are far more likely to recognize the sender and actually want the content. This partially explains why SMB-heavy ESPs report higher averages than platforms serving enterprise ecommerce. If your list is under 5,000 and you're seeing 40%+, that's normal, not exceptional.
Average Open Rate by Industry
Industry matters more than most people think. A nonprofit newsletter and an ecommerce promo email aren't competing in the same league.
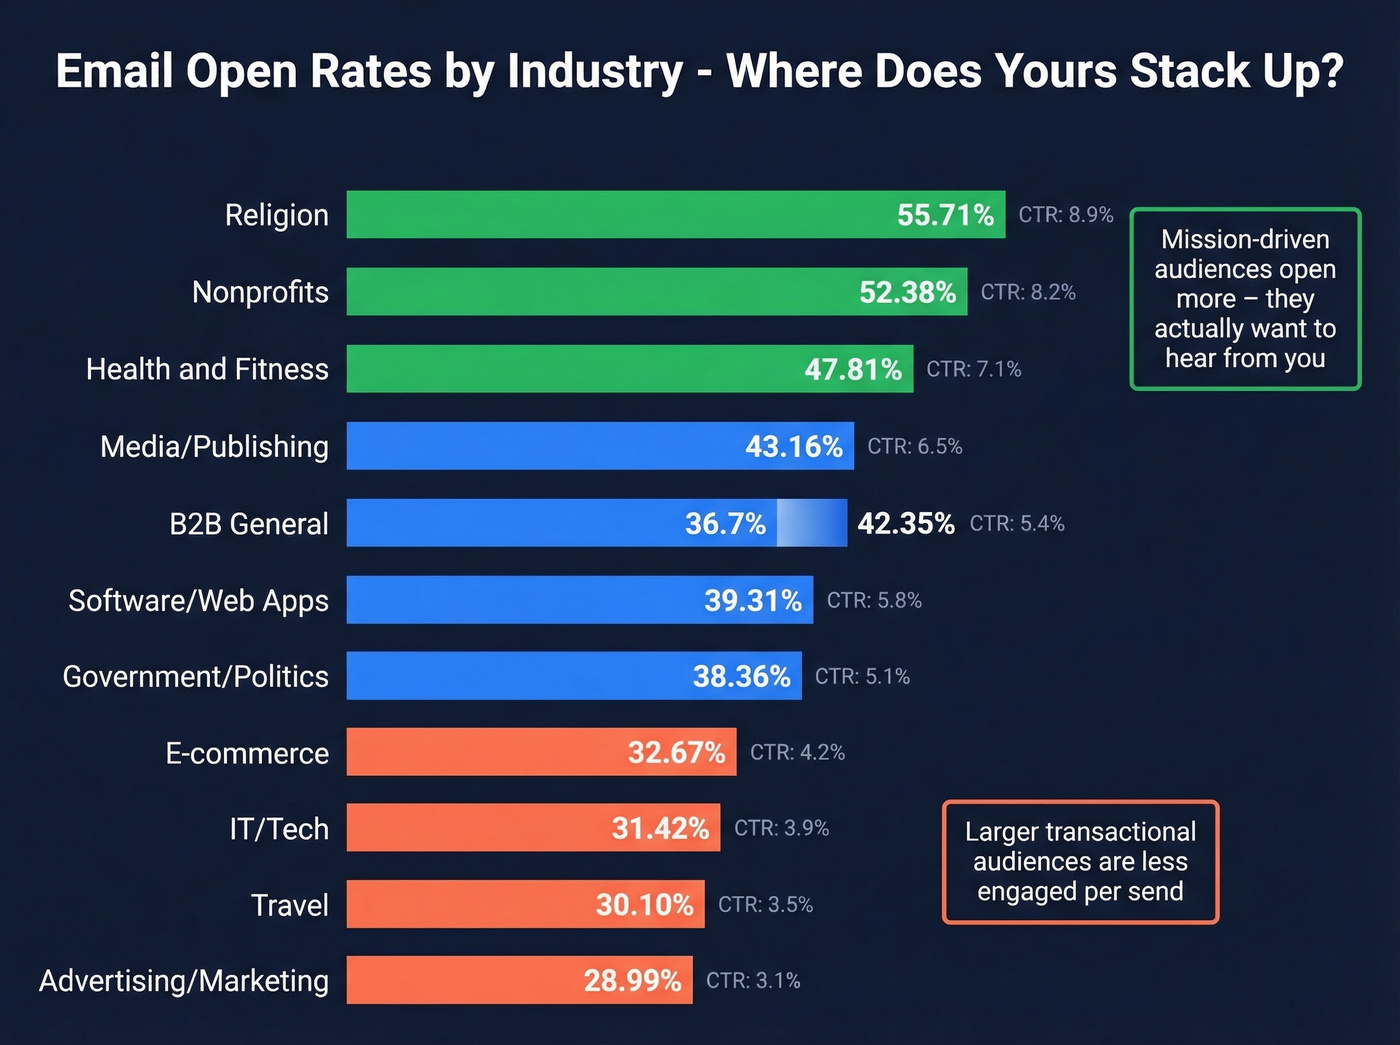
| Industry | Open Rate | CTR |
|---|---|---|
| Religion | 55.71% | 3.71% |
| Nonprofits | 52.38% | 3.12% |
| Health & Fitness | 47.81% | 2.44% |
| Media/Publishing | 43.16% | 3.89% |
| Government/Politics | 38.36% | 2.81% |
| B2B (general) | 36.7%-42.35% | 2.0%-4.0% |
| Software/Web Apps | 39.31% | 2.15% |
| IT/Tech | 31.42% | 2.38% |
| E-commerce | 32.67% | 1.69% |
| Advertising/Marketing | 28.99% | 2.01% |
| Travel | 30.10% | 1.87% |
The pattern is intuitive: mission-driven audiences open at much higher rates because they opted in with genuine interest. Transactional audiences are larger and less engaged per-send. B2B email sits in the middle at 36.7%-42.35%, but with ROI around $36-$42 per dollar spent, even "middle" open rates drive serious revenue.
B2B open rates only matter when emails actually land. With 98% verified email accuracy and a 7-day data refresh cycle, Prospeo keeps your bounce rate under 4% - so the open rates you see reflect real human engagement, not phantom pixels.
Stop benchmarking inflated opens. Start measuring real engagement.
Open Rates by Email Type
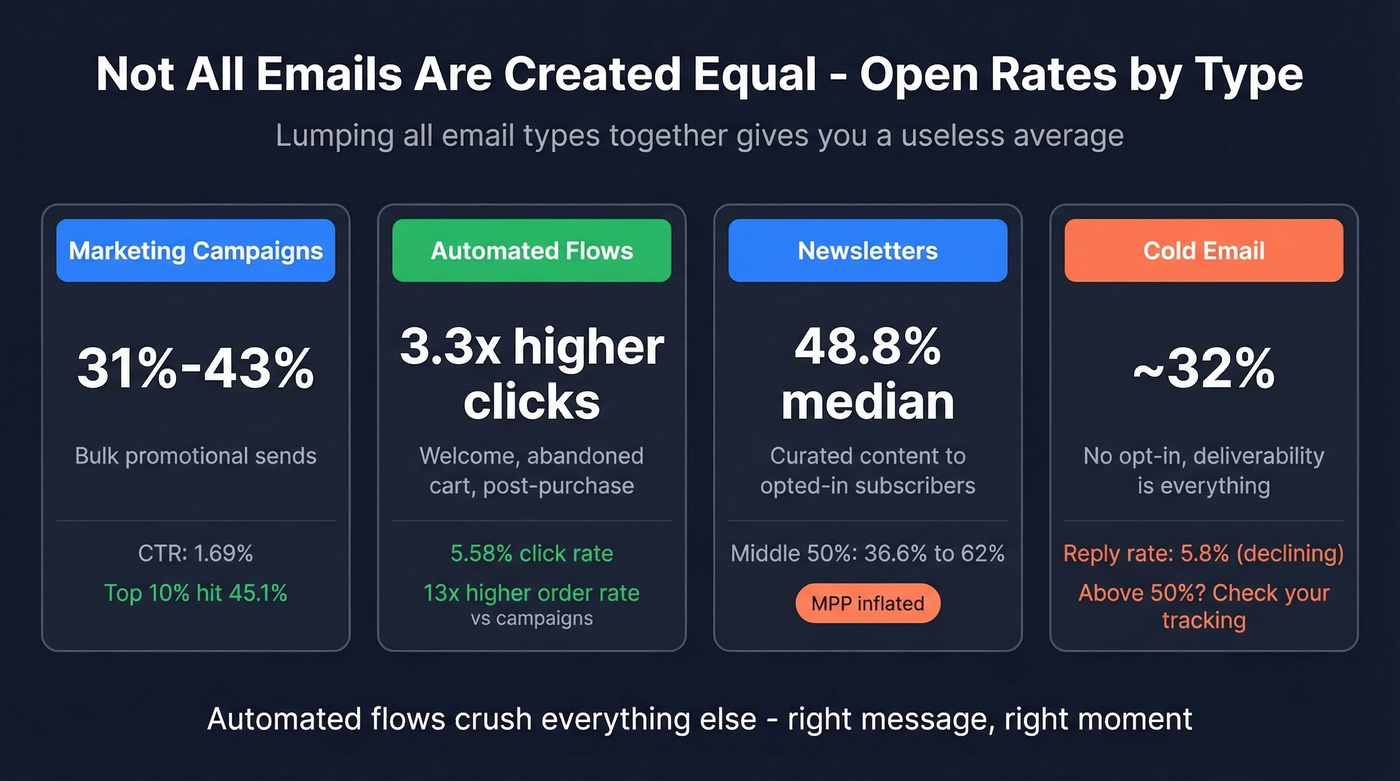
Lumping campaigns, automations, newsletters, and cold outreach into one number is like averaging a sports car and a minivan and calling it "average speed."
Marketing Campaigns
Bulk promotional campaigns - the kind most benchmarks measure - land in the 31%-43% range. Ecommerce benchmarks put campaigns at 31% average, with the top 10% hitting 45.1%. Broader SMB datasets report 43.46%. Your number depends on list quality, audience type, and how much Apple MPP is padding the result.
Automated Flows
Automated emails consistently crush campaigns. Welcome sequences, abandoned carts, and post-purchase flows generate 3.3x higher click rates (5.58% vs. 1.69%) and 13x higher placed-order rates (2.11% vs. 0.16%) than campaigns. These emails hit people at the right moment with relevant content - the engagement gap is enormous.
Newsletters
GlueLetter tracked 11,800 campaigns across ~500 newsletters in Q2 2025 and found a median open rate of 48.8%, with the middle 50% ranging from 36.6% to 62%. MPP inflates these numbers - GlueLetter acknowledges as much - but the relative performance is clear: curated content to opted-in subscribers beats promotional blasts every time.
Cold Email
Cold outreach is a different animal entirely. You're emailing people who didn't opt in, so benchmarks are lower and deliverability matters more. One practitioner on r/b2b_sales reported 32% opens, 7.3% reply rate, and a 2.5% meeting booking rate on well-targeted campaigns. Reply rates have also been declining industry-wide, from 6.8% in 2023 to 5.8% in 2025. Anything above 50% on cold email should make you suspicious of tracking accuracy.
Your Open Rate Is Probably Wrong
Let's be honest: roughly half of your "opens" aren't real people reading your email.
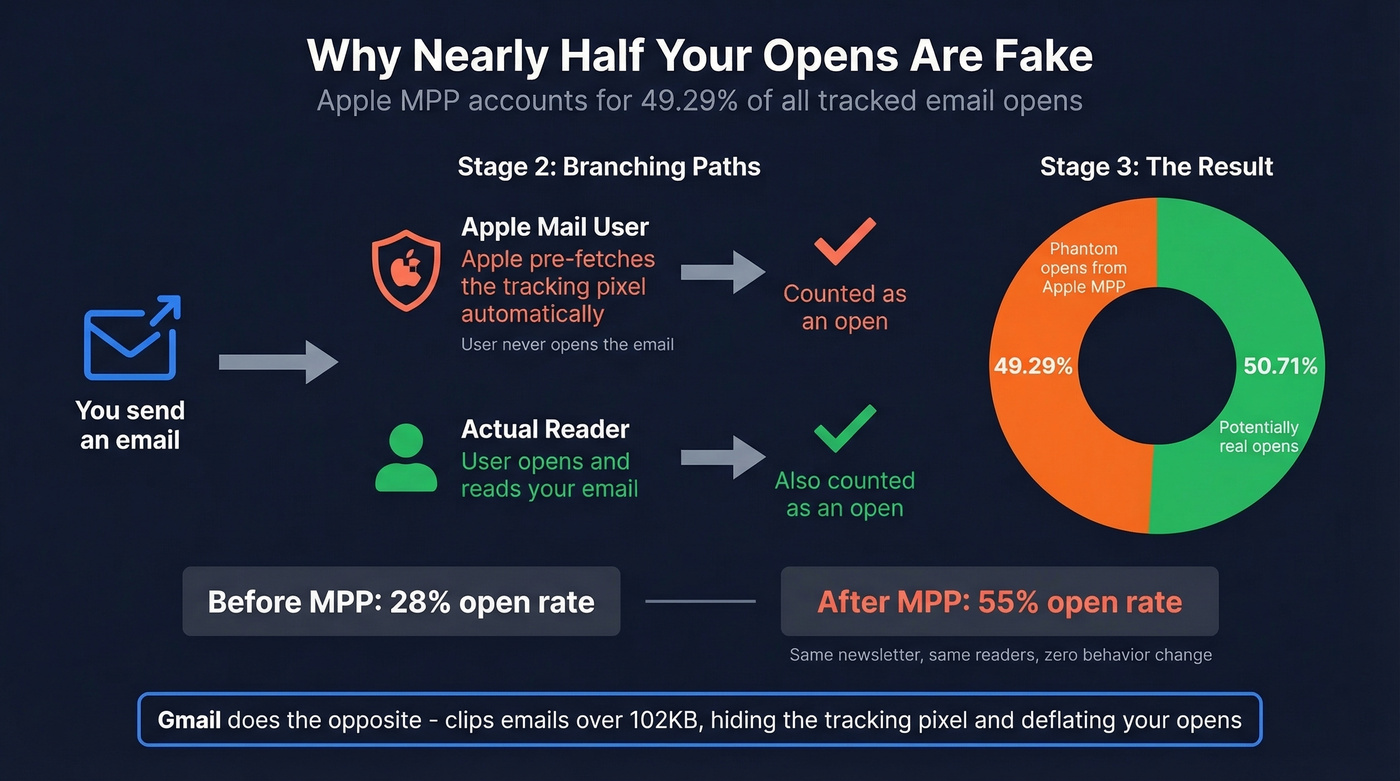
Apple Mail Privacy Protection pre-fetches tracking pixels for every email delivered to an Apple Mail user - whether they open it or not. As of early 2025, Apple MPP accounts for 49.29% of all tracked email opens. That's not a rounding error. That's nearly half your open data being fabricated by a privacy feature.
The inflation is dramatic. One beehiiv newsletter jumped from 28% to 55% after MPP rolled out - with zero change in actual reader behavior. In Apple-heavy segments, up to 75% of reported opens are artificial.
And it's not just Apple. Inbox providers run link-scanning bots, with bot clicks peaking at 3+ million per day in early 2025.
There's also a technical gotcha working in the opposite direction. Gmail clips emails over 102 KB; when that happens, the tracking pixel doesn't load until the user clicks "View entire message." Your reported opens can be artificially low for Gmail users while being artificially high for Apple Mail users - pulled in both directions simultaneously.
Looking ahead, aggregated forecasts project average open rates settling into the 31%-34% range through 2028-2030 as privacy features become standard and the MPP inflation normalizes. The metric will stabilize, but it won't become more trustworthy.
What to Track Instead
The practitioner consensus is blunt: the days of measuring by open rate alone are over.
Opens are still fine for monitoring deliverability trends over time. But for measuring actual engagement, these metrics tell you more:
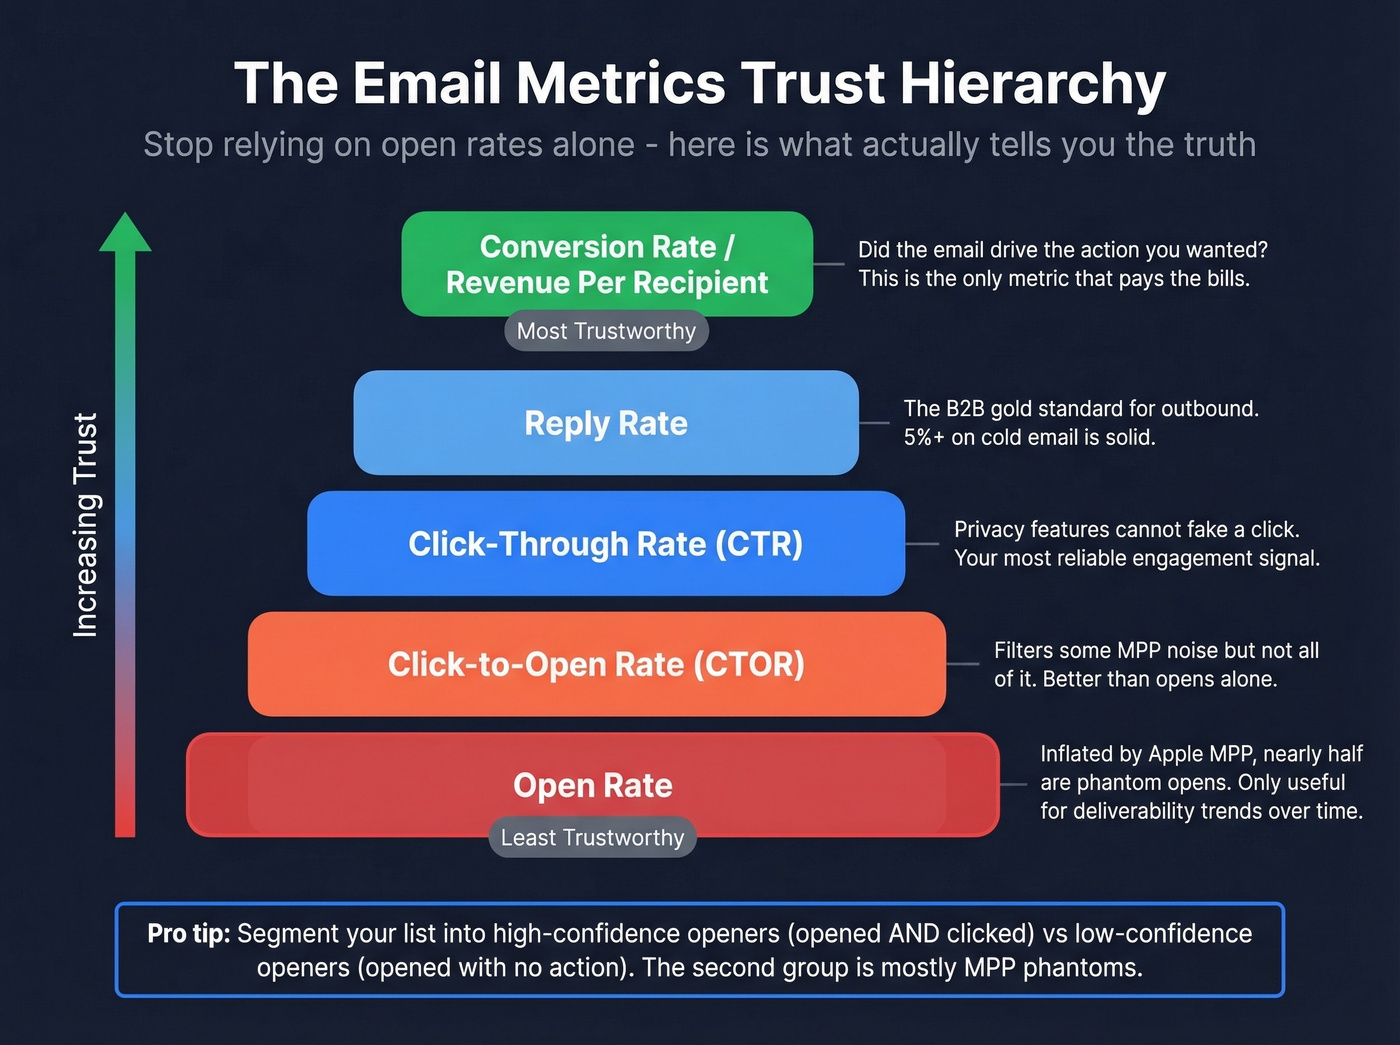
- Click-through rate (CTR): Privacy features can't fake a click. This is your most trustworthy engagement signal.
- Click-to-open rate (CTOR): Engagement among openers. Filters out some MPP noise, though not all of it.
- Conversion rate: Did the email drive the action you wanted? Revenue per recipient is the gold standard for ecommerce.
- Reply rate: The B2B metric that matters most for outbound. A 5%+ reply rate on cold email is solid.
- Inbox placement rate: Only 84% of emails actually reach the inbox - 16.9% never arrive. Your open rate means nothing if emails aren't landing.
One framework we've found useful: segment your list into "high-confidence openers" (opened and clicked) versus "low-confidence openers" (opened with no further action). The second group is overwhelmingly MPP phantoms. This segmentation gives you a much cleaner picture of who's actually reading.
How to Improve Your Open Rate
Even with MPP distortion, the fundamentals still move the needle. Higher real engagement improves deliverability, which improves inbox placement, which improves everything downstream.
Most teams obsess over subject line A/B tests when their real problem is list hygiene. A perfectly crafted subject line sent to a list full of dead addresses, spam traps, and disengaged contacts will underperform a mediocre subject line sent to a clean, engaged segment. Fix the foundation first.
Clean your list before you optimize anything else. Invalid emails don't just waste sends - they signal to ISPs that you're a careless sender. We've seen teams go from 35% bounce rates to under 4% just by running their list through proper verification before hitting send. Prospeo's 5-step verification catches catch-all domains, spam traps, and honeypots before they damage your reputation, with 98% email accuracy and records refreshed every 7 days. If you want a deeper dive on bounce mechanics and targets, see bounce rates and the full email deliverability breakdown.
Nail your sender name. People decide whether to open based on who sent the email before they read the subject line. "Sarah from Acme" outperforms "Acme Marketing Team" in almost every test we've run.
Write subject lines for the preview pane. With average email reading time at just 8.97 seconds, your subject line is doing most of the heavy lifting. You've got about 40 characters on mobile before truncation - front-load the value. If you need inspiration, pull from proven email subject line examples and subject lines that get opened.
Send when your audience is active. 22% of opens happen within the first hour of delivery. Test send times against your own data rather than following generic "Tuesday at 10am" advice. For outbound specifically, use a dedicated best time to send cold emails playbook.
Segment aggressively. A targeted email to 500 engaged contacts will outperform a blast to 50,000 every time. Segment by engagement recency, purchase behavior, or content interest. If you're building segments from firm data, start with firmographic filters and intent based segmentation.
Keep emails under 102 KB. Gmail clips anything larger, and when that happens the tracking pixel doesn't load until the user clicks "View entire message." Strip unnecessary HTML and compress images. If you're relying on opens at all, understand how an email tracking pixel works (and where it breaks).
Cold email open rates are declining because most senders blast stale, unverified lists. Prospeo's 300M+ profiles with 30+ intent and firmographic filters let you target the right buyers - and 98% email accuracy means your deliverability stays pristine.
Fix the data and the open rates fix themselves.
FAQ
What's a good open rate for email marketing in 2026?
Above 40% is strong for small, opted-in lists under 5,000 subscribers. Above 30% is solid for large ecommerce segments. Click-to-open rate is a more reliable engagement measure, since Apple MPP inflates reported opens by 15-20+ percentage points without any change in actual reader behavior.
Why did my open rate suddenly spike?
Most likely Apple Mail Privacy Protection. MPP pre-fetches tracking pixels for 49.29% of all tracked email opens, inflating reported rates by 15-20+ points. Check your click rate - if it didn't move proportionally, the extra opens are phantoms.
Are email open rates still worth tracking?
Open rates remain useful for monitoring deliverability trends over time, but they're unreliable as a standalone engagement metric. Pair them with CTR, conversions, and revenue per recipient. A 40% open rate means nothing if 16.9% of your list never received the email in the first place.
How can I get more accurate open data?
Start by verifying your list - invalid addresses and spam traps hurt inbox placement, which distorts every metric downstream. Then segment "high-confidence openers" (opened and clicked) from "low-confidence openers" (opened with no further action) to filter out MPP noise. Skip open rate as your primary KPI entirely and build your reporting around clicks and conversions instead.