How to Build an ABM Report That Actually Proves ROI
The CMO asks for ABM ROI proof and you pull up a dashboard full of engagement scores, intent signals, and "accounts touched." She stares at it for ten seconds and asks, "So how much pipeline did this create?" You don't have a clean answer.
That's the problem with most ABM reports - they measure activity, not outcomes.
71.2% of organizations now run ABM programs, and the average ROI sits around 137%. ABM works. But the reporting layer between "ABM works" and "here's proof it works" is where most teams fall apart. This guide is your fix: the metrics, formulas, scorecards, and tooling you need to build an ABM report that executives actually trust.
What You Need (Quick Version)
- Stop measuring MQLs. Track account stage progression instead - interested, considering, selecting, closed won.
- Build separate scorecards for each ABM motion: new logo, deal acceleration, expansion, and renewal.
- Copy the formulas below into your dashboard. They're the metrics executives actually care about.
- Match your reporting cadence to your stakeholders - weekly for sales, monthly for marketing ops, quarterly for the C-suite.
- Audit your contact data first. If roughly 20% of your buying committee contacts have changed jobs, your engagement metrics are lying to you.
What Is an ABM Report?
An ABM report measures account-level progression, not contact-level volume. That's the fundamental difference from demand-gen reporting, and it's where most teams get confused.
In demand gen, you're counting individuals - MQLs, form fills, cost per lead. In account-based marketing reporting, the unit of measurement is the account. You're tracking how a buying committee of 5-12 people collectively moves through stages, which channels influenced that movement, and how much revenue resulted.
This means multi-touch attribution replaces single-touch. You can't credit one webinar registration with a $200K deal when six stakeholders interacted with your content across four channels over nine months. Account-based reporting aggregates those touches at the account level, weights them, and connects them to pipeline and revenue outcomes.
If your current report looks like a demand-gen dashboard with "account" slapped on top, you're not doing ABM reporting. You're doing lead reporting with extra steps.
The 6-Dimension Reporting Framework
Rather than dumping every metric into one dashboard, structure your ABM report around six dimensions. This framework, adapted from the Revenue Operations Alliance's reporting guide, moves from targeting through revenue impact in a logical flow.
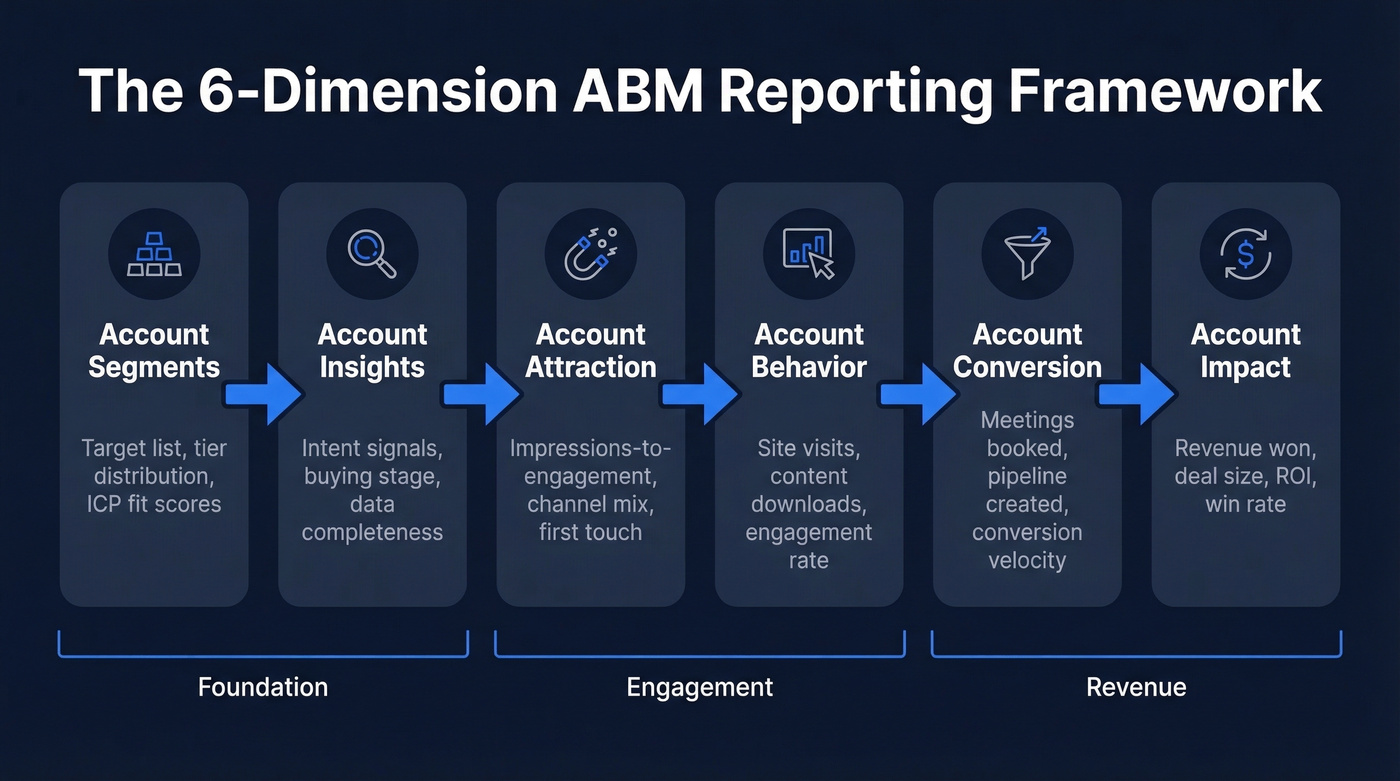
Account Segments - Who you're targeting and why. Track total target accounts, tier distribution (1:1, 1:few, 1:many), and ICP fit scores. This is your foundation; if segmentation is wrong, everything downstream is noise. We've seen teams spend entire quarters optimizing campaigns only to discover their target list was built on outdated firmographic data that hadn't been refreshed in months. Get this right first. (If you need a repeatable process, start with an Ideal Customer Profile scoring rubric.)
Account Insights - Firmographics, intent signals, technographics, and journey stage. Key metrics: intent signal volume, buying stage distribution, and data completeness across your target list. Low data completeness is a red flag - you can't measure what you can't see. (This is where firmographic and technographic data pays off.)
Account Attraction - Which channels and campaigns got attention. Measure impressions-to-engagement ratio, channel mix per account tier, and first-touch attribution by campaign.
Account Behavior - What accounts actually did. Website visits, content downloads, event attendance, pricing page views, repeat visits. Engagement rate and account penetration rate live here - formulas for both are in the next section.
Account Conversion - The handoff zone where marketing and sales alignment either works or doesn't. Meetings booked, opportunities created, pipeline generated. Track conversion velocity - how fast accounts move from engaged to opportunity. This is also where you'll spot broken handoff processes: if accounts stall between "engaged" and "opportunity" for weeks, the problem is usually process, not content.
Account Impact - Revenue won, deal size, expansion revenue, retention. This is where your executive audience lives. Pipeline velocity, win rate on target accounts, and ROI are the metrics that matter here. (For a broader exec view, tie this to pipeline health metrics.)
Think of these as Klipfolio's taxonomy categories - speed, engagement, revenue, expansion, coverage, and close rate - mapped to a logical progression rather than a flat list.
ABM Metrics & Formulas
Copy these into your dashboard.
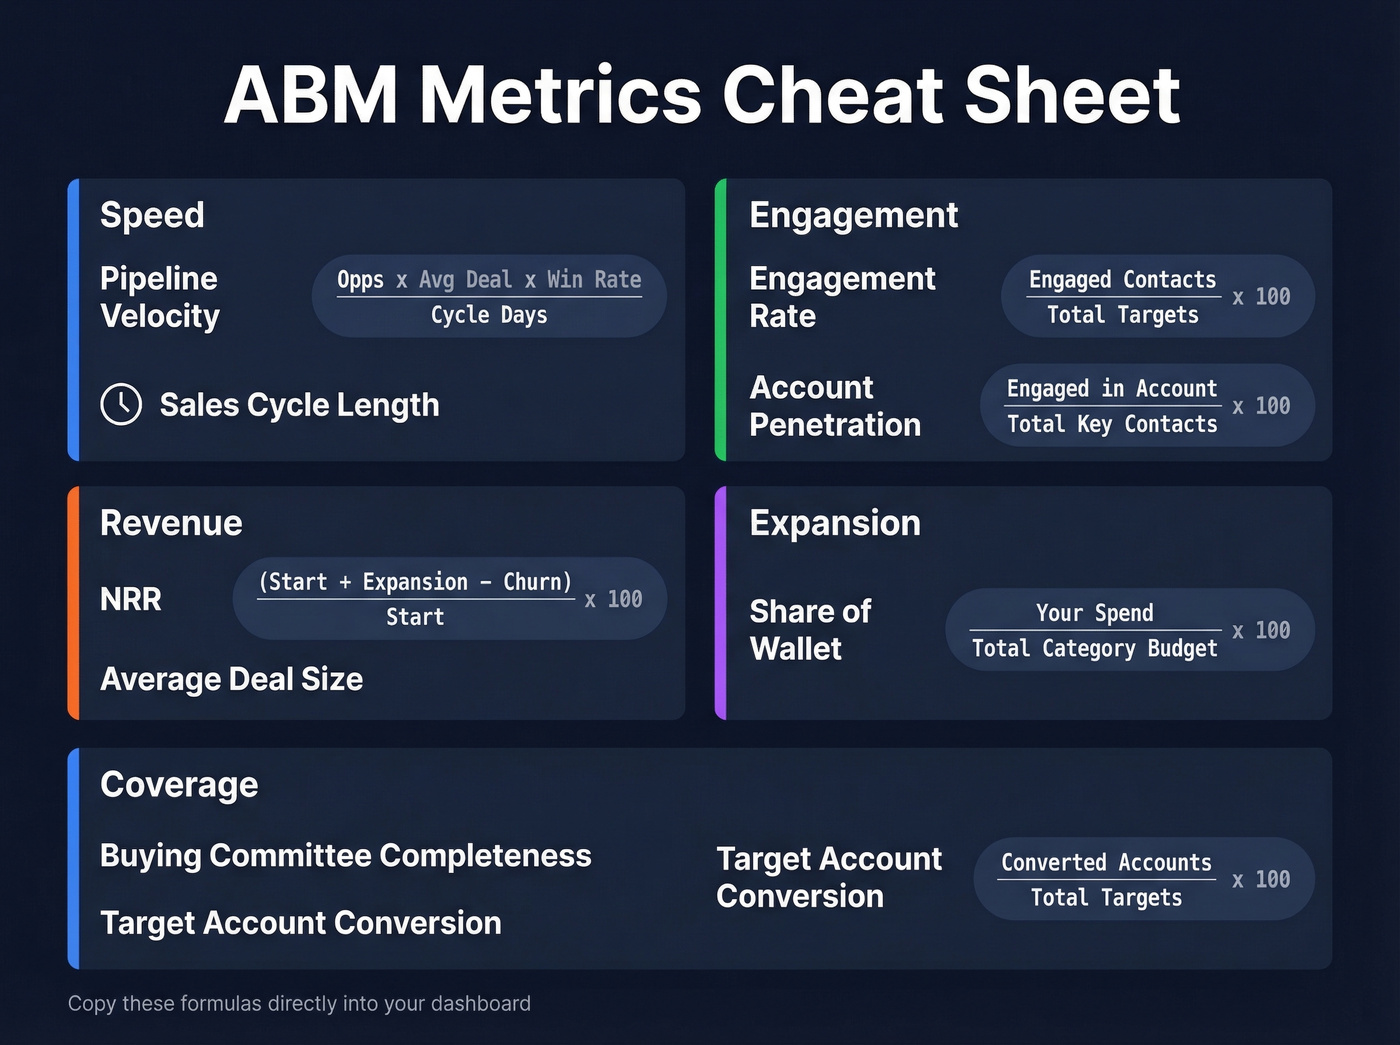
Engagement Rate
(Engaged Contacts / Total Target Contacts) × 100
Example: 340 engaged contacts out of 1,200 target contacts = 28.3% engagement rate.
Account Penetration Rate
(Engaged Contacts in Account / Total Key Contacts in Account) × 100
Example: You've engaged 4 of 7 buying committee members at Acme Corp = 57% penetration.
Target Account Conversion Rate
(Converted Accounts / Total Target Accounts) × 100
Example: 18 accounts created opportunities out of 150 target accounts = 12% conversion rate.
(Number of Opportunities × Avg Deal Value × Win Rate) / Sales Cycle Length (days)
Example: (50 opps × $85K × 0.25) / 120 days = $8,854/day in pipeline velocity.
Net Revenue Retention (NRR)
[(Starting Revenue + Expansion − Churn) / Starting Revenue] × 100
Example: ($500K + $80K - $30K) / $500K = 110% NRR. Anything above 100% means your existing accounts are growing.
Share of Wallet
(Spend with Your Company / Total Potential Spend) × 100
Example: Customer spends $120K with you out of a $400K total category budget = 30% share of wallet.
Renewal Rate
(Renewed Accounts / Total Accounts Up for Renewal) × 100
Example: 42 renewed out of 50 up for renewal = 84% renewal rate.
Organize these by what they measure: speed (pipeline velocity, sales cycle length), engagement (engagement rate, penetration rate), revenue (NRR, deal size), expansion (share of wallet), and coverage (account penetration, buying committee completeness). (If you want a clean definition and improvement levers, see renewal rate.)
What to Measure by Program Type
Stop building one report for everything. Build four.
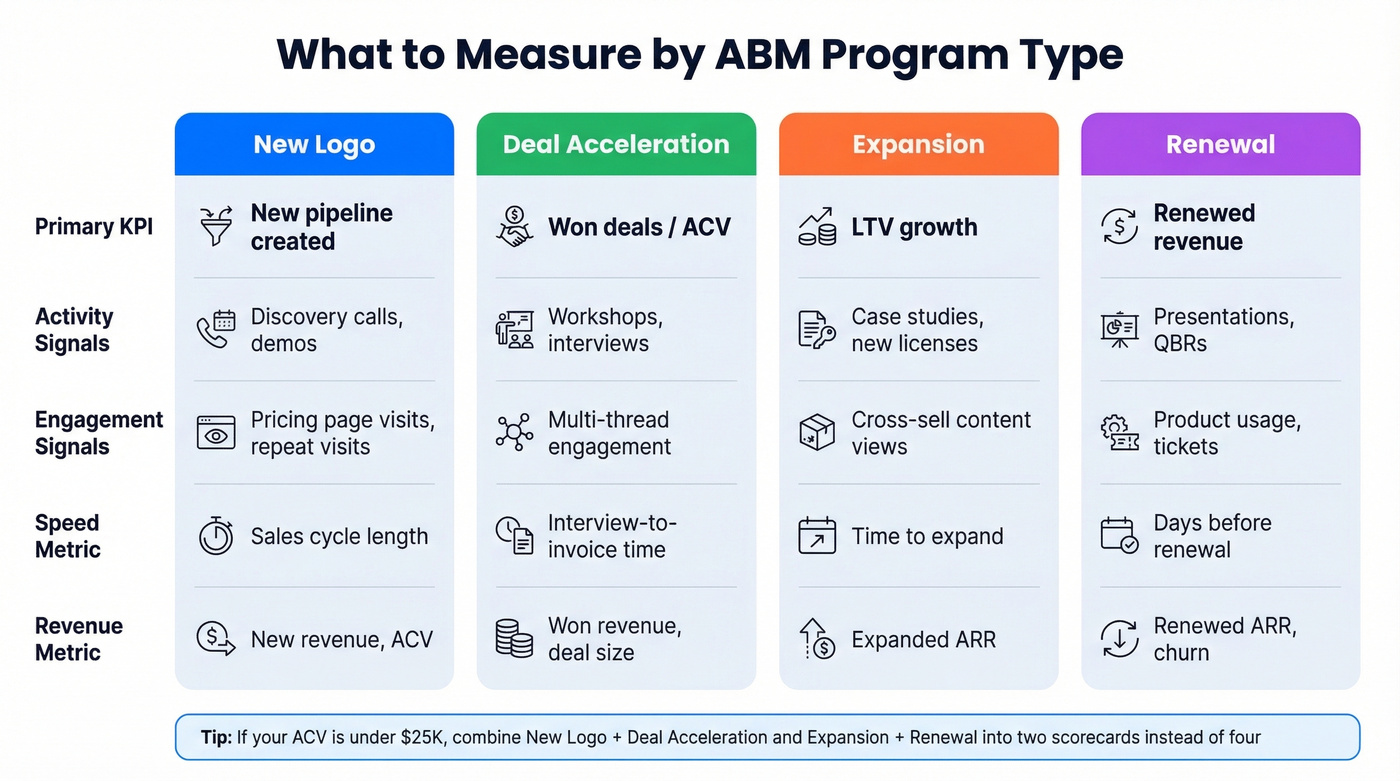
Different ABM motions have fundamentally different success signals. Measuring a renewal program by "discovery calls booked" is as useless as measuring a new logo program by "renewal rate." Here's how to split it:
| Metric | New Logo | Deal Acceleration | Expansion | Renewal |
|---|---|---|---|---|
| Primary KPI | New pipeline created | Won deals / ACV | LTV growth | Renewed revenue |
| Activity signals | Discovery calls, demos | Workshops, interviews | Case studies, new licenses | Presentations, QBRs |
| Engagement signals | Pricing page visits, repeat site visits | Multi-thread engagement | Cross-sell content views | Product usage, tickets |
| Speed metric | Sales cycle length | Interview-to-invoice time | Time to expand | Days before renewal |
| Revenue metric | New revenue, ACV | Won revenue, deal size | Expanded ARR | Renewed ARR, churn |
Define "engaged account" consistently across all four. An engaged account shows increased website visits, pricing or demo page views, repeat visits within a defined window, webinar or event sign-ups, or newsletter subscriptions. Without a shared definition, your engagement numbers are meaningless across programs.
Here's the thing: if your average deal size is under $25K, you probably don't need four separate scorecards. Combine new logo and deal acceleration into one, and expansion and renewal into another. The four-report framework shines when deal complexity justifies the overhead - typically $50K+ ACV with 6+ month sales cycles. For smaller deals, the overhead of maintaining four dashboards eats more time than it saves.
You can't measure account penetration when 20% of your buying committee contacts have changed jobs. Prospeo's 7-day data refresh cycle keeps your target account lists current - with 98% email accuracy and 30+ filters including intent data, technographics, and headcount growth. Your ABM metrics are only as honest as the data underneath them.
Stop reporting on stale contacts. Start with data that's actually current.
Building Your ABM Dashboard
Structure your dashboard in three layers: account metrics at the top, campaign metrics in the middle, financial metrics at the bottom.
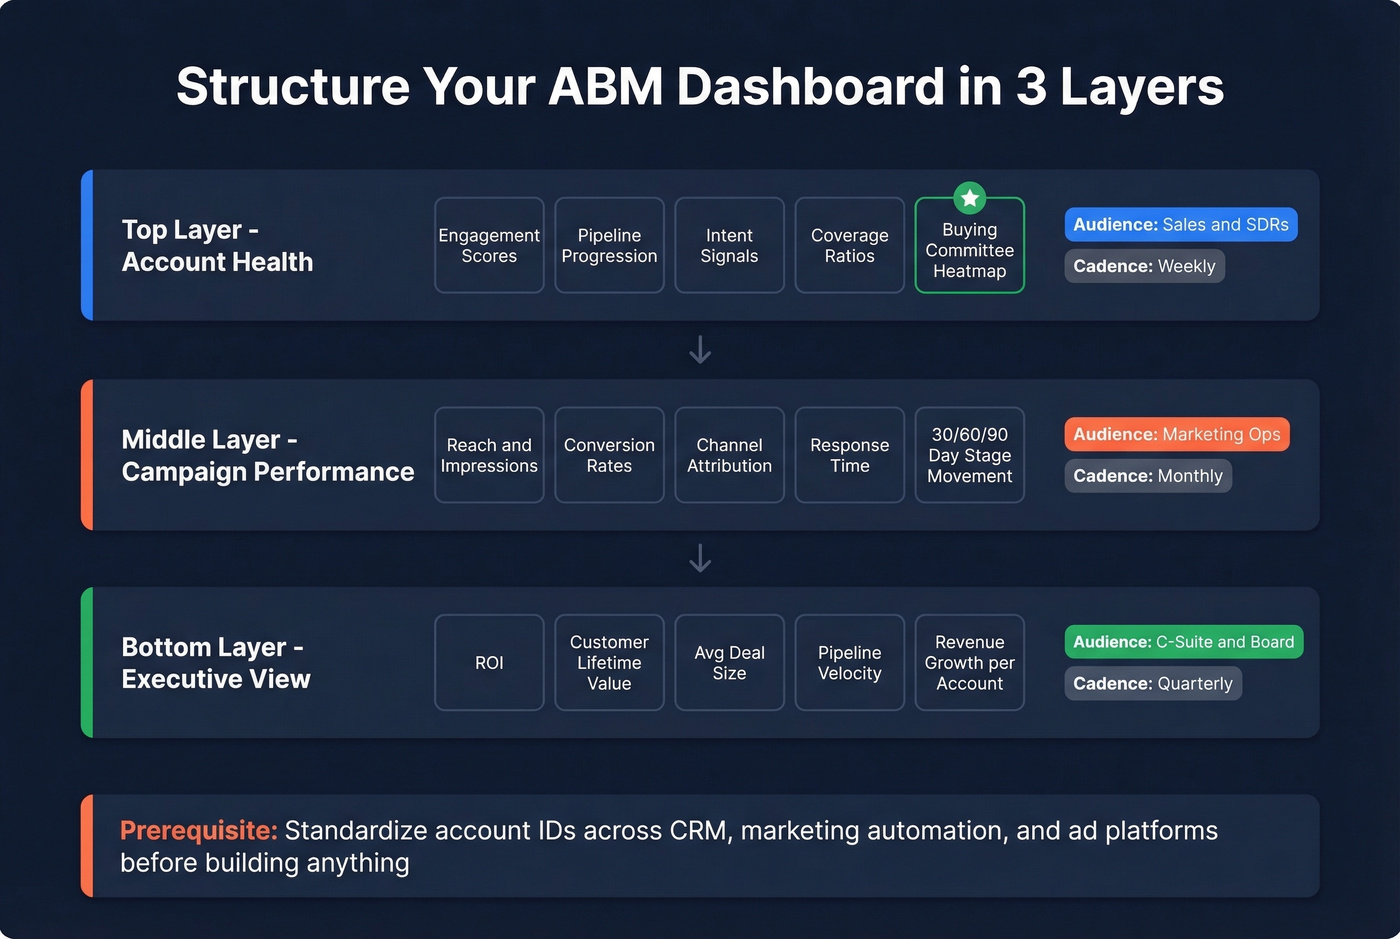
The top layer shows account-level health - engagement scores, pipeline progression rates, intent signals, coverage ratios. This is where sales lives day-to-day. Add a buying committee coverage heatmap here: a visual grid showing which roles you've engaged at each target account. In our experience, this single view drives more sales action than any other dashboard component. When an AE can see they've only reached the CFO and a director but haven't touched the VP of Ops, they know exactly where to focus. (This pairs well with account-based selling workflows.)
The middle layer breaks down campaign performance - reach, conversion rates, channel attribution, response time. Marketing ops owns this. The bottom layer is the executive view - ROI, customer lifetime value, average deal size, pipeline velocity value, revenue growth per account.
One prerequisite most teams skip: data governance. Before building anything, standardize your account IDs across CRM, marketing automation, and ad platforms. If "Acme Corp," "Acme Corporation," and "ACME" are three separate records, your dashboard is fiction. (If you're rebuilding your stack, it helps to align on examples of a CRM and required fields first.)
Match your reporting cadence to your stakeholders:
| Cadence | Audience | What to Report |
|---|---|---|
| Weekly | Sales, SDRs | Intent spikes, engagement changes, new accounts entering pipeline |
| Monthly | Marketing ops | Campaign performance, 30/60/90-day stage movement, channel ROI |
| Quarterly | C-suite, board | Revenue attributed, pipeline influenced, deal velocity, program ROI |
The 30/60/90-day stage movement view is the single most useful dashboard component I've built. It shows where and when accounts move between stages, revealing whether your ABM is accelerating deals or just generating top-of-funnel noise. ABM buying journeys run 6-18 months for enterprise deals, so traditional attribution models that credit the last touch before a meeting miss most of the picture. (If you want a rep-ready operating rhythm, adapt a 30-60-90 day plan to ABM stages.)
Why Your ABM Report Is Lying
Three deals closed from target accounts last quarter, but your attribution dashboard shows $0 influenced pipeline. Sound familiar?
The problem usually isn't your ABM program - it's your tracking infrastructure. The most common mistake is applying a lead-gen mindset to account-based measurement. If your primary KPI is "MQLs generated," you're not measuring ABM. The right metric is percentage of target accounts moving stages.
The second mistake is using contact-level attribution for account-level programs. ABM touches are distributed across a buying committee. If your attribution model only credits the contact who booked the meeting, it misses the five other stakeholders who consumed content, attended webinars, and influenced the decision internally.
Let's break down what proper account-level attribution looks like. Say Acme Corp closes a $200K deal. HockeyStack's multi-touch model would attribute it as 40% LinkedIn ads (multiple stakeholders clicked), 30% whitepaper downloads (three committee members), and 30% demo attendance (two decision-makers). No single contact "sourced" that deal - the buying committee did, across channels and months. If your attribution can't show this breakdown, you're flying blind.
Then there are the technical failures. For teams running HubSpot, here's what commonly breaks attribution:
- Cookie loss from Safari ITP and ad blockers
- UTM parameters stripped by redirects and link shorteners
- Unsupported ad types that don't track
- Contacts not marked as Marketing Contacts, excluding them from attribution dashboards
- Deals missing close dates or wrong stage mappings
- HubSpot's 90-day attribution window that can't capture a 12-month enterprise cycle
And here's one that nobody talks about enough: stale contact data silently corrupts your engagement metrics. If a fifth of your buying committee contacts have changed jobs, your engagement rate looks worse than reality, your coverage ratios are inflated with ghost contacts, and attribution misses touches from the people who replaced them. We've seen teams waste months debugging attribution when the real problem was a contact database that hadn't been refreshed in weeks. Tools like Prospeo with a 7-day data refresh cycle and 98% email accuracy keep your buying committee maps current so engagement signals actually reflect what's happening. (If you're evaluating vendors, compare options in data enrichment services.)
ABM Reporting Tools
You don't need a $55K/year enterprise platform to build a useful ABM report. Many ABM platforms won't even tell you what they cost, which makes building a business case unnecessarily painful.
| Tool | Best For | Starting Price | Key ABM Feature |
|---|---|---|---|
| Prospeo | Data quality layer | Free tier; ~$0.01/email | 98% email accuracy, 7-day refresh, intent data |
| HockeyStack | ABM attribution | ~$2,200/mo | Multi-touch account attribution |
| Demandbase | Full-stack ABM | ~$18K/yr (SMB) | Intent + engagement + orchestration |
| 6sense | Enterprise ABM | ~$55K/yr | Predictive intent + buying stage AI |
| Looker Studio | Free dashboards | Free | Custom ABM dashboards from any data source |
| Amplitude | Product-led ABM | Free (50K MTUs) | Account engagement + deal progression |
HockeyStack is the strongest pure-play ABM attribution tool right now. It connects engagement to pipeline movement to revenue at the account level, which is exactly what most CRMs can't do natively. At ~$2,200/mo it's not cheap, but it's a fraction of the enterprise platforms and does the attribution piece better than most of them.
Demandbase is the full-stack option - intent data, engagement scoring, advertising, orchestration, and reporting in one platform. SMB packages often start around $18K/year. It makes sense if you want a single vendor. The tradeoff: implementation takes months, not days.
6sense is enterprise ABM with predictive intent and AI-powered buying stage identification. At ~$55K/year, it only makes sense for organizations running ABM at scale across hundreds of target accounts. Skip this if your target account list is under 200 - you'll pay for capabilities you won't use.
Looker Studio is free and surprisingly capable for custom dashboards if you're willing to pipe in data from your CRM. Amplitude offers a free ABM dashboard template that tracks account engagement and deal progression - worth testing before committing to a paid platform.
Every tool on this list is only as good as the contacts feeding it. ABM platforms built on stale data produce stale reports. That's why the data quality layer matters as much as the reporting layer. (If you're building a prospecting stack alongside ABM, start with SDR tools.)
Account penetration rate requires knowing every member of the buying committee - and having verified contact data for each one. Prospeo covers 300M+ professional profiles with 125M+ verified mobiles and 143M+ verified emails, so you can map and reach full buying committees instead of reporting on partial coverage.
Full buying committee coverage starts at $0.01 per verified email.
ABM Benchmarks for 2026
A survey of 771 marketers found the average ABM ROI at 137%. Demandbase's benchmark study of 300+ global marketers reported that top performers achieve 81% higher ROI with ABM compared to other marketing strategies. 78.7% of companies now incorporate AI into their ABM programs, and 49.7% plan to increase ABM budgets in 2026.
But these numbers are averages across wildly different program maturities. A team running 1:1 ABM against 50 enterprise accounts will have different benchmarks than a team running 1:many programmatic ABM against 5,000 accounts. Your real benchmarks should come from your own quarter-over-quarter progression - are target accounts converting faster? Are deal sizes growing? Is pipeline velocity improving? That's what matters, not whether you're above or below an industry average that blends Fortune 500 programs with startups running their first ABM pilot.
ABM Reporting FAQ
What's the difference between an ABM report and a demand-gen report?
An ABM report measures account-level progression - stage movement, buying committee coverage, deal velocity - across multiple stakeholders. Demand-gen reports measure contact-level volume: MQLs, form fills, cost per lead. The unit of analysis shifts from individual to account, and attribution shifts from single-touch to multi-touch.
How often should I update my ABM report?
Weekly for tactical engagement signals like intent spikes and new accounts entering pipeline. Monthly for pipeline movement and campaign performance. Quarterly for revenue impact and ROI. Match cadence to the stakeholder - sales needs weekly signals, the C-suite needs quarterly outcomes.
Which ABM metrics matter most to executives?
Pipeline influenced, revenue attributed, deal velocity, and program ROI. Executives don't care about engagement scores in isolation - lead with financial impact. "ABM influenced $2.1M in pipeline this quarter at 22% win rate" beats "engagement score increased 14 points" every time.
Why does my attribution show $0 influenced pipeline?
Almost always a tracking failure, not a program failure. Common causes: cookie loss from ad blockers, UTM parameters stripped by redirects, contacts excluded from attribution in HubSpot, or deals missing close dates. Audit CRM hygiene and attribution windows before questioning your strategy.
How can I improve data quality for ABM reporting?
Use a data provider with a weekly refresh cycle - the industry average of 6 weeks means contacts go stale mid-campaign. Standardize account names, deduplicate records, and verify buying committee contacts quarterly at minimum. The consensus on r/sales is that bad data is the number one silent killer of ABM programs, and our experience backs that up.