Account Management KPIs: What to Track in 2026
You're in a QBR. The VP asks for net revenue retention. You pull up your dashboard and realize you've been tracking logo retention - how many customers stayed - not dollar retention. The room goes quiet. That's the moment most account managers discover their KPIs have been measuring the wrong thing.
A Bain & Company study found that a 5% increase in retention can boost profits by 25-95%. The gap between "tracking KPIs" and "tracking the right KPIs" is where that profit lives.
The Five That Matter Most
If you track nothing else, track these:

- Net Revenue Retention (NRR) - the single best indicator of whether your accounts are growing or slowly dying. Top performers hit 120%+.
- Customer Health Score - a composite leading indicator that flags churn 60-90 days before it happens.
- Churn Rate - the baseline your board cares about most.
- NPS - not a growth metric, but the canary in the coal mine for relationship decay.
- Expansion Revenue as % of Total New ARR - the median SaaS company gets ~40% of new ARR from expansion. If your number is lower, your AMs aren't growing accounts.
That's the shortlist. Let's go deeper.
Every Metric Worth Tracking
Retention KPIs
Net Revenue Retention (NRR) is the metric that separates good account management from great. The formula:
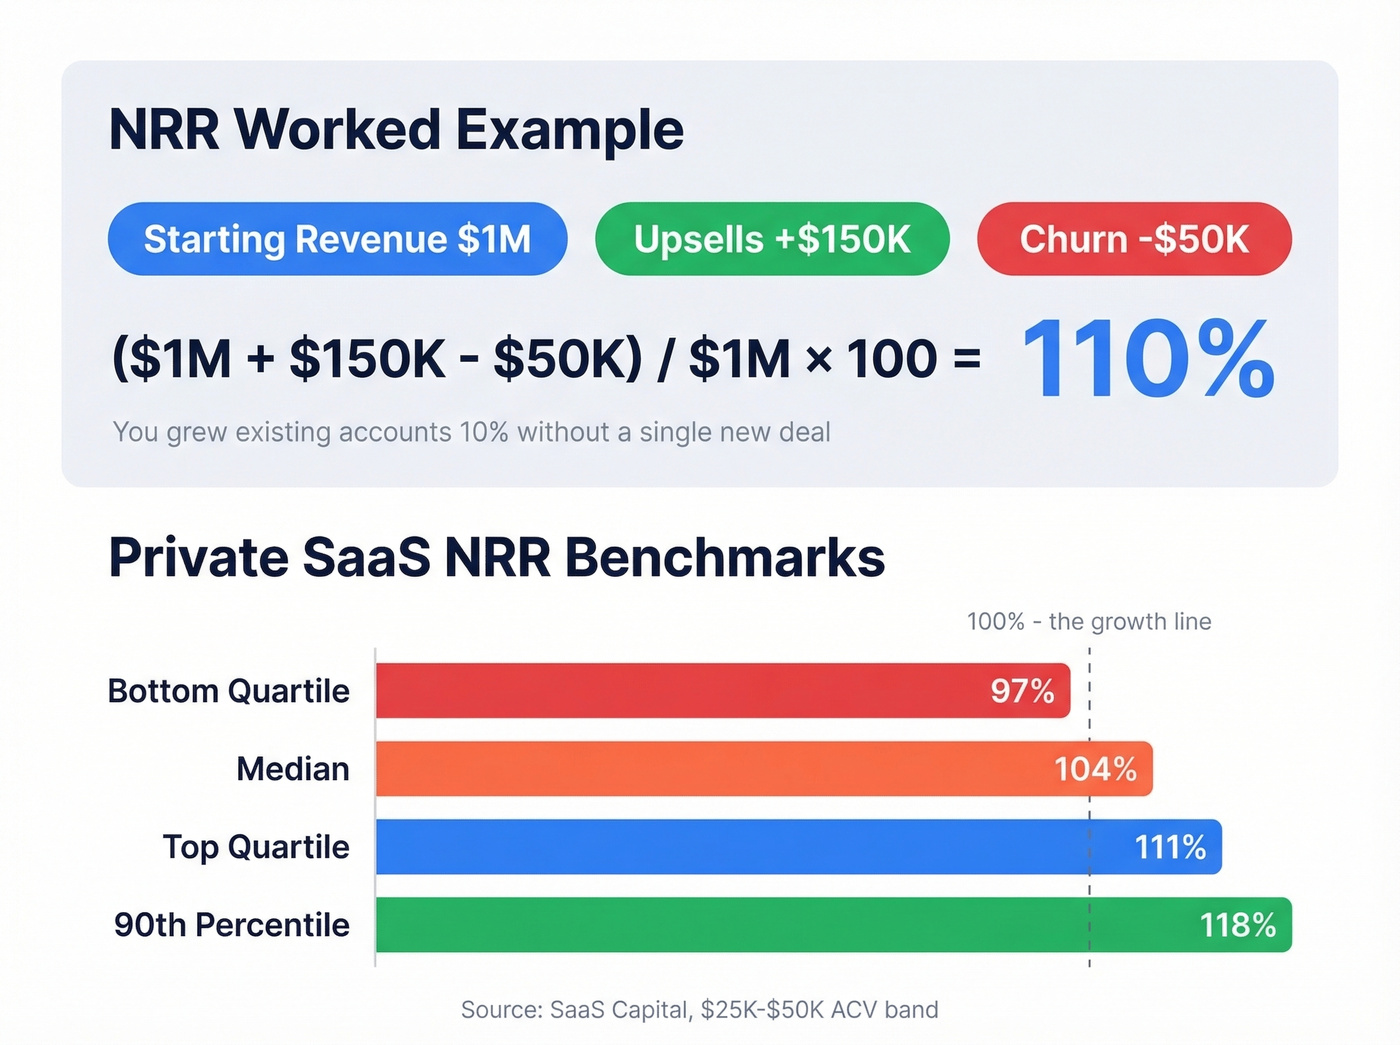
(Starting Revenue + Expansion - Churned Revenue) / Starting Revenue x 100
A worked example makes this concrete. Say you start Q1 with $1M in recurring revenue, add $150K in upsells, and lose $50K to churn. NRR = ($1M + $150K - $50K) / $1M x 100 = 110%. You grew your existing base by 10% without closing a single new deal.
An NRR above 100% means you're growing revenue inside your existing base without adding a new logo. The median for private SaaS companies sits at 104%, with the 90th percentile hitting 118%. Segment by ACV for more useful benchmarks: companies in the $25K-$50K ACV band see a median NRR of 102%, top quartile at 111%, and bottom quartile at 97%.
Here's why this matters beyond the spreadsheet: strong NRR is associated with ~2.3x higher valuations. Your investors care about this number more than almost anything else.
Gross Revenue Retention (GRR) strips out expansion to show the raw impact of churn and contraction. Same cohort approach as NRR, but you exclude upsells, cross-sells, and price increases. GRR can never exceed 100%. Median GRR runs 92%, with the 90th percentile at 98%. If your GRR is below 90%, you've got a retention problem that expansion revenue is masking.
Customer Churn Rate is the simplest formula in the stack: (Customers Lost / Starting Customers) x 100. It's a lagging indicator - by the time someone churns, you've already lost. But it's the denominator that makes every other metric meaningful. If you need a deeper diagnostic, run a proper churn analysis before you change comp plans or playbooks.
Growth KPIs
Expansion Revenue - upsells plus cross-sells as a percentage of total new ARR - is where account management earns its seat at the revenue table. The median SaaS company gets about 40% of new ARR from expansion. Companies above $50M ARR push that past 50%. If your expansion number is in the teens, your AMs are relationship managers, not revenue drivers. (If your team still debates the mechanics, see Upsell vs Cross-Sell in SaaS.)
Customer Lifetime Value (CLV) ties everything together. The standard formula - Average Revenue Per Account x Gross Margin x Average Customer Lifespan - gives you the long view. The healthy LTV:CAC ratio sits between 3:1 and 5:1, with top companies exceeding 4:1. If you want to pressure-test your inputs, start with a clean definition of cost to acquire customer.
Organic Growth Rate measures renewals plus expansion as a share of total growth. It's the most profitable growth you can generate - no new CAC, no new onboarding cost. When median SaaS annual growth has slowed to 26% in 2026 (down from 47% in 2024), organic growth from existing accounts isn't optional anymore. It's survival.
Satisfaction KPIs
NPS gets more credit than it deserves. The formula is straightforward: % Promoters minus % Detractors. For B2B SaaS, a score between 30 and 60 is strong. A high NPS doesn't mean accounts will expand. A low NPS means they're about to leave. Treat it accordingly.
Customer Health Score is the most operationally useful KPI on this list. It's a composite metric - typically scored 0-100 - that combines product usage, onboarding completion, support ticket trends, NPS trajectory, CSM qualitative pulse, and expansion signals. 84% of companies with formal CS programs use health scoring, and 67% update scores at least weekly. The payoff: health scores can flag churn risk 60-90 days before it happens, and customers who complete onboarding are 3-5x more likely to renew than those who don't.
Standard thresholds: 0-59 is red (at risk), 60-79 is yellow (needs attention), 80-100 is green (healthy). Segment by deal size and lifecycle stage - a $200K enterprise account and a $5K SMB account shouldn't be scored the same way.
Referenceable Clients is the KPI nobody tracks but everybody wishes they had when marketing asks for case studies. If your happiest customers won't go on record, your satisfaction metrics might be lying to you.
Operational KPIs
QBR Completion Rate is a leading indicator. Teams that consistently run quarterly business reviews catch problems earlier and surface expansion opportunities faster. If your completion rate is below 80%, your AMs are firefighting instead of managing. If you need to standardize the meeting itself, use a consistent set of QBR questions.
Customer Interaction Frequency matters, but quality beats quantity. Ten check-in emails don't equal one strategic conversation about the customer's roadmap.
Employee Satisfaction is on this list because the correlation is real. Happier AMs build stronger relationships, stay longer, and carry institutional knowledge that directly reduces churn. When your best AM leaves, their book of business gets shaky fast.
Benchmark Reference Table
| KPI | Formula | Good | Great |
|---|---|---|---|
| NRR | (Start + Exp - Churn) / Start x 100 | 104% | 118%+ |
| GRR | Same as NRR, excl. expansion | 92% | 98%+ |
| Churn Rate | Lost / Start x 100 | <10% annual | <5% annual |
| NPS | % Promoters - % Detractors | 30+ | 60+ |
| CSAT | Satisfied / Total Responses x 100 | 90%+ | 95%+ |
| LTV:CAC | CLV / CAC | 3:1 | >4:1 |
| CAC Payback | Months to recover CAC | 15-18 mo | <12 mo |
| Expansion % | Expansion ARR / Total New ARR | ~40% | >50% |
Sources: SaaS Capital (NRR/GRR benchmarks), Bain & Company (retention economics), Gainsight and ChurnZero (health-score adoption/cadence).
Expansion revenue starts with reaching the right decision-makers inside existing accounts. Prospeo's 300M+ profiles and 30+ filters - including department headcount growth and buyer intent - help AMs identify upsell champions before QBR season. 98% email accuracy means your outreach actually lands.
Stop guessing which contacts matter. Start enriching your accounts with verified data.
Tier Your Accounts, Then Choose KPIs
A 95% overall retention rate sounds great until you realize your top 10 strategic accounts are retaining at 82%. Averages hide the problems that matter most.
| Tier | Accounts | KPI Depth | Focus |
|---|---|---|---|
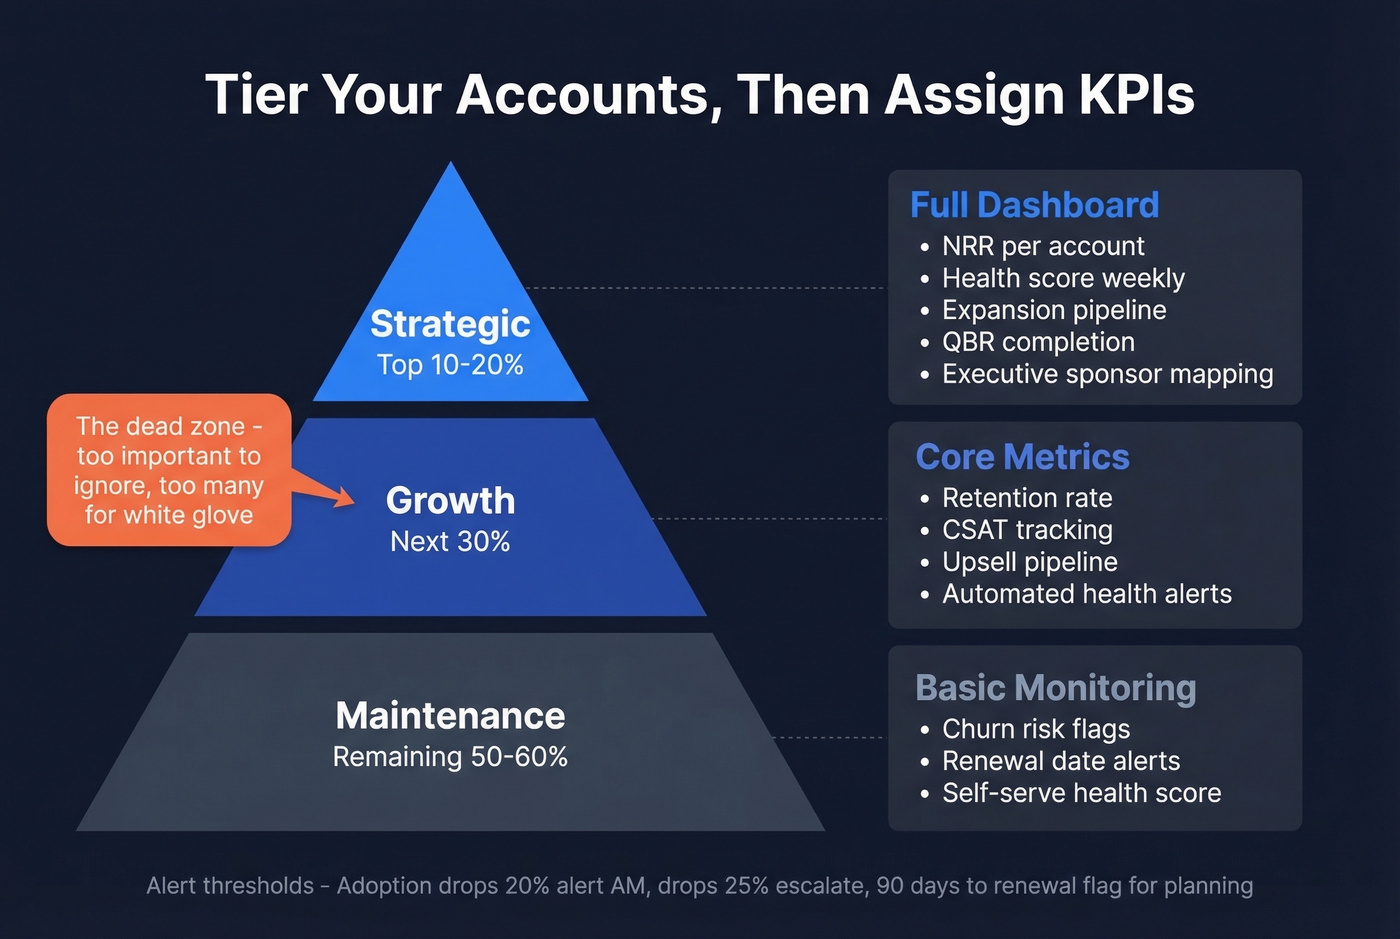
| Strategic (top 10-20%) | Highest revenue | Full dashboard | NRR, health, expansion, QBRs |
| Growth (next 30%) | Mid-tier | Core metrics | Retention, CSAT, upsell pipeline |
| Maintenance (remaining) | Long tail | Basic monitoring | Churn risk, renewal dates |
We've found that the accounts that churn hardest are the mid-tier ones nobody's watching closely. Strategic accounts get executive attention. The long tail is expected to self-serve. But growth-tier accounts sit in a dead zone - too important to ignore, too numerous for white-glove treatment. That's where automated health scoring earns its keep.
Set alert thresholds that trigger action: product adoption drops 20% month-over-month, alert the AM. Usage drops 25%, escalate to management. Contract expiring within 90 days, flag for renewal planning. These aren't suggestions. They're the difference between proactive account management and reactive damage control.
For teams where deals average under $10K, you probably don't need a full KPI dashboard per account. Automate health scoring, set churn alerts, and let your AMs spend their time on the 20% of accounts that drive 80% of revenue. Overinstrumenting small accounts is a productivity trap disguised as diligence.
Five KPI Mistakes That Wreck Results
1. Too many KPIs. If your AMs are tracking 15 metrics, they're acting on none of them. Cap it at five per role. Everything else is a supporting metric, not a KPI.
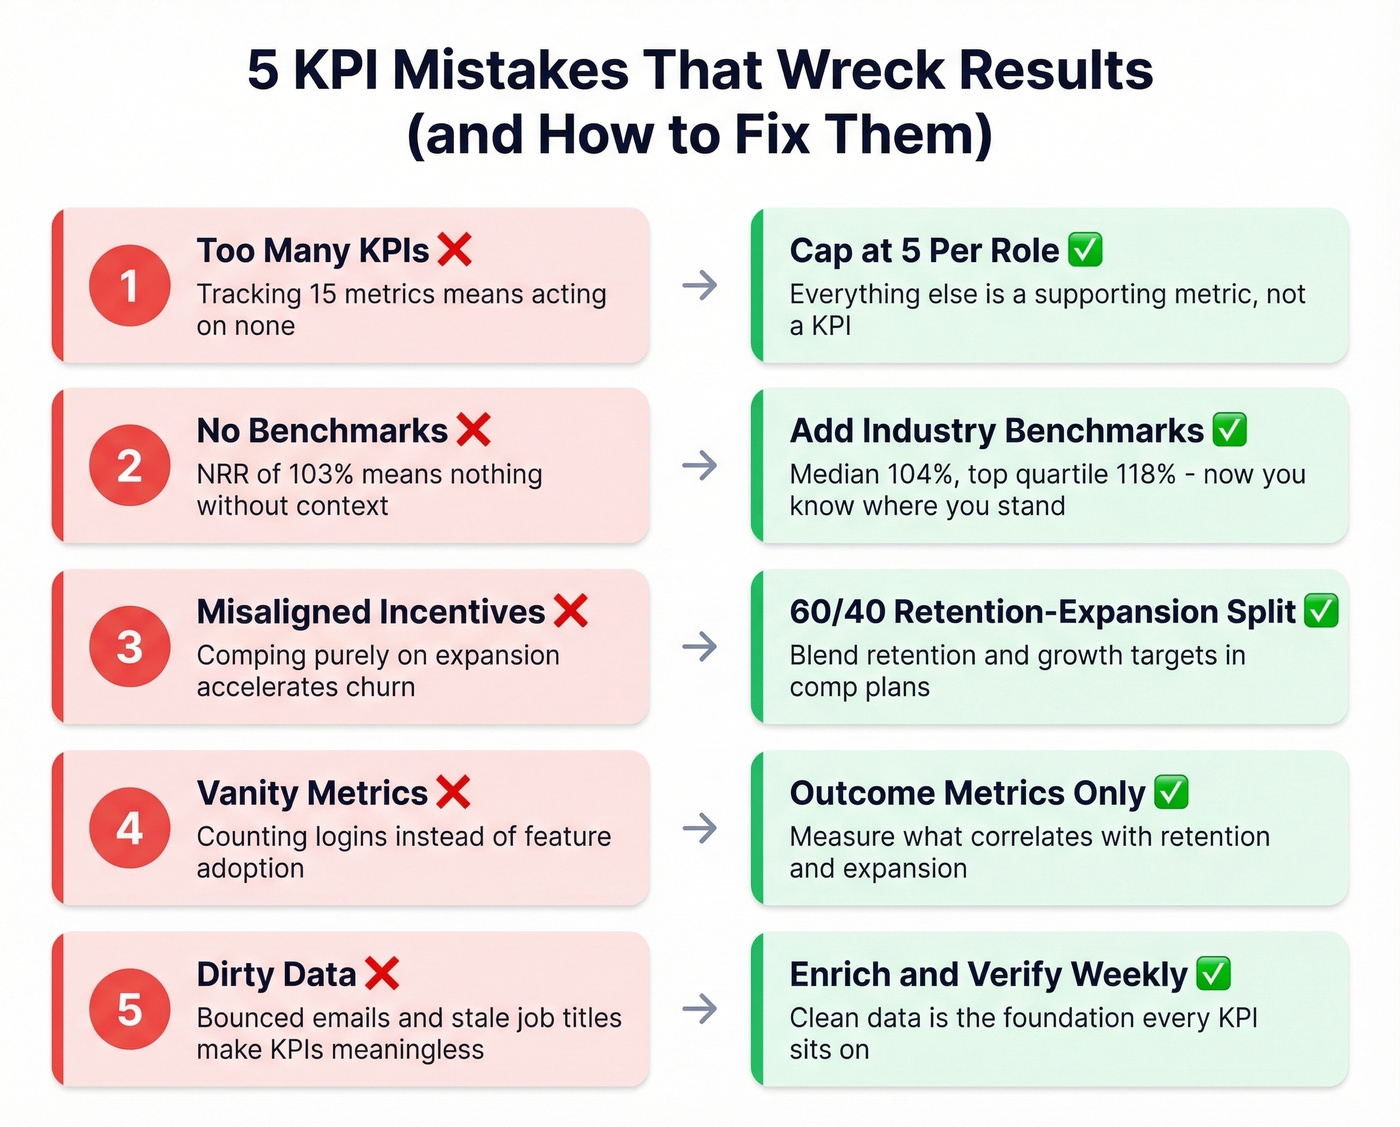
2. No benchmarks. A KPI without a benchmark is just a number. "Our NRR is 103%" means nothing until you know the median is 104% and top quartile is 118%. Context creates urgency.
3. Misaligned incentives. This one comes up constantly in practitioner communities - the consensus on r/msp is that too much emphasis on sales hurts CX, and too much emphasis on experience loses sales. If your AMs are comped purely on expansion, they'll push upsells into accounts that aren't ready and accelerate churn. The best comp plans blend retention and expansion targets at roughly a 60/40 split.
4. Vanity metrics. Tracking logins instead of feature adoption. Counting emails sent instead of replies received. Vanity metrics feel productive but don't predict outcomes. Measure what correlates with retention and expansion, not what's easy to pull from a dashboard.
5. Dirty data. Look, most companies are data rich and insight poor. If a third of your contact records have bounced emails or stale job titles, your interaction KPIs are meaningless - you're measuring engagement with ghosts. Tools like Prospeo can enrich and verify CRM contacts in bulk, with 98% email accuracy, a 92% match rate, and data refreshed every 7 days. If you're evaluating options, compare data enrichment services before you commit. Clean data isn't a nice-to-have. It's the foundation every other KPI sits on.
How to Operationalize Your KPIs
Picking the right account management KPIs is half the battle. The other half is building a system that keeps them visible and actionable.
Dashboard structure matters. Role-based views prevent information overload. AMs see engagement metrics and expansion pipeline. Executives see portfolio health and revenue trends. Nobody needs to see everything.
Set a cadence and stick to it. Weekly health score updates. Monthly KPI reviews. Quarterly QBRs with strategic accounts. The cadence creates accountability - without it, KPIs become a quarterly panic exercise instead of a management system. If you're formalizing the process, align on QBR meaning and when to use QBR vs EBR.
Data quality is the prerequisite nobody wants to talk about. Your KPIs are only as reliable as the data feeding them. Integrate your CRM, customer success platform, support desk, product analytics, and billing system into a single view. Then verify the contact data underneath it all. If you're rebuilding your stack, start with contact management software and a clear examples of a CRM shortlist.
In our experience, we've seen teams build beautiful dashboards on top of CRMs where 30% of the email addresses bounce. The dashboard looks great. The insights are fiction. If you're going to invest in KPI infrastructure, start by auditing the data layer first - otherwise you're building on sand.
Tracking account health scores is useless if your CRM contacts are outdated. Prospeo refreshes data every 7 days - not every 6 weeks - so your account intelligence stays current. Enrich your entire book of business and get 50+ data points per contact at $0.01 per email.
Fresh contact data is the retention KPI nobody tracks but everyone needs.
FAQ
What's the difference between NRR and GRR?
NRR includes expansion revenue - upsells, cross-sells, and price increases - so it can exceed 100%. GRR excludes expansion and caps at 100%. Track both: NRR shows whether you're growing inside the base, GRR reveals how much revenue you're losing to churn alone.
How many KPIs should an account manager track?
Five core KPIs maximum per role. More than that and nobody acts on any of them. Pick the five most aligned with your business model - typically NRR, health score, churn, NPS, and expansion revenue. Everything else is a supporting metric that feeds into those five.
What account planning KPIs matter most?
NRR, expansion revenue percentage, and health score drive the biggest impact because they connect directly to strategic goals set during the planning process. If your account plans don't map to measurable outcomes, they're just slide decks.
How do I make sure my KPI data is accurate?
Start with CRM hygiene - audit contact records for bounced emails, disconnected numbers, and stale job titles. Fix the foundation before you trust the dashboard. Automated enrichment tools can help keep records current without manual effort, but the first step is always an honest audit of what you've got.