ACV vs TCV: The Practitioner's Guide to Getting It Right
The CFO pulls up the board deck and sees $4.2M in ACV. Then she opens the ARR waterfall - it shows $3.8M. The $400K gap? Sales included one-time implementation fees in their ACV numbers. Now the board is asking questions, finance is scrambling, and the VP of Sales is explaining why "our definition is different."
This is what happens when ACV and TCV definitions aren't governed properly. It's not a math problem - it's an alignment problem.
Quick Version
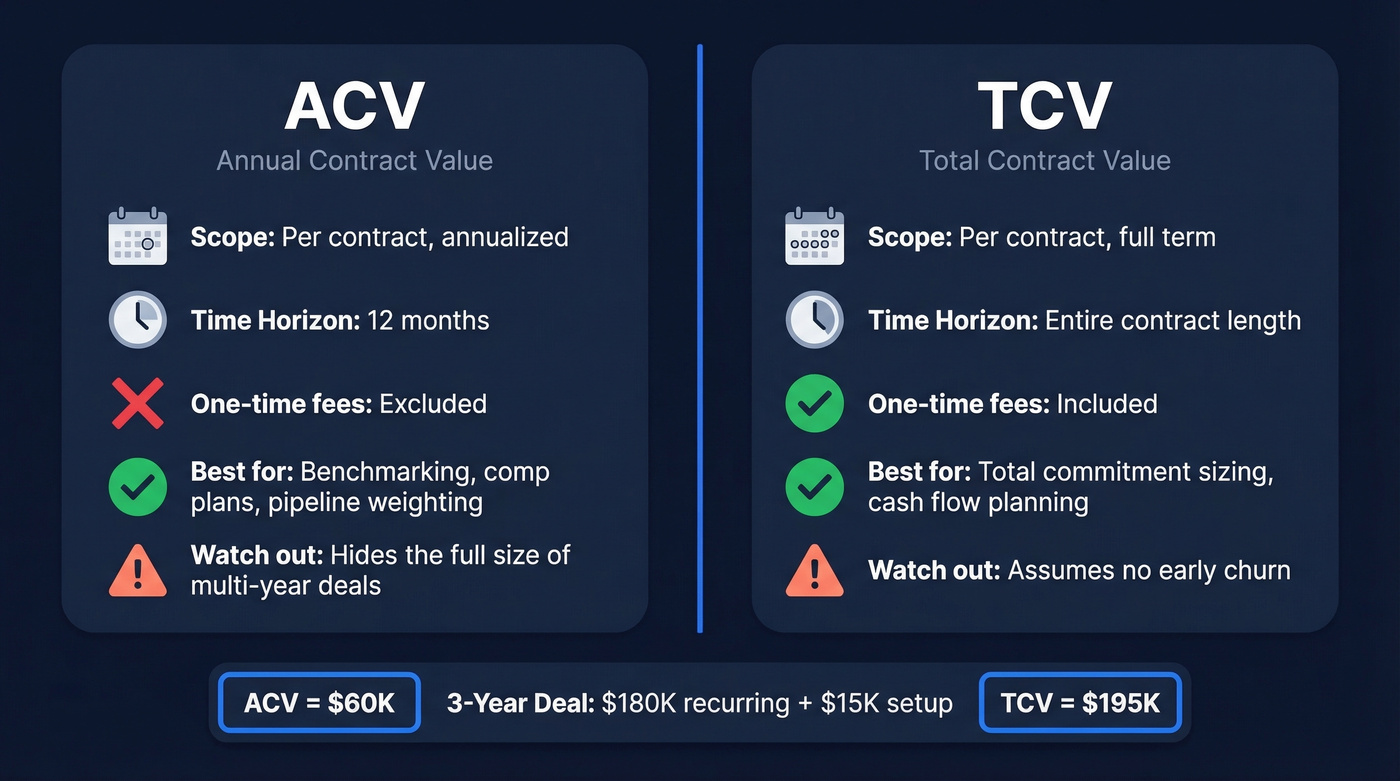
- ACV (Annual Contract Value): The annualized recurring value of a single contract. Excludes one-time fees.
- TCV (Total Contract Value): Every dollar over the full contract term - recurring, one-time, and variable fees included.
- Use ACV for annual benchmarking, comp plans, and pipeline weighting.
- Use TCV for total commitment sizing, cash flow planning, and procurement negotiations.
- The key difference: One-time fees. ACV strips them out; TCV includes them.
Most guides stop here. Keep reading for the benchmarks, edge cases, and governance rules that actually matter.
ACV and TCV Defined
What Is ACV?
ACV answers one question: how much recurring revenue does a single customer contract generate per year? You calculate it by dividing the total recurring value by the number of contract years.
Take a 3-year contract worth $180K in recurring fees. ACV = $180K / 3 = $60K. That $15K implementation fee the customer paid at signing? It doesn't touch ACV. Companies typically exclude one-time charges - setup, onboarding, professional services - because they inflate the first year without reflecting ongoing revenue. ACV isn't a standardized accounting metric, and definitions vary by business. What matters is consistency: pick a definition and enforce it everywhere.
What Is TCV?
TCV captures the complete financial commitment of a contract. The formula: TCV = (Recurring Revenue per Period x Number of Periods) + One-Time Fees + Estimated Variable Fees.
Same 3-year deal: $180K recurring + $15K setup = $195K TCV. If there's a $5K annual overage estimate baked in, TCV becomes $210K.
TCV assumes full contract execution. If the customer churns at month 18, you don't collect the full TCV - it's a commitment metric, not a guarantee. That distinction matters for cash flow projections because TCV represents the ceiling, not the floor. And don't confuse TCV with LTV: TCV measures what a single contract is worth, while LTV measures what a customer relationship is worth across all contracts and renewals, a broader and probabilistic metric.
ACV vs TCV: Side-by-Side Comparison
| Dimension | ACV | TCV |
|---|---|---|
| Scope | Per contract, annualized | Per contract, full term |
| Time horizon | 12 months | Full contract length |
| One-time fees | Excluded | Included |
| Best use case | Benchmarking, comp plans | Total commitment, cash flow |
| Key limitation | Hides full commitment | Assumes no churn |
The limitation row is where teams get burned. ACV makes a 5-year whale deal look modest. TCV makes a 1-year deal look like a massive commitment. Neither tells the whole story alone - and over time, cohort-level ACV can decline as higher-value short-term contracts roll off, leaving a remaining base with lower annual values. Watch for that pattern in your renewal data.
Where These Metrics Fit in the SaaS Stack
MRR, ARR, ACV, TCV, CARR
| Metric | Definition | Scope | Excludes |
|---|---|---|---|
| MRR | Monthly recurring revenue | Business-wide | One-time fees |
| ARR | MRR x 12 | Business-wide | One-time fees |
| ACV | Annual value per contract | Per contract | One-time fees |
| TCV | Total value per contract | Per contract | Nothing - includes one-time and estimated variable fees |
| CARR | Contracted but not yet live | Business-wide | One-time fees |
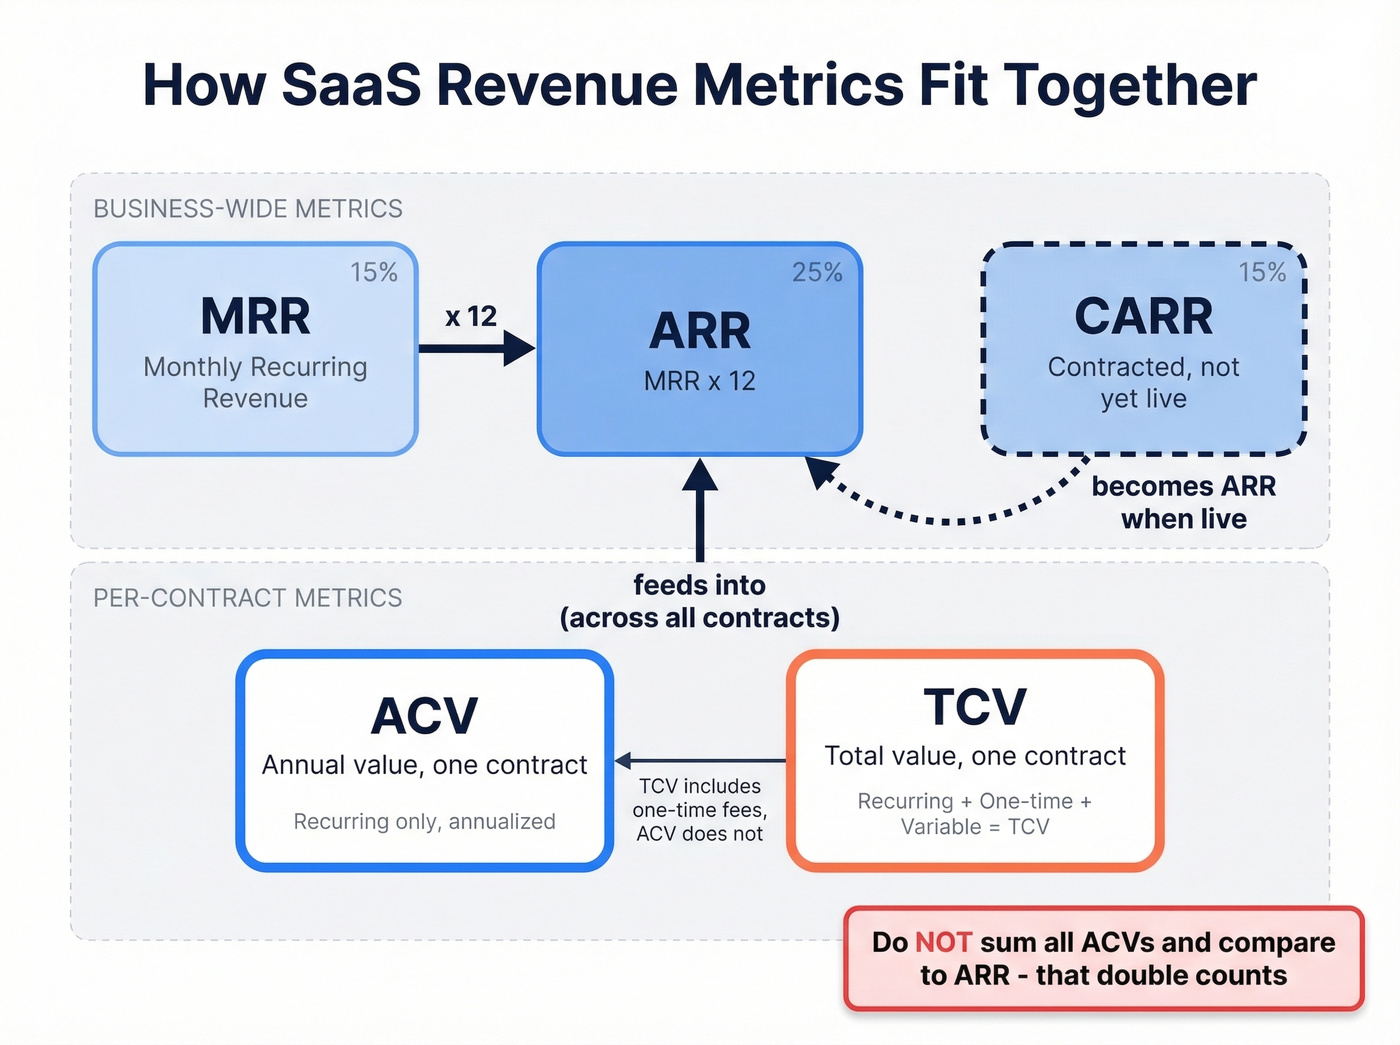
Each metric nests into the next. MRR feeds ARR. ACV measures individual deal size. TCV measures total deal commitment. CARR captures the gap between signed and live.
ACV Isn't ARR - Stop Mixing Them
Here's the thing: ACV is per-contract. ARR is business-level. They measure different things at different scopes, and putting them on the same chart causes misinterpretation.
Don't add ACV totals to ARR. That double counts. If you sum up all your ACVs and compare that number to ARR, you'll overstate revenue because ARR already captures the recurring value across all contracts. This is one of the most common reporting errors in SaaS finance. Treat ACV as a deal-sizing tool. Treat ARR as a business-health metric. Keep them on separate dashboards.
Your ACV benchmarks only matter if your pipeline is real. Bad contact data inflates deal counts, distorts average contract values, and makes your board deck a fiction. Prospeo delivers 98% verified emails and 125M+ direct dials - so every deal in your pipeline maps to an actual buyer.
Clean pipeline data starts at $0.01 per verified email.
ACV Benchmarks for 2026
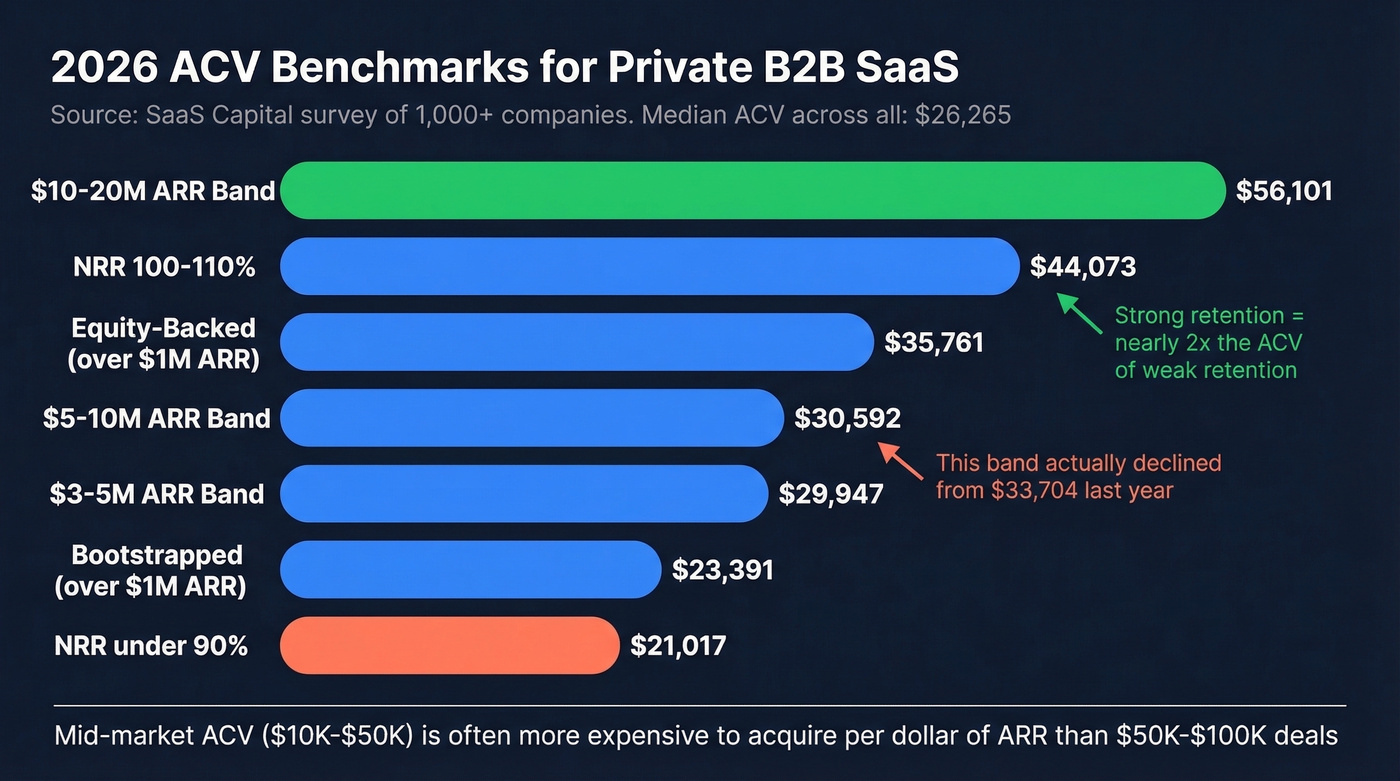
The SaaS Capital survey of 1,000+ private B2B SaaS companies gives us the best available benchmark data. Median ACV across all respondents: $26,265, up from $22,357 the prior year.
The segmentation is where it gets interesting:
| Segment | Median ACV |
|---|---|
| $3-5M ARR band | $29,947 |
| $5-10M ARR band | $30,592 |
| $10-20M ARR band | $56,101 |
| NRR < 90% | $21,017 |
| NRR 100-110% | $44,073 |
| Bootstrapped (>$1M ARR) | $23,391 |
| Equity-backed (>$1M ARR) | $35,761 |
Two things jump out. Companies with strong net retention (100-110% NRR) carry nearly double the ACV of those with sub-90% NRR. Higher ACV correlates with stickier customers - or stickier customers justify higher pricing. Probably both.
The $5-10M ARR band actually declined from $33,704 the prior year, bucking the overall upward trend. That anomaly deserves attention if you're in that range.
In our experience, the mid-market ACV band creates the most painful unit economics. Benchmarkit's data confirms it: the $10K-$50K range is often more expensive to acquire per dollar of ARR than the $50K-$100K range. The median new customer CAC ratio sits at $2.00 in S&M spend per $1.00 of new ARR. If you're in that mid-market band and your CAC ratio is creeping past $2.80, you've got a unit economics problem worth investigating. (If you need a refresher on CAC math and interpretation, see our guide to cost to acquire customer.)
Hot take: If your average deal size sits under $15K and you're running outbound, you probably can't afford a full-cycle AE model. The math just doesn't work. Either move upmarket, automate the top of funnel with better sales prospecting techniques, or accept that inbound has to carry the load.
Edge Cases That Break Simple Formulas
Ramp Deals
Revenue starts small and scales - common in API-based and usage-heavy contracts. A deal might generate $20K in year one and $80K in year three. What's the ACV? Depends on your comp philosophy.
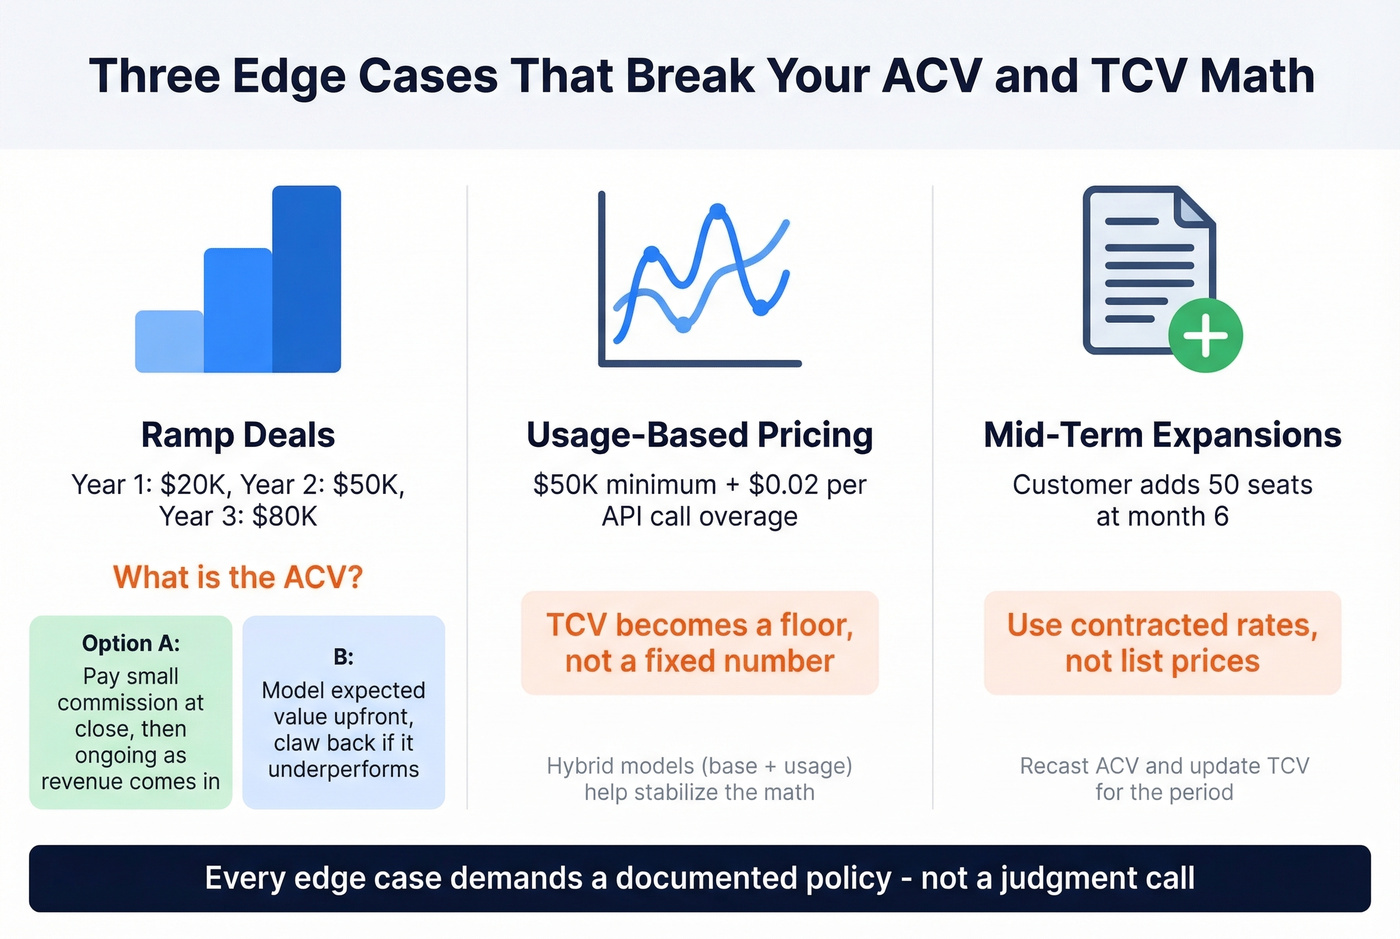
Two approaches dominate. First, pay a small commission at close, then ongoing commissions for up to 12 months as revenue materializes. Second, model the expected value upfront, pay a chunk at signing, and claw back if the deal underperforms. The second approach works better once you've got enough customers to model ramp behavior reliably, but it requires trust between sales and finance that many orgs haven't built yet. (This is also where tighter sales performance management prevents comp disputes.)
Usage-Based Pricing
Consumption metering, minimum commitments, overages, and prepaid balances make ACV and TCV inherently uncertain. If a customer's contract says "$50K minimum with $0.02/API call overage," your TCV is a floor, not a number. Hybrid models - a recurring base plus usage - help stabilize the math, but you're still forecasting variable components. For forecasting workflows and tooling, see sales forecasting solutions.
Mid-Term Expansions and Discounts
When a customer adds seats or upgrades mid-contract, you need to update TCV and recast ACV for that reporting period. We've seen teams get this wrong by using list prices instead of contracted rates - a common mistake that inflates both metrics. If you negotiated a 20% discount, your ACV should reflect the discounted price, not the sticker. This is also why strong pipeline health reporting needs clean contract data, not just stage updates.
How These Metrics Shape Sales Comp
Let's be honest: comp plan design is where the ACV-versus-TCV confusion causes the most damage.
A thread in r/sales lays out a common scenario. Rep closes a 4-year deal: $50K annual license with annual uplift, plus $50K in services. The org credits quota on year-1 software ARR only - roughly $50K. The TCV is closer to $250K. The rep sees a fraction of the deal's value in their comp.
The behavioral distortion is predictable. Reps start stuffing services revenue into the license line to inflate their year-1 ARR credit. The services team hates it. Finance hates it. But the comp plan created the incentive. A common commission structure runs around 10% of ACV, with OTE ranging from $60K-$80K for SDRs up to $150K+ for enterprise AEs - and only 21% of companies report being satisfied with their comp plans. That number tells you everything. (Related: how teams define and benchmark OTE in sales.)
Bookings Aren't Revenue
ACV and TCV are bookings constructs, not GAAP revenue. Under revenue recognition rules, a $120K annual contract doesn't hit the P&L as $120K on signing day - it's recognized at $10K/month as performance obligations are satisfied.
This creates two concepts that trip people up. Deferred revenue is cash you've billed but can't recognize yet - it sits on the balance sheet as a liability. Unbilled revenue is revenue you've recognized but haven't billed yet - it's an asset/receivable.
The tension plays out in forecasting. A SalesOps thread on Reddit captures it well: the company tracks pipeline using an accrual model where reps get credit when finance recognizes revenue, not when deals are booked. Finance loves the accuracy. Sales hates the complexity. Pipeline values shift across months based on delivery dates. The fix isn't choosing one over the other - it's running both views and being explicit about which one you're showing in any given meeting. If you’re aligning targets to projections, it helps to separate sales forecast vs sales goal.
Common Mistakes and Governance
Five mistakes we see repeatedly:
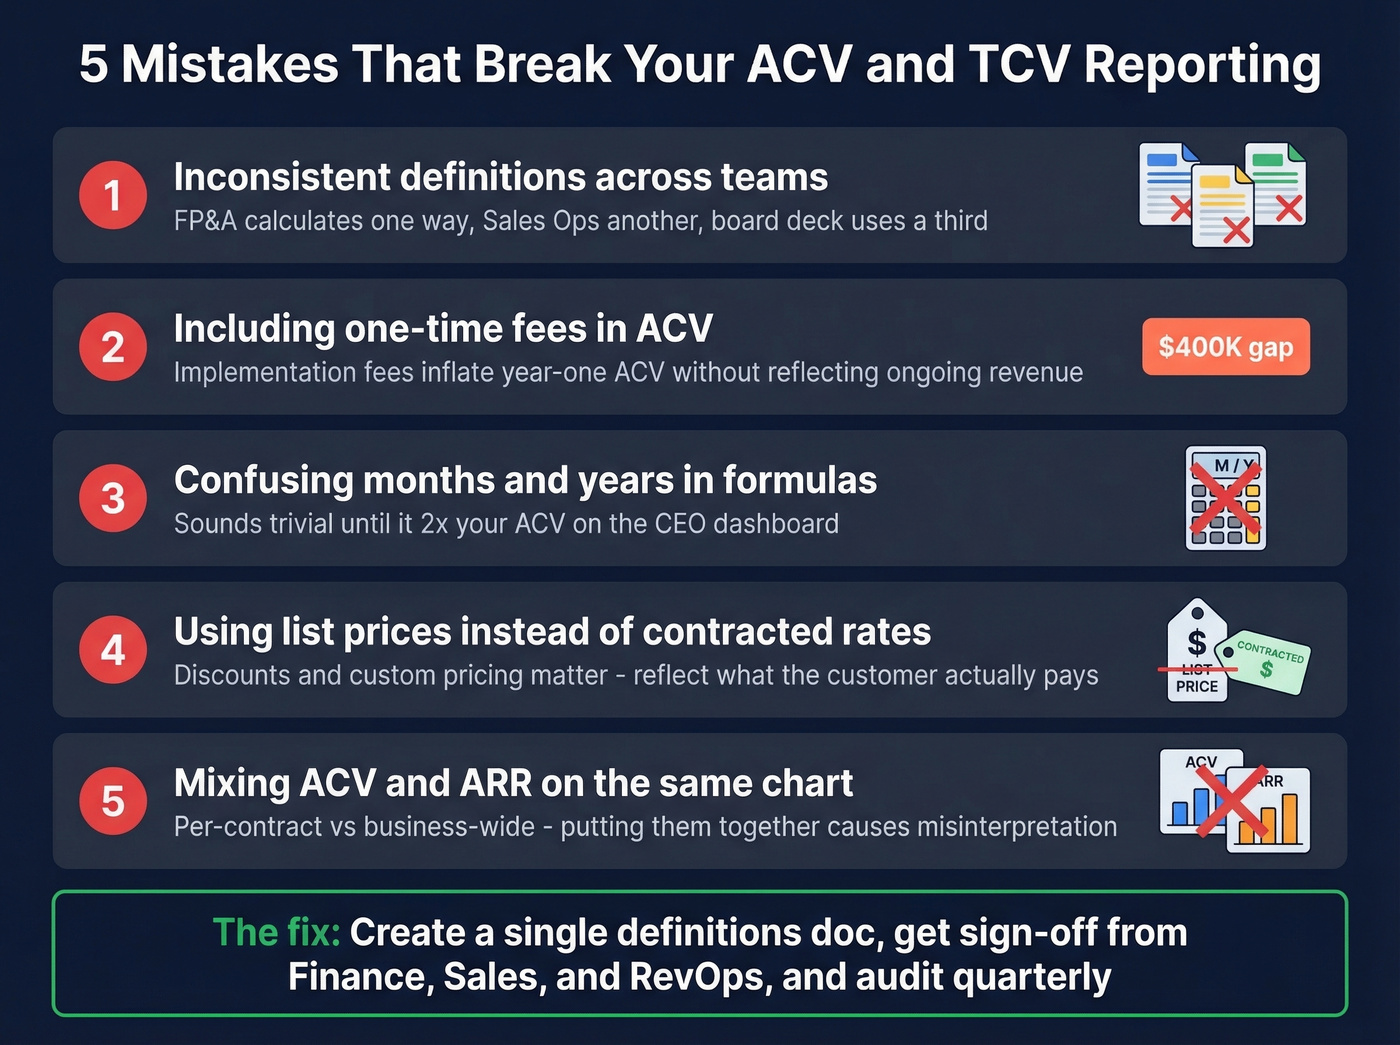
Inconsistent definitions across teams. FP&A calculates ACV one way, sales ops another, and the board deck uses a third. A practitioner on r/FPandA asked whether TCV definitions "depend on the company/accountant." The answer is yes - which is exactly the problem.
Including one-time fees in ACV. This is the $400K board deck gap from the intro. Implementation fees inflate year-one ACV without reflecting ongoing revenue.
Misreading contract duration. Confusing months and years in your formulas sounds trivial until it 2x's your ACV on a dashboard the CEO reviews weekly.
Using list prices instead of contracted rates. Discounts and custom pricing matter. Your ACV should reflect what the customer actually pays.
Mixing ACV and ARR on the same chart. Per-contract and business-level metrics don't belong on the same axis. Period.
The fix: define ACV and ARR once, publish the definitions in a RevOps handbook, recast ACV at every renewal, and use weighted ACV (stage probability x deal ACV) for pipeline forecasting. That last point - weighted pipeline ACV - is only as reliable as the underlying CRM data. If contact records are stale, emails bounce, and phone numbers are disconnected, your pipeline is built on fiction. Tools like Prospeo that refresh CRM records on a 7-day cycle help keep the data layer clean so pipeline metrics reflect reality rather than decay. (If you’re evaluating vendors, start with data enrichment services and best contact management software.)

Mid-market ACV with a $2.80+ CAC ratio? Your unit economics problem isn't pricing - it's prospecting efficiency. Teams using Prospeo book 26% more meetings than ZoomInfo users and cut list-building from 15 hours to under 3 hours per week.
Fix your CAC ratio by reaching real decision-makers on the first attempt.
FAQ
What's the difference between ACV and TCV?
ACV is the annualized recurring value of a single contract, excluding one-time fees. TCV is the total financial commitment across the full contract term, including setup fees, professional services, and estimated variable charges. A 3-year deal at $60K/year with a $15K setup fee has an ACV of $60K and a TCV of $195K.
Does ACV include one-time fees?
No. Most companies exclude one-time fees from ACV because they inflate the first year without reflecting ongoing revenue. TCV includes them. Document your definition in a RevOps handbook and enforce it across every dashboard and board deck. Mixing approaches across teams is how you get the $400K reconciliation gap.
Can ACV be higher than TCV?
ACV is always less than or equal to TCV. TCV covers the full contract term and includes one-time fees, so it's the larger number in every multi-year or fee-bearing deal. The only scenario where they're equal is a 1-year contract with zero one-time fees.
How do I keep contract value metrics consistent across teams?
Document definitions in a RevOps handbook, enforce them in your CRM's calculated fields, and audit dashboards quarterly. The biggest risk isn't bad math - it's different teams using different math. Keeping your underlying contact data accurate with regular refresh cycles ensures pipeline ACV calculations aren't built on stale records that inflate deal counts.