Average Open Rates for Email Marketing: 2026 Benchmarks
Ask five ESPs for the average open rates for email marketing and you'll get six different numbers. Klaviyo says 31%. MailerLite says 43.46%. HubSpot says 42.35%. A beehiiv user with ~6,000 subscribers on r/Emailmarketing watched their rate plummet from 35% to 18% overnight - their ESP blamed content quality. None of these numbers are wrong. They're measuring different things in different ways, and roughly half the "opens" they're counting aren't real.
2026 Benchmarks by ESP
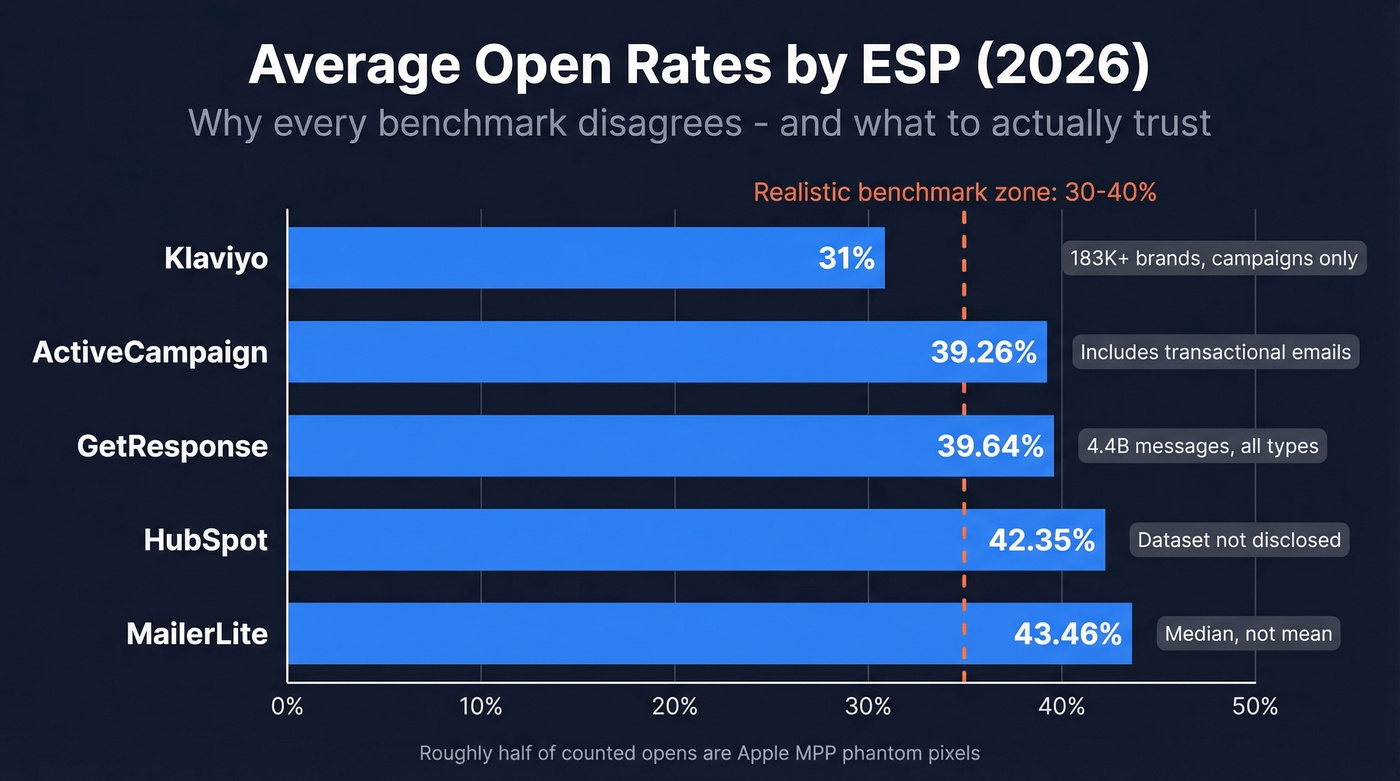
Here are the numbers everyone came here for. Then we'll explain why they disagree.
| ESP | Open Rate | Dataset | Method | Email Types |
|---|---|---|---|---|
| Klaviyo | 31% | 183K+ brands | Mean | Campaigns only |
| ActiveCampaign | 39.26% | Sends Jan 1 - Dec 10, 2025 | Mean | Mixed (incl. transactional) |
| GetResponse | 39.64% | 4.4B messages | Mean | All types |
| HubSpot | 42.35% | Not disclosed | - | Marketing |
| MailerLite | 43.46% | 3.6M campaigns | Median | Campaigns |
If you want a single number, benchmark against 30-40% for marketing emails. But your own trend line matters more than any industry average - and roughly half the "opens" you're seeing are phantom pixels fired by Apple's privacy system. For aspirational context, Klaviyo's top 10% of campaigns hit 45.1% opens and 3.38% click rates. If you're above those numbers, you're outperforming nearly everyone.
Why Every Benchmark Disagrees
Five factors explain the ~12.5-point gap between the lowest and highest figures.
Dataset composition. Klaviyo skews ecommerce-heavy with 183,000+ brands. MailerLite and ActiveCampaign index toward SMBs with smaller lists. Smaller lists typically produce higher open rates, which is why benchmarks vary so widely from platform to platform.
Mean vs. median. MailerLite uses the median - the midpoint where half of campaigns fall above and half below. Most others use the mean, which gets dragged down by high-volume senders blasting massive lists. That single methodological choice accounts for several percentage points of difference.
Email types included. ActiveCampaign's 6.21% click rate looks suspiciously high until you realize they're mixing transactional, marketing, and other campaign types. Order confirmations and password resets get opened at much higher rates and pull the average up.
Industry mix. A platform heavy on nonprofits and education will report higher opens than one dominated by ecommerce and SaaS. Nonprofits routinely hit 42-52%; ecommerce sits closer to 30-35%.
MPP handling and Gmail's one-click unsubscribe UX. Some platforms attempt to filter Apple Privacy opens; others don't. That alone can swing the number 10+ points. Gmail's one-click unsubscribe also plays a role - it makes leaving a list frictionless, which removes disengaged subscribers faster and lifts open rates for whoever's left.
The Apple MPP Effect
Here's the thing: underlying engagement hasn't improved over the past few years. Apple Mail Privacy Protection just made opens look better.
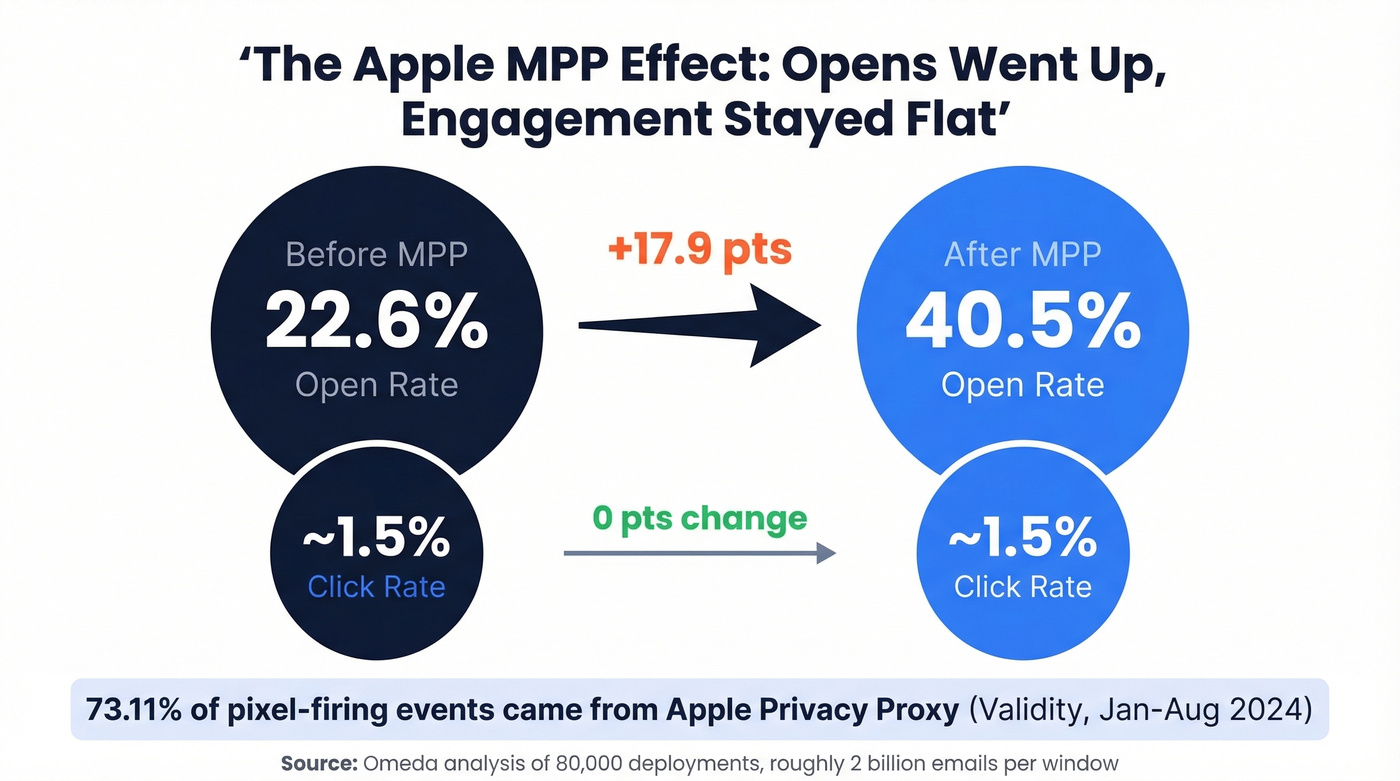
Omeda ran one of the cleanest before/after analyses - 80,000 deployments, roughly 2 billion emails in each window. Total open rates jumped from 22.6% to 40.5%, a gain of 17.9 points. Click rates? Flat at ~1.5%. That gap is pure inflation.
The mechanism is simple. Apple Mail pre-fetches tracking pixels on behalf of users, registering an "open" whether or not anyone read the email. Apple's Privacy Proxy accounted for 73.11% of pixel-firing events in Validity's Jan-Aug 2024 dataset. This is why any open rate statistics you encounter today need heavy context - the number on your dashboard and the number of humans who actually read your email are two very different things.
Then Apple changed the prefetch timing in April 2024, and a temporary outage hit July 25-28. That beehiiv user on r/Emailmarketing - the one whose opens fell from 35% to 18% - was caught in this shift. Their ESP blamed content quality. It was infrastructure. We've seen teams panic over drops like this constantly, and nine times out of ten the answer is the same.
Open Rates by Industry
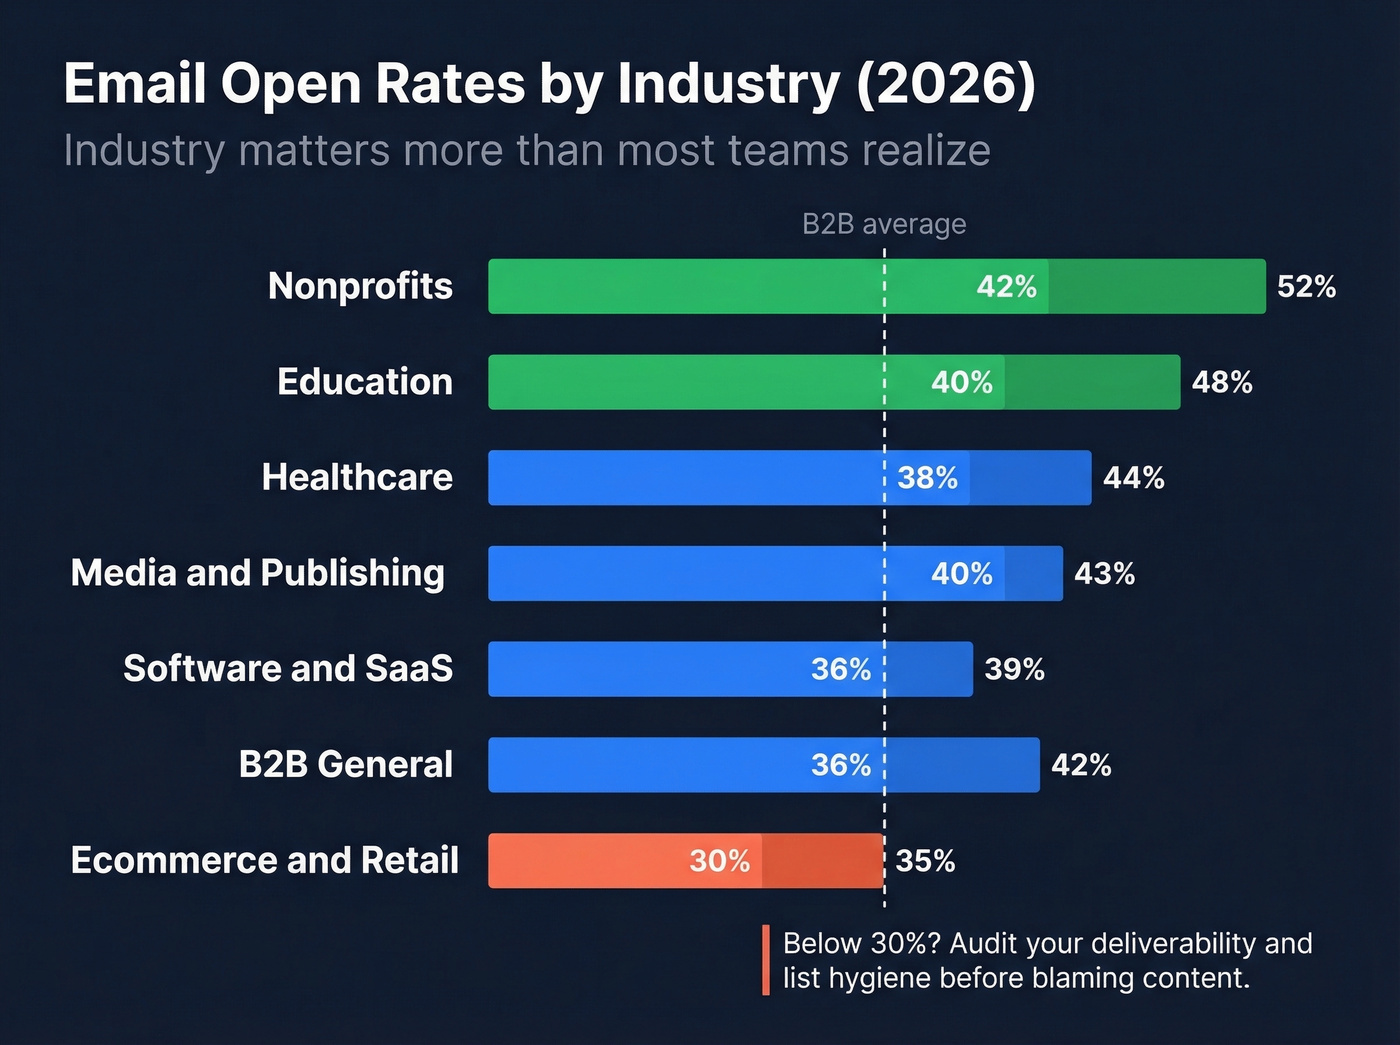
Industry matters more than most teams realize.
| Industry | Open Rate Range | Sources |
|---|---|---|
| Nonprofits | 42-52% | AC, MailerLite, Klaviyo |
| Education | 40-48% | AC, GetResponse |
| Healthcare | 38-44% | AC, GetResponse |
| Media/Publishing | 40-43% | AC, GetResponse |
| Software/SaaS | 36-39% | AC, MailerLite |
| B2B (general) | 36-42% | Aggregated |
| Ecommerce/Retail | 30-35% | Klaviyo, AC, MailerLite |
B2B email sits in the 36-42% range depending on list size, send frequency, and how aggressively you sunset unengaged contacts. If you're below 30%, something's wrong with your list or your deliverability - not necessarily your content. Skip the subject-line A/B tests and audit your infrastructure first (start with an email deliverability check).
Half your "opens" are Apple bots. The metric you can trust? Bounce rate - and that starts with your data. Prospeo's 5-step email verification delivers 98% accuracy, keeping bounce rates under 4% so your deliverability stays intact.
Stop obsessing over phantom opens. Start sending to emails that exist.
By Email Type and Region
Not all emails are created equal. Welcome emails dominate at 83.63% open rates, triggered and automated messages land around 45.38%, and newsletters average 40.08%. The pattern holds across platforms: automated flows generate a 5.58% click rate - more than 3x the campaign click rate of 1.69%.
If you're not investing in automation, you're leaving the highest-engagement channel on the table.
Geography matters too, though the numbers reflect Apple device penetration as much as actual engagement:
| Region | Open Rate |
|---|---|
| Oceania | 55.66% |
| North America | 45.30% |
| Europe | 43.25% |
| Asia | 28.04% |
Higher Apple device adoption in Oceania and North America means more MPP inflation baked into those figures. Asia's lower number isn't necessarily worse engagement - it's less privacy-proxy noise.
Beyond Opens: CTR and CTOR
If open rates are compromised by privacy proxies, what should you actually track?
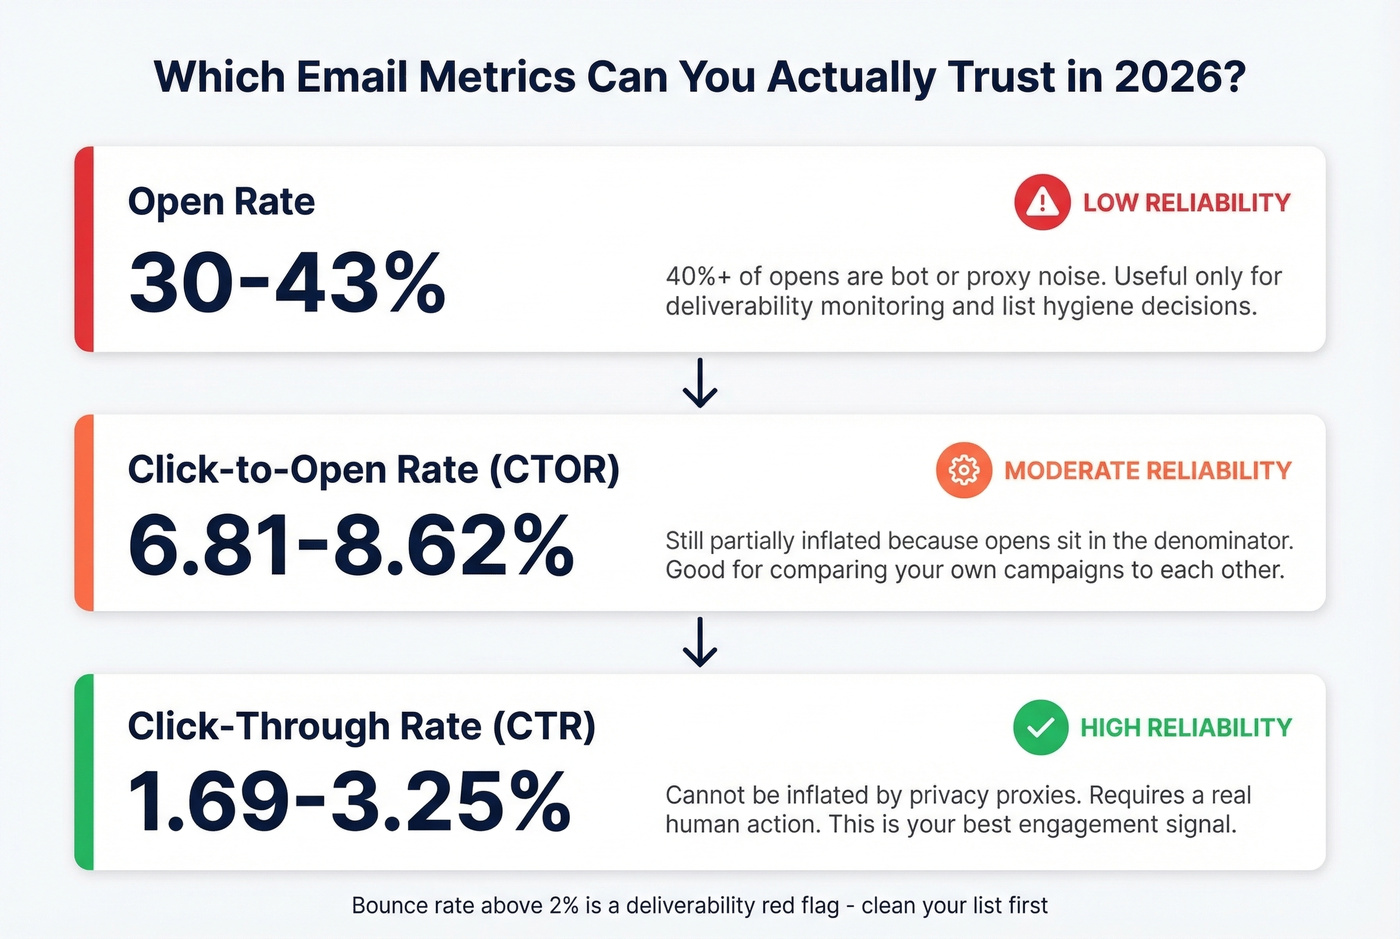
Click-through rate. It can't be inflated by privacy proxies, making it the most reliable engagement signal available. Klaviyo's average campaign CTR is 1.69%, while GetResponse reports 3.25% across its broader mix of email types. The spread is far smaller than open rates because clicks require a real human action - no bot can fake that. (If you want the math, use the click rate formula.)
Click-to-open rate - clicks divided by opens - is theoretically more useful but still partially inflated because opens sit in the denominator. Reported CTOR ranges from 6.81% to 8.62% across major ESPs. Use CTOR for relative comparisons between your own campaigns, not as an absolute benchmark. GetResponse reports a 2.33% average bounce rate, which anchors the "above 2% is a problem" threshold you'll see referenced everywhere (see email bounce rate benchmarks and fixes).
Let's be honest: if your deal sizes are modest and you're spending hours A/B testing subject lines to move open rates, you're optimizing the wrong metric. Track clicks and conversions (and align to your funnel metrics). Open rate is at least 40% noise in 2026.
How to Improve Your Open Rate
Even as a flawed metric, open rate still reflects deliverability and subject-line performance. Here's what actually moves the needle.
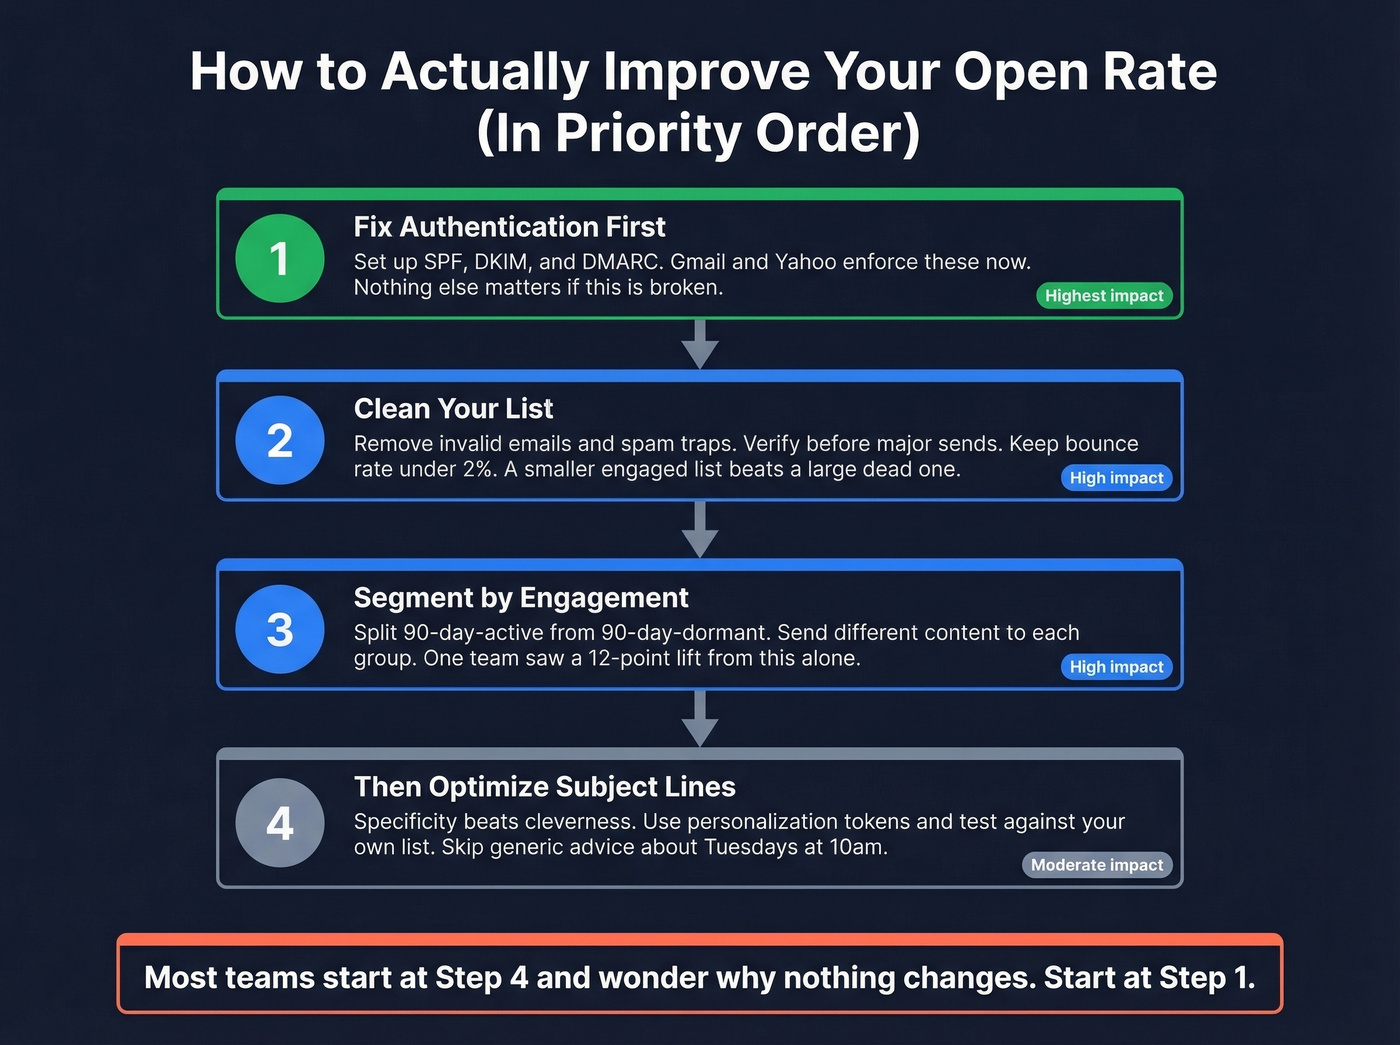
Start with authentication. SPF, DKIM, and DMARC aren't optional anymore - Gmail and Yahoo enforce them. If you haven't set these up, fix that before touching anything else. In our experience, authentication issues cause more open-rate problems than bad subject lines ever will. (If you're troubleshooting, start with how to verify DKIM is working and DMARC alignment.)
Subject lines do matter, but specificity beats cleverness. Swapping "Your Monthly Update" for "[First Name], your March results are in" typically lifts opens 5-10 points. Test length and personalization tokens against your own list rather than following generic advice about Tuesdays at 10am. If you need a swipe file, use these email subject line examples.
Segmentation is the highest-leverage change most teams ignore. Sending to everyone kills your rate. Segment by engagement recency, purchase behavior, or intent signals, and watch your numbers climb. One team we worked with saw a 12-point lift just by splitting their list into 90-day-active and 90-day-dormant segments and sending different content to each (see intent based segmentation).
List hygiene is where the biggest gains hide. Open rate equals opens divided by delivered emails. If 15% of your list is invalid, your bounce rate climbs, sender reputation drops, and Gmail routes you to spam. Verify your list before major sends - Prospeo's 5-step verification process catches spam traps and honeypots with 98% email accuracy, and the free tier covers 75 verifications per month. Finally, sunset unengaged subscribers. If someone hasn't opened or clicked in 90 days, move them to a re-engagement flow or remove them. A smaller, engaged list beats a large, dead one every time. (If you're cleaning up deliverability damage, start with spam trap removal and how to improve sender reputation.)

Reading Your Open Rate in 2026
Stop treating open rate as a primary engagement KPI. In 2023, over half of email globally was subject to MPP-style auto-opens, and that number keeps growing as more clients adopt privacy features. The 2024 benchmarking cycle was the first where most ESPs acknowledged this inflation publicly, and the 2025-2026 data hasn't reversed the trend.
Use opens for two things: list hygiene decisions - sunsetting contacts who haven't opened in 6+ months - and deliverability monitoring, where sudden drops signal inbox placement issues, not content problems. As privacy adoption grows, expect more ESPs to introduce engagement scoring models that weight clicks and conversions over opens entirely.
If your bounce rate is above 2%, that's a deliverability red flag and it'll distort every performance metric downstream. Clean your list before drawing conclusions - bad addresses corrupt everything from open rates to sender reputation.
B2B open rates sit at 36-42%, but most of that is MPP noise. What actually moves pipeline is reaching real inboxes. Prospeo refreshes 300M+ contacts every 7 days - not every 6 weeks - so your list never goes stale.
Clean data at $0.01 per email. No contracts, no inflated metrics.
FAQ
What's a good open rate for email marketing in 2026?
A good open rate for marketing campaigns falls between 30-40%, with top-performing sends exceeding 45%. Nonprofits and education skew higher (40-52%), while ecommerce typically lands at 30-35%. Compare against your own industry and track month-over-month trends rather than chasing a single universal number.
Why did my open rate drop suddenly?
Most sudden drops trace back to Apple MPP prefetch timing changes or inbox provider updates - not your content. The July 2024 MPP outage caused sharp declines across platforms. Check Validity's analysis for the technical breakdown before blaming your subject lines.
Is email open rate still a useful metric?
It's useful for spotting deliverability problems and making list hygiene decisions, but unreliable as a primary engagement KPI. Omeda measured open-rate inflation of +17.9 points as MPP adoption ramped. Focus on click rate, CTOR, and conversions for actual performance measurement.
How do I reduce bounce rate to improve open rates?
Keep bounce rate under 2% by verifying addresses before every major send. A 5-step verification process - including catch-all handling, spam-trap removal, and honeypot filtering - is the standard you should look for in any verification tool. That kind of rigor is what separates a clean list from one that quietly destroys your sender reputation.