The Only B2B Lead Generation KPIs That Actually Matter
A RevOps lead we know ran a quarterly review last month. CAC had jumped 40%, emails were bouncing at 30%+, and average lead response time sat at three days. The dashboard had 16 metrics on it. Nobody could explain which ones were broken.
That's the problem with most advice on B2B lead generation KPIs - formulas without benchmarks, definitions without context, 20 metrics when you need five. And here's the thing most guides miss entirely: 92% of B2B buyers start with at least one vendor in mind before they even begin evaluating, with an average buying cycle stretching to 10.1 months. If your KPIs only measure lead volume, you're measuring the wrong thing.
Quick Reference
| KPI | What It Tells You | Benchmark |
|---|---|---|
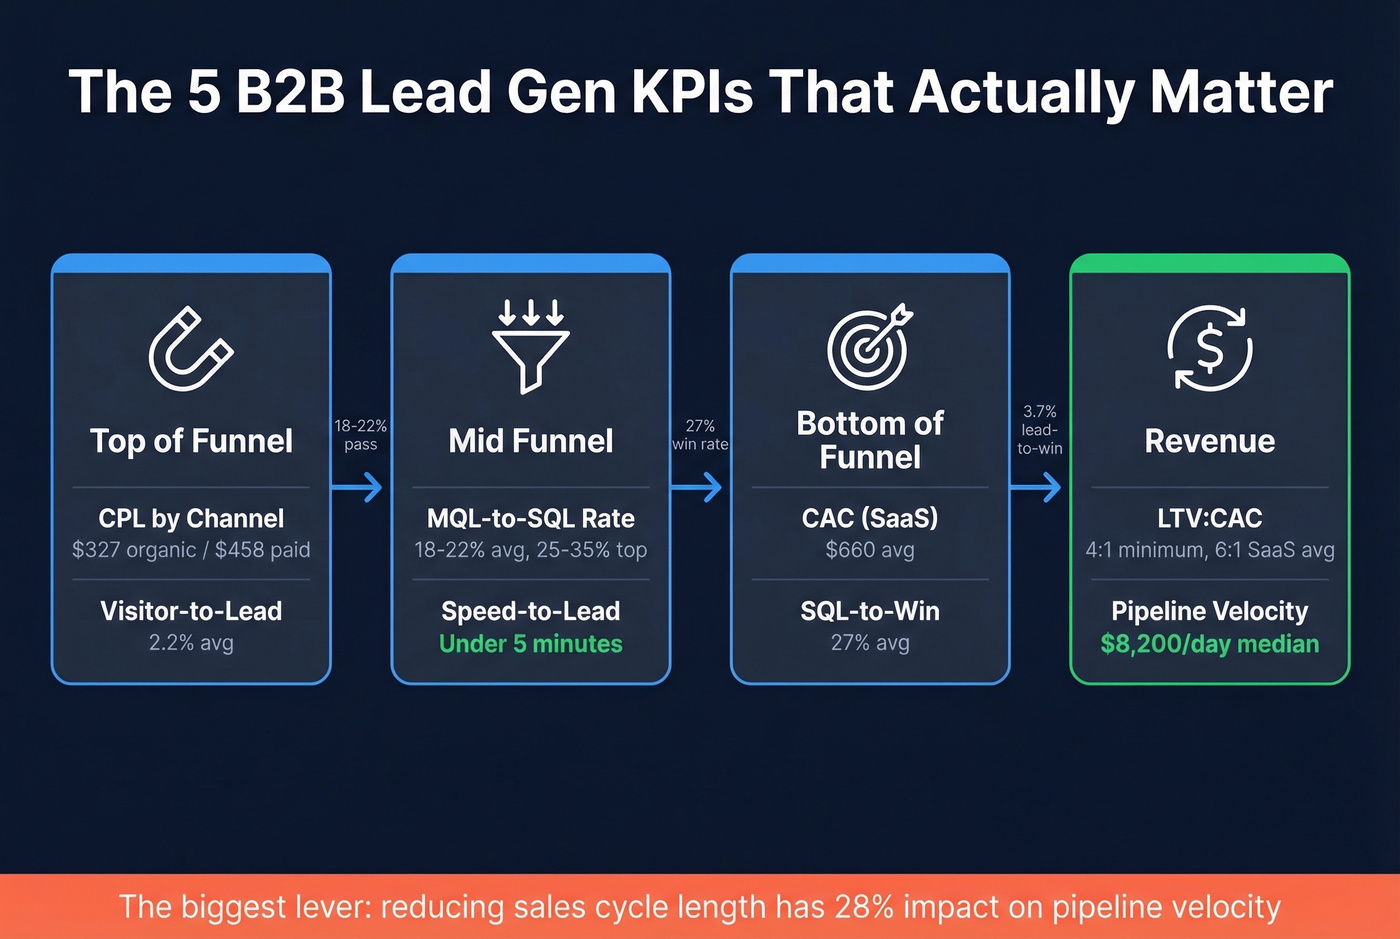
| CPL by channel | Cost efficiency | $327 organic / $458 paid |
| MQL-to-SQL rate | Sales-marketing alignment | 18-22% avg, 25-35% top |
| Speed-to-lead | Follow-up discipline | Under 5 minutes |
| Pipeline velocity | Revenue throughput | $8,200/day (B2B SaaS median) |
| LTV:CAC | Unit economics health | 4:1 minimum |
KPIs That Drive Revenue
Top-of-Funnel: CPL and Visitor-to-Lead
Cost per lead only matters when you split it by channel. Across 140+ B2B campaigns benchmarked by First Page Sage, organic CPL averages $327 while paid runs $458. That gap compounds fast at scale.
Visitor-to-lead conversion sits at 2.2% on average. If yours is well below that, the problem is your landing pages, not your traffic source. And a thousand leads that don't convert cost more than a hundred that do - which is why the best lead generation metrics always tie volume back to downstream revenue impact.
Mid-Funnel: MQL-to-SQL and Speed-to-Lead
This is where most funnels break.
MQL-to-SQL conversion averages 18-22%, while top teams hit 25-35%. If yours is below roughly 14-15%, marketing and sales disagree on what "qualified" means. The fix isn't more leads. It's an alignment framework: unified lead definitions, shared KPIs with documented SLAs, and a regular feedback loop between both teams.
Reddit threads on r/b2bmarketing consistently surface the same frustration: marketing celebrates MQL volume while sales calls the leads garbage. MQL-to-SQL conversion is the metric that forces both teams to agree on definitions, and it's the single fastest way to diagnose a broken handoff.
Speed-to-lead is the most underrated KPI on this list. Responding within five minutes makes you 21x more likely to qualify a lead versus waiting 30 minutes. The average company takes 47 hours - not a typo. Cognism targets under three minutes internally and reports a 70% outcome rate on inbound requests. That's the standard worth chasing.
Bottom-of-Funnel: CAC and SQL-to-Win
Here's where the real money conversation happens:
| Industry | CAC | LTV:CAC |
|---|---|---|
| B2B SaaS | $660 | 6:1 |
| Manufacturing | $780 | 4:1 (right at the floor - any churn increase pushes it underwater) |
| Cybersecurity | $1,970 | 5:1 |
| Construction | $4,200 | 3:1 |
SQL-to-win averages 27%. Lead-to-win - the full-funnel number - sits at just 3.7%. Let's be honest: if you're only reporting top-of-funnel volume to your exec team, you're hiding the real story.
Revenue: LTV:CAC and Pipeline Velocity
LTV:CAC is the metric your board cares about. The benchmark is 4:1; B2B SaaS averages 6:1. Below 3:1, you're spending too much to acquire customers relative to their value.
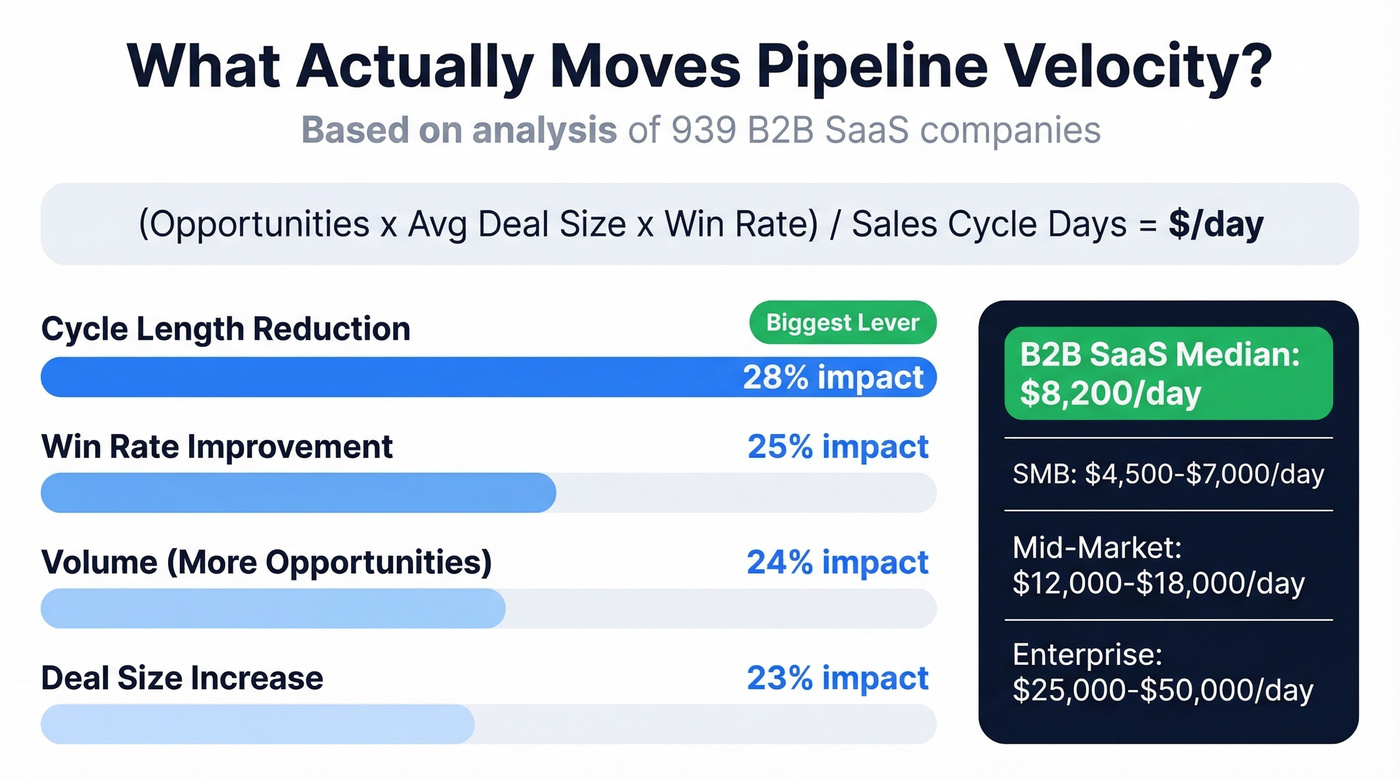
Pipeline velocity is the single most important compound metric in B2B: (Opportunities x Avg Deal Size x Win Rate) / Sales Cycle Days = $/day. Based on Optifai's benchmark of 939 companies, B2B SaaS median is $8,200/day. SMB teams run $4,500-$7,000; mid-market runs $12,000-$18,000; enterprise hits $25,000-$50,000.
We've seen teams obsess over generating more opportunities when the fastest lever is actually reducing cycle length - it has a 28% impact on pipeline velocity, more than win rate (25%), volume (24%), or deal size (23%). If you're not tracking pipeline velocity, you're flying blind on the metric that most directly predicts whether you'll hit your quarterly target.
Pipeline velocity depends on reaching real buyers fast. Bounced emails kill your speed-to-lead, inflate your CAC, and corrupt every conversion metric downstream. Prospeo's 98% email accuracy and 7-day data refresh mean the leads entering your funnel actually connect - so the KPIs you're tracking reflect reality, not data decay.
Fix the data and every metric on your dashboard improves.
Benchmarks by Channel
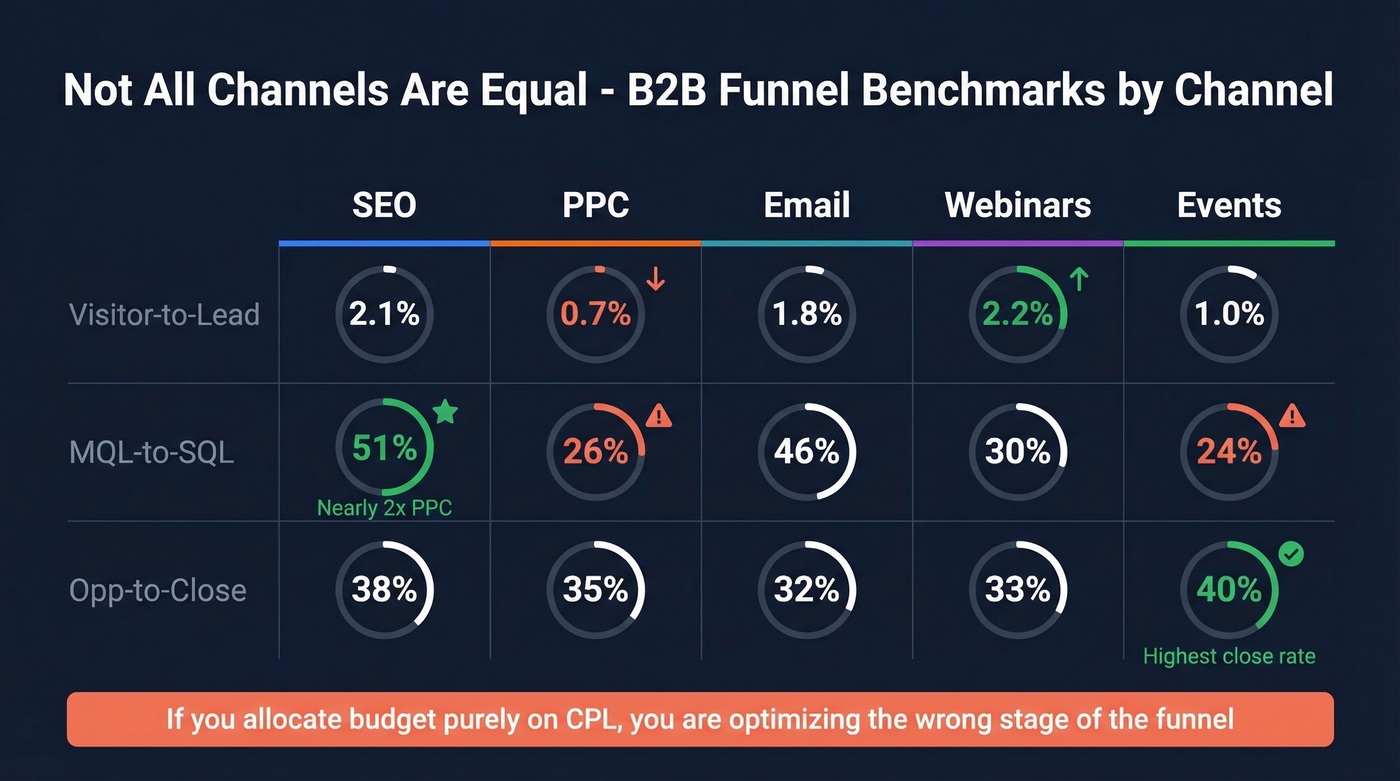
Channel benchmark data compiled from 40+ studies by Digital Bloom shows dramatic differences across the funnel:
| Channel | Visitor-to-Lead | MQL-to-SQL | Opp-to-Close |
|---|---|---|---|
| SEO | 2.1% | 51% | 38% |
| PPC | 0.7% | 26% | 35% |
| 1.8% | 46% | 32% | |
| Webinars | 2.2% | 30% | 33% |
| Events | 1.0% | 24% | 40% |
SEO's MQL-to-SQL rate (51%) is nearly double PPC's (26%). Events have the highest close rate at 40%. If you're allocating budget purely on CPL, you're optimizing the wrong stage of the funnel - and probably over-investing in paid at the expense of channels that close better.
Mistakes That Corrupt Your Numbers
In our experience, teams that track more than 10 KPIs end up acting on none of them. Eight to ten is the ceiling. Beyond that, you're creating noise.

Vanity metrics without conversion context. Pageviews and content downloads aren't outcomes. They don't belong on your primary dashboard. Track them somewhere, sure - but not alongside pipeline velocity and CAC.
Single attribution model bias. Your CPL and CAC change dramatically depending on first-touch, last-touch, or W-shaped attribution. Pick a model, document it, stick with it. Without consistent attribution, your lead generation analytics tell a different story every quarter, and nobody trusts the numbers.
Ignoring data quality. This is the invisible variable that corrupts every downstream metric. If 30% of your emails bounce, your CPL is artificially low, your conversion rates are depressed, and your speed-to-lead is irrelevant because the lead never got your message. Snyk cut their bounce rate from 35-40% to under 5% and grew AE-sourced pipeline 180% after switching to Prospeo's 98%-accuracy verification with a 7-day refresh cycle. Clean data isn't a nice-to-have - it's the foundation every other metric depends on. (If you want to go deeper on this, start with bounce rate and email deliverability.)
No response-time SLA. 83% of SDRs miss quota consistently. Without a documented SLA and routing automation, speed-to-lead is just a number nobody's accountable for.

Teams that cut bounce rates from 35% to under 5% see pipeline growth of 140-180%. Prospeo delivers 300M+ verified profiles, 125M+ mobile numbers with a 30% pickup rate, and emails at $0.01 each - no contracts, no sales calls. Your LTV:CAC ratio depends on clean data at the top of the funnel.
Stop optimizing KPIs built on bad data. Start with 75 free emails.
Build Your Dashboard in Four Blocks
Acquisition funnel report. Stage conversion rates from visitor through closed-won. This is your single source of truth for funnel health, and it should be the first thing your team reviews each week.
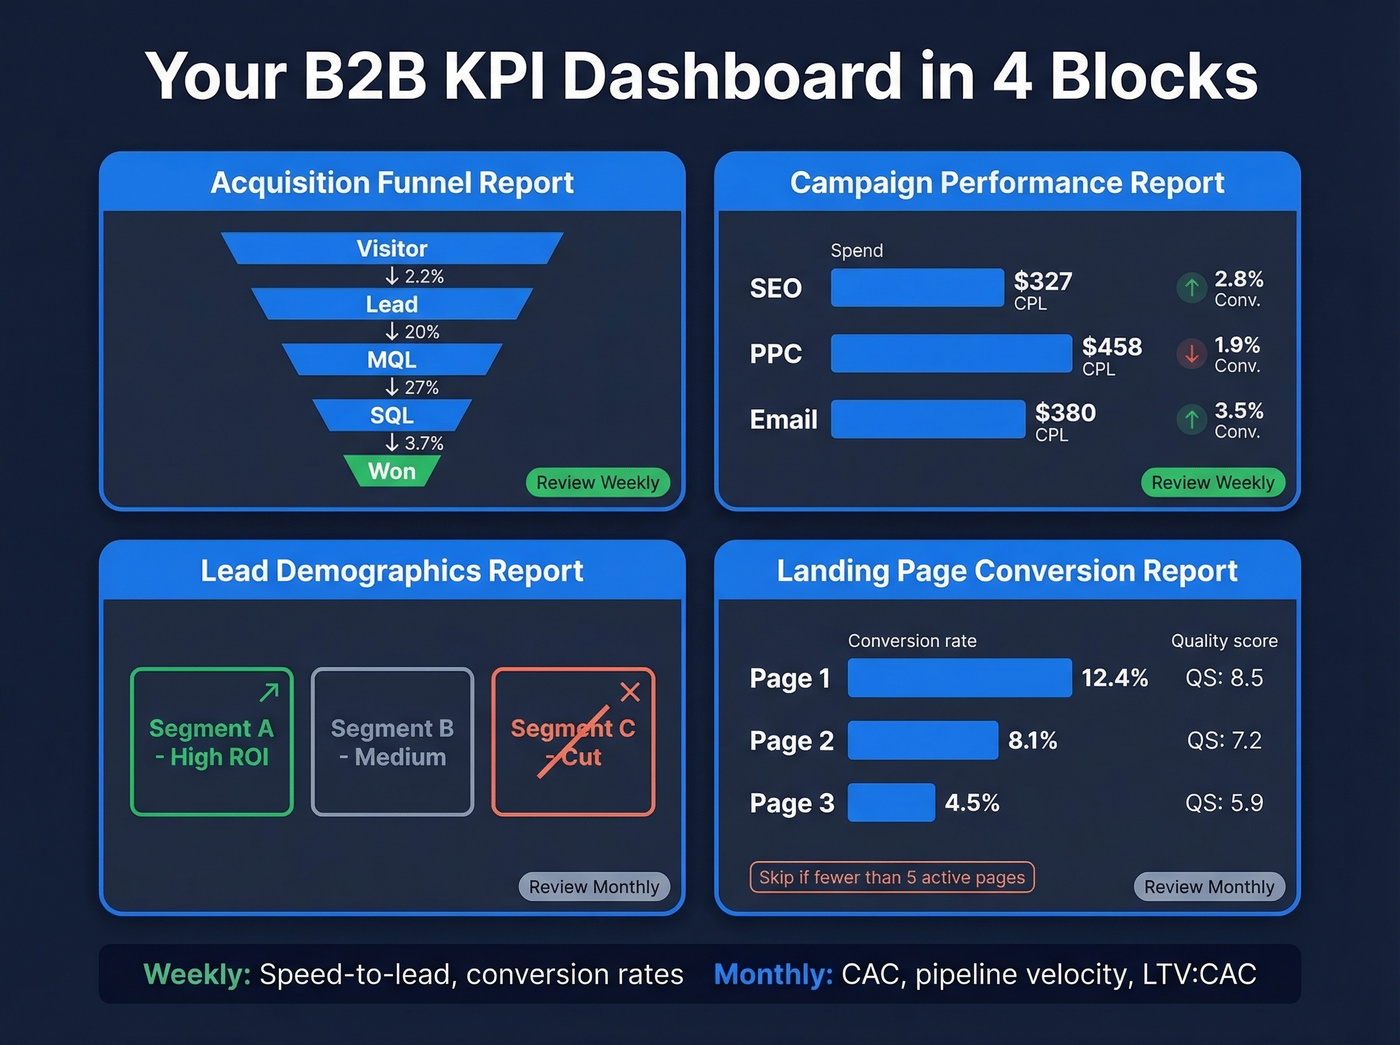
Campaign performance report. Spend, CPL, and conversion by channel. Don't just look at cost - tie each channel back to the SQL and close rates from the benchmarks above.
Lead demographics report. Segment performance by ICP attributes. When budget is tight, this is how you figure out which segments to double down on and which to cut.
Landing page conversion report. Page-level conversion tied to lead quality. Skip this if you're running fewer than five active landing pages - the sample size won't tell you anything useful.
Review speed-to-lead and conversion rates weekly. CAC, pipeline velocity, and LTV:CAC are monthly metrics. Centralizing these in a single view prevents the dashboard sprawl that kills accountability. If you need a broader framework for what to track, map these into your funnel metrics and your lead generation workflow.
FAQ
What's a good MQL-to-SQL conversion rate?
18-22% is average across B2B companies. Top-performing teams hit 25-35% by enforcing shared ICP definitions and documented SLAs between marketing and sales. Below roughly 14-15%, realign on qualification criteria before optimizing anything else.
How do you calculate pipeline velocity?
(Opportunities x Avg Deal Size x Win Rate) / Sales Cycle Days. B2B SaaS median is $8,200/day. Reducing cycle length has the single largest impact (28%) on this number - more than win rate, volume, or deal size.
Which lead generation KPI matters most?
Pipeline velocity. It's the only metric combining volume, deal size, win rate, and cycle length into one revenue number, and it's the KPI that most closely predicts whether you'll hit your quarterly target.
How does data quality affect these KPIs?
High bounce rates inflate CPL, tank conversion rates, and extend sales cycles. Snyk saw this firsthand - bounces dropped from 35% to under 5% after cleaning up their data infrastructure, and pipeline grew 180% as a direct result.
What tools help track B2B lead generation performance?
Start with your CRM's native reporting. HubSpot and Salesforce both offer pipeline velocity dashboards out of the box. Layer in a data quality tool like Prospeo to make sure the numbers feeding your analytics are accurate, then add attribution software only after your core funnel metrics are clean and consistent.