B2B Marketing Benchmarks 2026: The Numbers That Actually Matter
A 2% visitor-to-lead conversion rate is either a crisis or perfectly normal - it depends entirely on whether you're selling $5K SaaS seats or $200K enterprise platforms. That's the problem with most B2B marketing benchmarks: they hand you an average and call it a target. Averages lie. The numbers that matter are the ones segmented by your industry, deal size, and company stage, and that's exactly how we've organized everything below.
Quick-Reference Benchmark Table
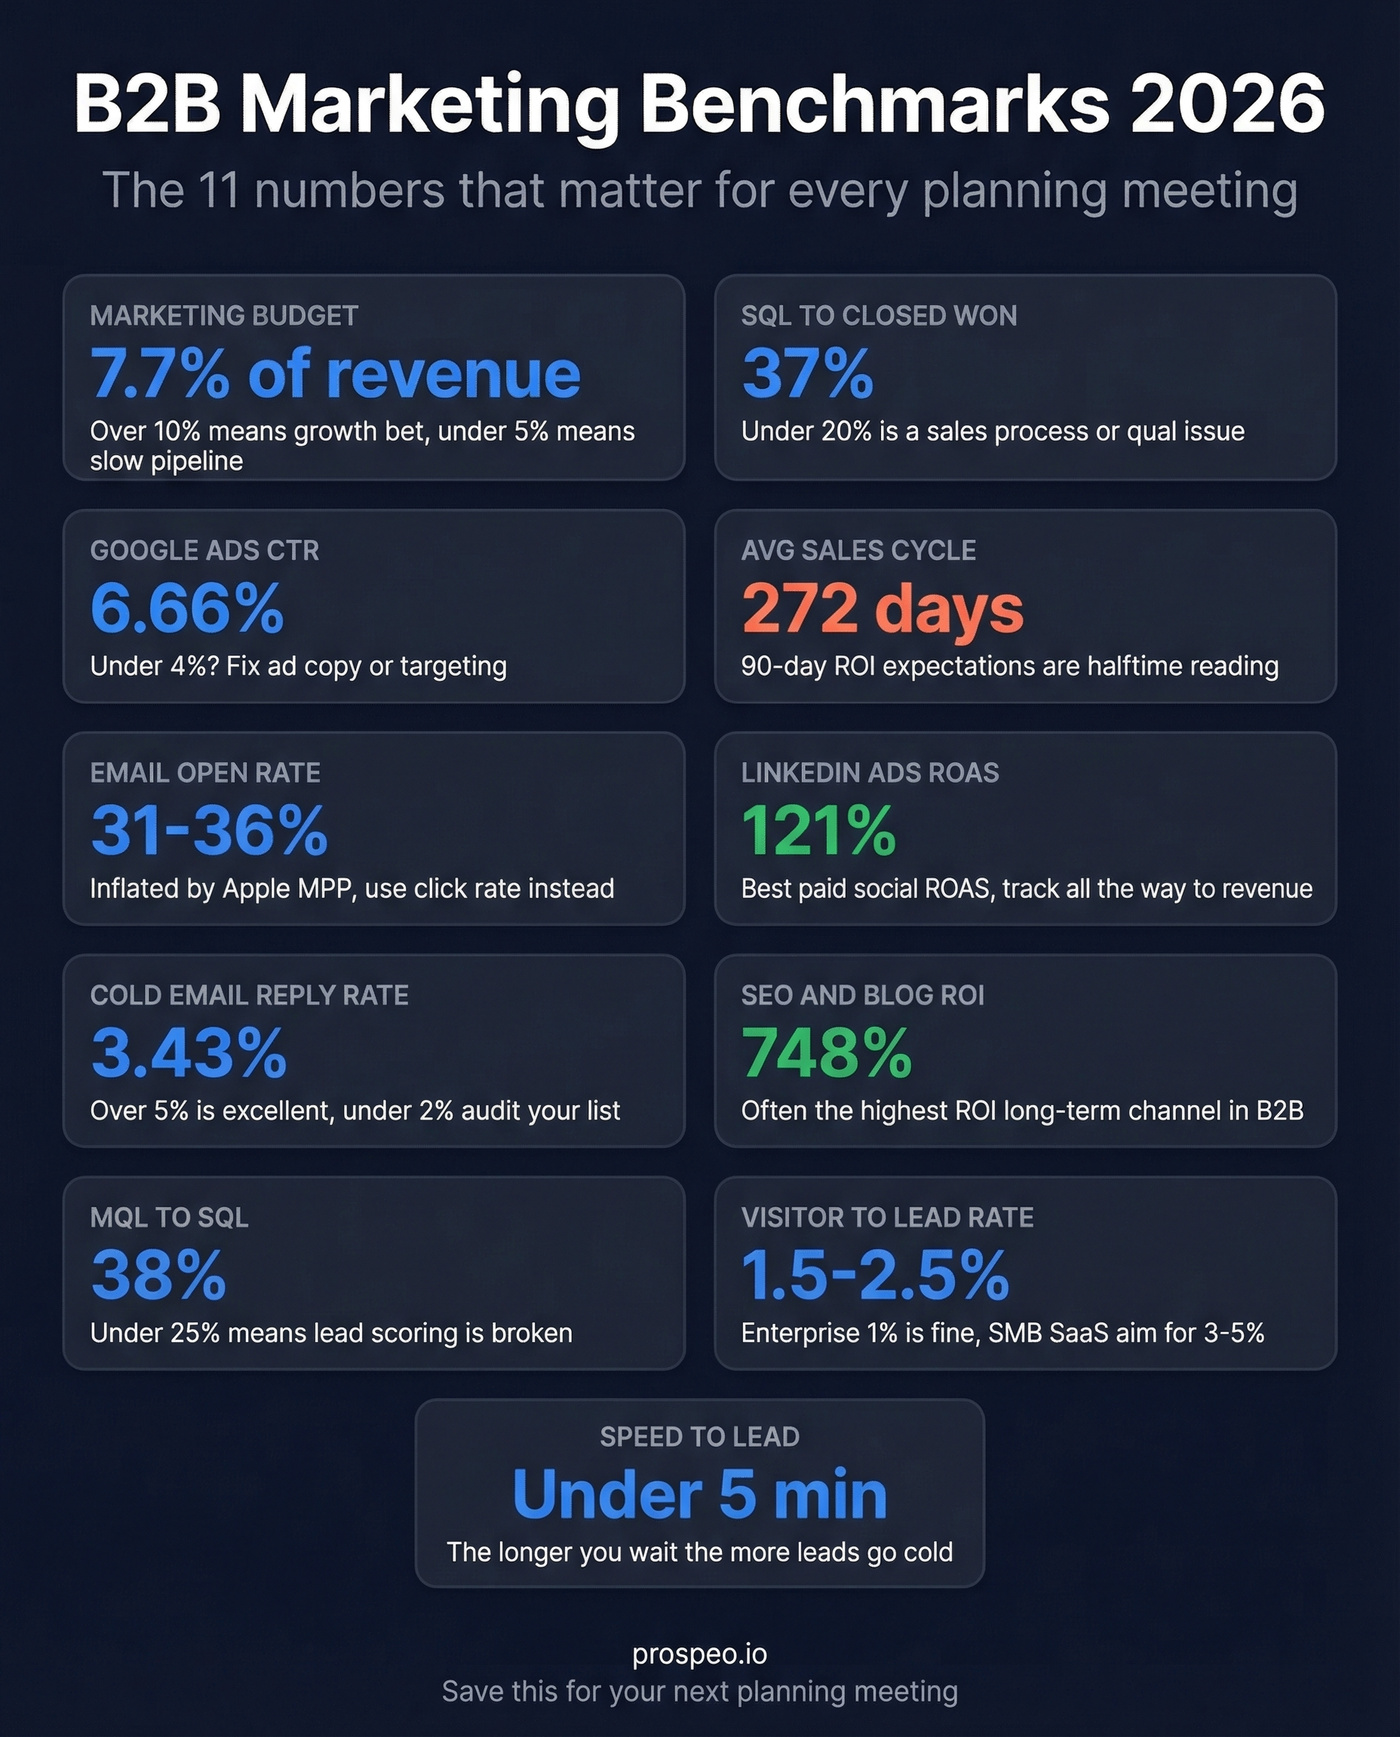
Here are the 11 benchmarks that come up in every planning meeting. If you've only got two minutes, use this.
| Metric | Benchmark | How to Read It |
|---|---|---|
| Marketing budget (% rev) | 7.7% | >10% = growth bet. <5% = slow pipeline. |
| Google Ads CTR | 6.66% | <4%? Fix ad copy or targeting. |
| Opt-in email open rate | 31-36% | Inflated by Apple MPP. Use 2.6%+ click rate instead. |
| Cold email reply rate | 3.43% | >5% = excellent. <2% = audit your list. |
| MQL-to-SQL (B2B SaaS) | 38% | <25%? Lead scoring is broken. |
| SQL-to-Closed Won | 37% | <20%? Sales process or qual issue. |
| Avg sales cycle | 272 days | 90-day ROI = reading halftime. |
| LinkedIn Ads ROAS | 121% | Best paid social ROAS. Track to revenue. |
| SEO / blog ROI | 748% | Often the highest-ROI long-term channel in B2B. |
| Visitor-to-Lead rate | 1.5-2.5% avg | Enterprise: 1% is fine. SMB SaaS: aim 3-5%. |
| Speed to lead | <5 minutes ideal | The longer you wait, the more leads go cold. |
Now let's unpack each one.
Marketing Budget Benchmarks
Gartner's 2025 CMO Spend Survey - 402 CMOs at $1B+ companies, surveyed February through March 2025 - pegs marketing budgets at 7.7% of overall company revenue. That's flat year-over-year.
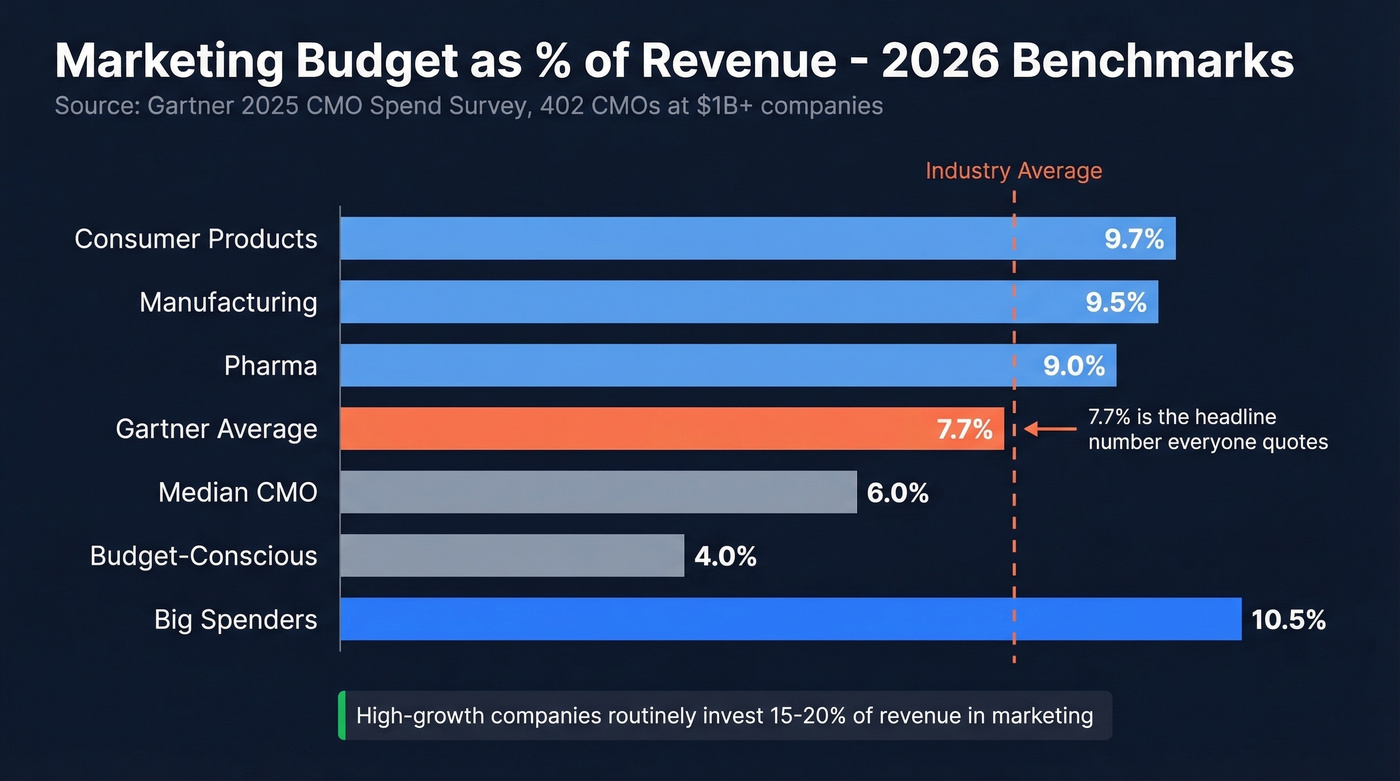
But the average obscures a wide distribution. Half of CMOs report spending 6% or less. Budget-conscious organizations sit at 4% or below, while big spenders push past 10.5%.
Industry matters enormously: consumer products averages 9.7%, manufacturing 9.5%, and pharma 9%. GTM motion matters too - PLG companies typically run leaner marketing budgets than sales-led orgs because the product itself drives acquisition, while outbound-heavy companies need more fuel for demand gen. If you're pressure-testing your go-to-market strategy, this is one of the first levers to sanity-check.
Where does the money go? Paid media takes the largest slice at 30.6% of total marketing budget - roughly 2.4% of company revenue. Nearly two-thirds of channel budget flows to digital, and 69% of that digital spend goes to paid channels. On the offline side, events (19.3%), sponsorships (17.4%), and linear TV (16.2%) dominate.
Here's the thing: 59% of CMOs say their budget isn't sufficient to execute their strategy. If your CFO is benchmarking against "7.7%," remind them that high-growth companies routinely invest 15-20% of revenue in marketing. The 7.7% figure is anchored to $1B+ enterprises - not Series B companies trying to triple pipeline.
One bright spot: GenAI is already reshaping productivity within existing budgets. Gartner found 49% of marketers report improved time efficiency and 40% report cost efficiency gains from AI tools. Budgets haven't grown, but the output per dollar is shifting - teams that adopt AI workflows are effectively getting a 10-15% "phantom budget increase" without asking the CFO for a dime.
| Segment | Budget as % of Revenue |
|---|---|
| Gartner average | 7.7% |
| Budget-conscious | 4% or less |
| Median CMO | ~6% |
| Big spenders | >10.5% |
| Consumer products | 9.7% |
| Manufacturing | 9.5% |
| Pharma | 9.0% |
Email Marketing Benchmarks
Opt-In Email
Mailchimp's benchmark dataset - billions of emails, campaigns with 1,000+ subscribers, last updated December 2023 - remains the most granular industry-segmented source available for opt-in email performance.
| Industry | Open Rate | Click Rate | Unsub Rate |
|---|---|---|---|
| Business & Finance | 31.35% | 2.78% | 0.15% |
| Education & Training | 35.64% | 3.02% | 0.18% |
| Ecommerce | 29.81% | 1.74% | 0.19% |
| All users average | 35.63% | 2.62% | 0.22% |
Apple Mail Privacy Protection has been inflating open rates since 2021. If a significant chunk of your list uses Apple Mail, your open rate is artificially high. Click-through rate and click-to-open rate are your real engagement metrics now. Above 3%? You're outperforming. Below 2%? Your subject lines might be fine - your content or CTAs need work (and if you want a deeper playbook, start with email copywriting).
Cold Email
Cold email lives in a completely different benchmark universe than opt-in. Don't compare the two.
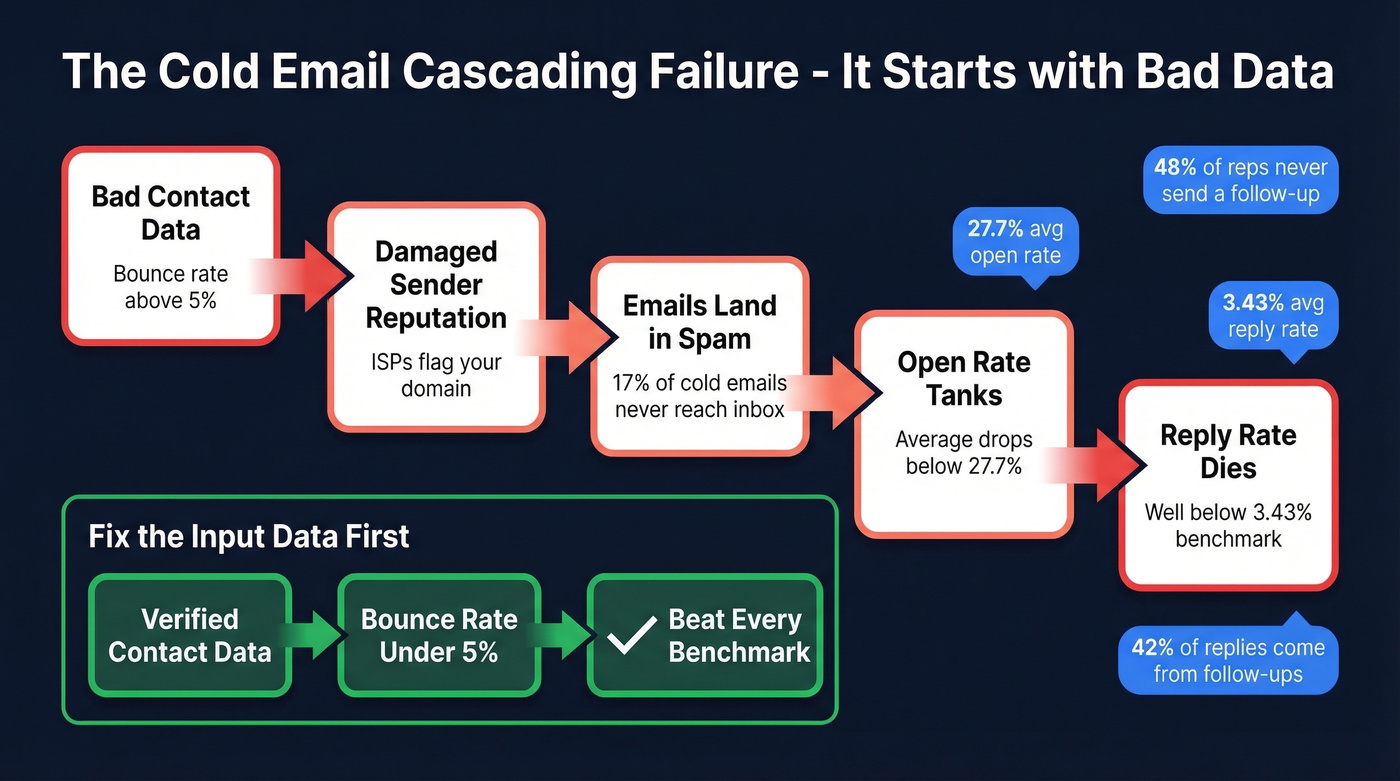
The numbers: 27.7% average open rate, 3.43% reply rate, and 17% of cold emails never reach the inbox at all - lost to bounces and spam filters. Follow-ups generate 42% of all campaign replies, yet 48% of reps never send a second message. That's pipeline left on the table (use these cold email follow-up templates to close the gap).

But here's what most benchmark roundups miss: if your bounce rate is above 5%, you don't have a messaging problem - you have a data problem. Every bounced email damages your sender reputation, which pushes more of your valid emails into spam, which tanks your open rate, which kills your reply rate. It's a cascading failure that starts with bad contact data. Snyk's outbound team of 50 AEs saw bounce rates drop from 35-40% to under 5% after switching to Prospeo's verified contact data, with AE-sourced pipeline up 180%. When 17% of cold emails industry-wide never reach the inbox, the fastest way to beat the benchmark is to fix the input data, not rewrite your subject line for the fifteenth time. If you need a diagnostic checklist, start with an email deliverability guide and then benchmark against a clean email bounce rate.
Paid Search Benchmarks
WordStream's 2026 Google Ads benchmark report analyzed 16,000+ campaigns running April 2024 through March 2025 across 23 industries. It's the most complete paid search dataset publicly available.
| Category | CTR | Notes |
|---|---|---|
| Overall average | 6.66% | Up 3.74% YoY |
| Business Services | 5.65% | Closest "B2B" proxy |
| Industrial & Commercial | 6.23% | Manufacturing, logistics |
| Finance & Insurance | 8.33% | High intent, high CPC |
| Attorneys & Legal | 5.97% | Professional services |
The directional trends matter more than the absolutes. CPC increased for 87% of industries. Cost per lead rose for 13 of 23 industries, with an average increase around 5%. Conversion rates improved for 65% of industries - so the traffic is getting more expensive but also slightly more qualified.
For B2B teams, the "Business Services" category at 5.65% CTR is your closest proxy. Below 4% means your ad copy or keyword targeting needs attention. Above 7% and you're running a tight ship. The real danger zone is high CTR with high CPL - that means you're attracting clicks that don't convert, which usually points to a landing page or qualification problem rather than an ad problem.
Paid Social Benchmarks
LinkedIn's CPL terrifies finance teams. Here's why they should get over it.
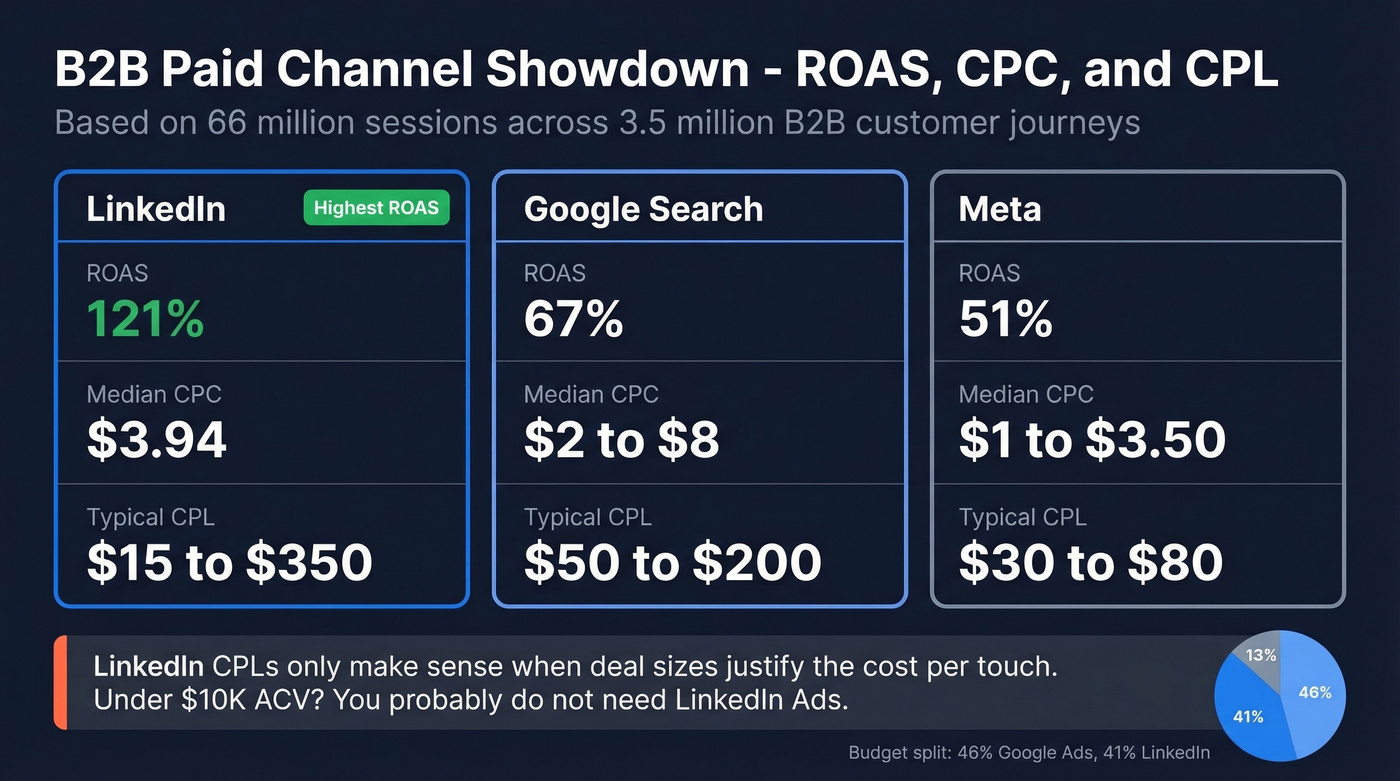
A Dreamdata employee shared their full-funnel attribution data on r/adtech, drawing from 66 million sessions across 3.5 million B2B customer journeys. The findings flipped the conventional wisdom on paid social ROI.
| Platform | Median CPC | Typical CPL | ROAS |
|---|---|---|---|
| $3.94 ($5-$15 aggressive) | $15-$350 | 121% | |
| Google Search | $2-$8 | $50-$200 | 67% |
| Meta | $1-$3.50 | $30-$80 | 51% |
LinkedIn Ads deliver 121% ROAS when tracked all the way to revenue - $1.21 back for every $1 spent. That's modest in isolation, but it's the highest among paid social channels by a wide margin. Google Search comes in at 67%. Meta sits at 51%. The budget split reflects this: 46% of B2B paid spend goes to Google Ads, 41% to LinkedIn.
If your average deal size is under $10K, you probably don't need LinkedIn Ads. The CPLs only make sense when the deal sizes justify the cost per touch. For mid-market and enterprise deals, though, cutting LinkedIn spend is one of the most expensive "savings" a B2B team can make.
Look - a $200 LinkedIn CPL looks insane next to a $40 Meta CPL. But Meta's lower cost reflects lower intent. We've seen teams slash LinkedIn budgets after a bad quarter, only to watch pipeline dry up two quarters later because the 272-day sales cycle means you're cutting the campaigns that would've generated revenue in Q3.
The KLIQ 2026 benchmark roundup adds two important data points: 78% of B2B marketers now use video, and brands combining video with creator partnerships are 2.2x more likely to be trusted. Meanwhile, 94% of marketers agree trust is the key currency in B2B - which explains why thought leadership and creator-led content outperform polished corporate ads on LinkedIn. If you're running LinkedIn ads without video creative, you're leaving performance on the table.
Industry benchmarks say 17% of cold emails never reach the inbox and the average bounce rate kills sender reputation. Snyk cut bounces from 35% to under 5% with Prospeo and grew AE-sourced pipeline 180%. At 98% email accuracy, you stop benchmarking deliverability and start benchmarking revenue.
Beat every cold email benchmark by fixing the data layer first.
Full-Funnel Conversion Benchmarks
Half of all marketers now use CRO as an optimization technique, and lead-to-customer conversion is the #2 most important KPI behind revenue, per HubSpot's 2026 State of Marketing stats. That context matters: the industry is obsessed with funnel efficiency right now, and for good reason.
Stage-by-Stage Conversion by Industry
First Page Sage's funnel conversion report - drawn from client data spanning 2017-2025, approximately 65% B2B - is one of the few sources that breaks conversion by industry at every funnel stage.
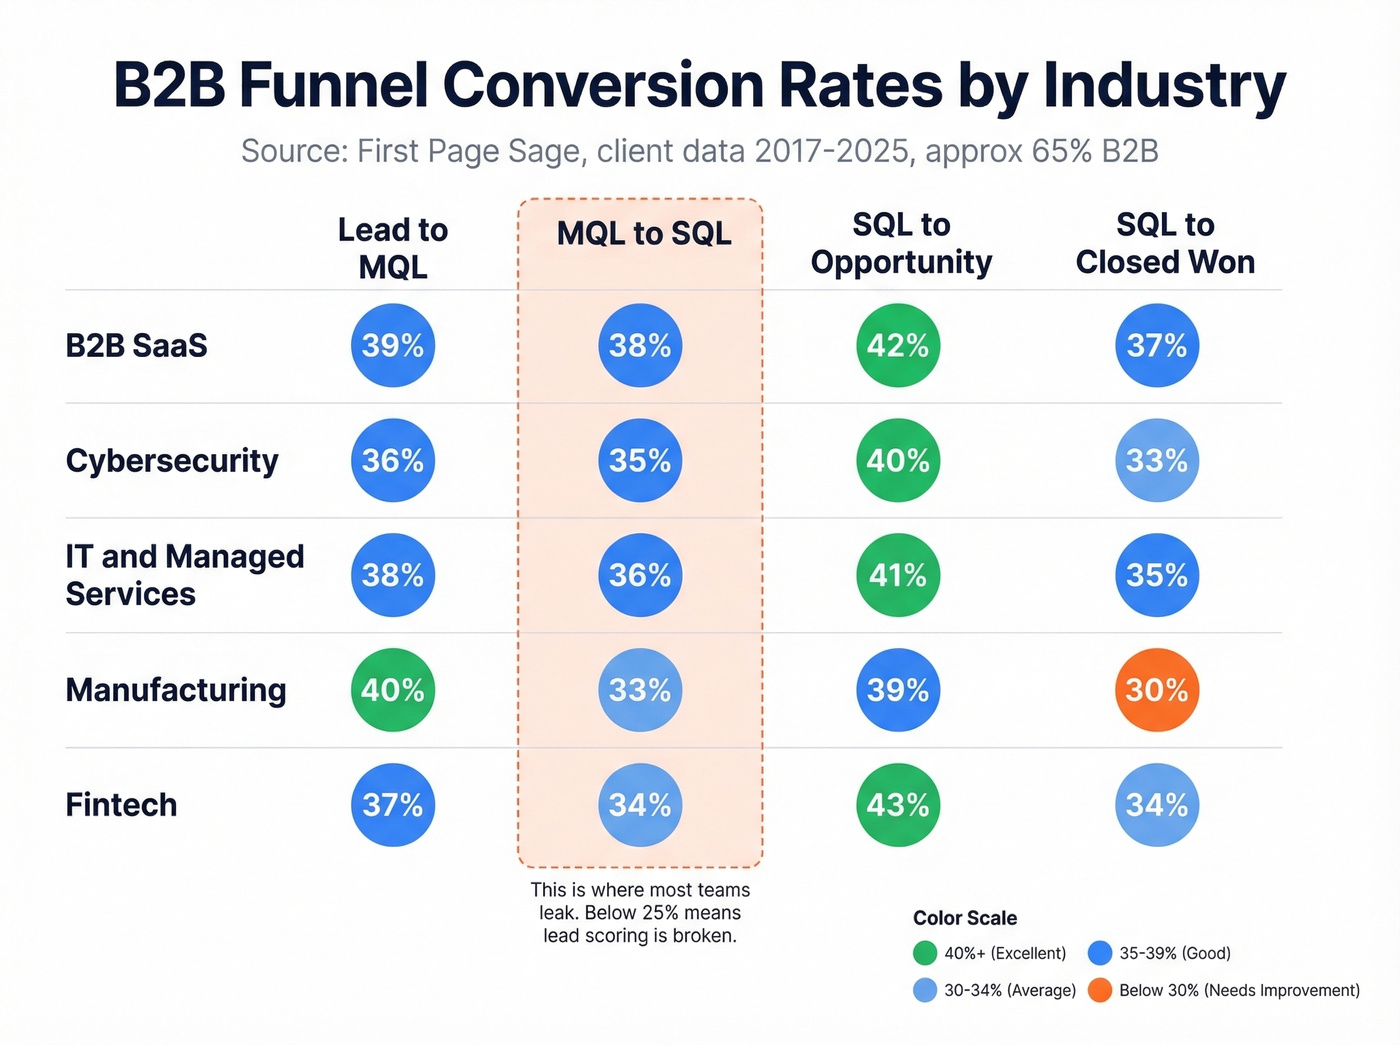
| Industry | Lead-to-MQL | MQL-to-SQL | SQL-to-Opp | SQL-to-Closed |
|---|---|---|---|---|
| B2B SaaS | 39% | 38% | 42% | 37% |
| Cybersecurity | 36% | 35% | 40% | 33% |
| IT & Managed Services | 38% | 36% | 41% | 35% |
| Manufacturing | 40% | 33% | 39% | 30% |
| Fintech | 37% | 34% | 43% | 34% |
The MQL-to-SQL stage is where most teams leak. Below 25% here, and the problem is almost always lead scoring - you're passing unqualified leads to sales, and reps are rightfully ignoring them. Above 40% means your marketing and sales teams genuinely agree on what "qualified" means. In our experience, fewer than 1 in 5 teams we've audited have that alignment (a good next step is tightening your funnel metrics so both teams look at the same scoreboard).
How Benchmarks Shift by Company Size
CausalFunnel's 2026 data breaks visitor-to-lead conversion into tiers that are far more useful than a single average.
Visitor-to-Lead sits at 1.5-2.5% on average, with strong performers hitting 3-5% and exceptional outliers reaching 8-15%. But company size changes everything. Enterprise companies typically see lower visitor-to-lead rates - sometimes under 1% - because their traffic is smaller and more targeted, and their buying committees are larger. SMB-focused SaaS companies should expect higher top-of-funnel conversion but lower deal values.
A 2% visitor-to-lead rate is perfectly average for teams selling $10K ACV SaaS. For enterprise deals above $50K, 1% is normal and healthy. The mistake is benchmarking your enterprise motion against SMB conversion rates and panicking. (If you want a dedicated deep dive, see average B2B lead conversion rate.)
Sales Cycle and Time-to-Revenue
This is the benchmark that should reshape how you measure marketing.
Dreamdata's dataset puts the average B2B buying journey at 272 days. Marketing owns 81% of that timeline - roughly 220 days. From first ad impression to revenue: 281 days. From first ad conversion to revenue: 214 days. From first ad engagement to revenue: 212 days. The gap between engagement and conversion timelines is almost negligible, which means optimizing purely for "conversion" events doesn't meaningfully shorten the path to revenue.
If you're measuring campaign ROI at 90 days, you're reading the scoreboard at halftime. A campaign that looks like a failure in Q1 might be your biggest pipeline contributor in Q3. We've watched teams kill campaigns based on 60-day attribution windows, only to realize six months later that those campaigns were feeding the deals that eventually closed. Long-cycle attribution isn't optional for B2B - it's the difference between data-driven decisions and data-driven mistakes.
AI Search and AEO Benchmarks
This is the benchmark category that didn't exist two years ago - and it's already reshaping how B2B buyers find vendors.
Nearly 30% of marketers reported decreased organic search traffic as buyers shift to AI tools for research, per HubSpot's 2026 State of Marketing stats. That's not a blip. Influ2's research adds a critical nuance: 72% of B2B buyers have encountered AI Overviews in their search results, and 90% of those buyers clicked at least one cited source. The traffic isn't disappearing - it's being redistributed to the sources that AI models cite.
What does this mean for benchmarks? Traditional SEO metrics like keyword rankings and organic sessions are becoming incomplete measures of visibility. The emerging metrics to track are AI citation share (how often your brand appears in AI-generated answers), share of voice in AI Overviews, and AI referral traffic as a percentage of total organic. Most analytics platforms don't surface these natively yet, but teams that start measuring now will have a 12-month head start on everyone else.
The practical implication: structured, authoritative content with clear data points gets cited by AI models. Vague thought leadership doesn't. If your content strategy is built around opinion pieces without original data, expect your AI visibility to be near zero.
ABM Benchmarks
Account-based marketing is still an emerging benchmark category, but the early data is compelling. Influ2's research shows contact-level ABM increasing booked meetings by up to 74% and lifting pipeline conversion by up to 118%. And 24% of teams plan to implement contact-level ABM in the next 12 months.
The constraints are real, though. 42% of teams say they can't identify the right buyers within target accounts. 37% don't know when to engage. 31% lack the resources to personalize at scale. These aren't technology problems - they're data and process problems. You can't run contact-level ABM if you don't have verified contact data for the buying committee, and you can't time your outreach without intent signals.
The directional signal is clear: teams that move from account-level to contact-level targeting see dramatic improvements in meeting and pipeline conversion. The bottleneck is execution, not strategy.
How to Use These Benchmarks
Most teams collect benchmarks and do nothing with them. Let's fix that with a four-step framework that turns these numbers into action.
Step 1: Establish your baseline. Pull your actual numbers from your CRM and analytics platform. You need your real visitor-to-lead rate, MQL-to-SQL conversion, average sales cycle, email bounce rate, and cost per lead by channel. You can't identify a gap if you don't know where you stand.
Step 2: Segment by your context. Don't compare yourself to the "average." Use the industry tables above to find your vertical. Factor in your ACV - a $5K deal and a $100K deal have fundamentally different funnel dynamics. Adjust for company size using the CausalFunnel tiers.
Step 3: Identify the biggest gap. Look at each funnel stage. Where's the largest delta between your number and the benchmark? That's your highest-leverage fix. A team with a 15% MQL-to-SQL rate against the 38% benchmark has a lead quality problem that no amount of sales enablement will solve.
Step 4: Fix the input, not the metric. This is where most teams go wrong. They see a low reply rate and rewrite their email copy. They see a low conversion rate and redesign their landing page. But often the problem is upstream - bad data, wrong audience, poor targeting. If your email metrics lag, audit your contact data first. Run your list through a verification tool and measure the difference in deliverability before you rewrite a single subject line. We've seen teams improve reply rates by 40% just by cleaning their lists, without changing a word of copy. If you want a more tactical outbound playbook, start with sales prospecting techniques.
Your MQL-to-SQL conversion rate won't hit 38% if your reps waste hours chasing outdated contacts. Prospeo refreshes 300M+ profiles every 7 days - not every 6 weeks - so your pipeline metrics reflect real buyer engagement, not stale data decay.
Stop letting bad data drag your funnel benchmarks below average.
FAQ
What percentage of revenue should B2B companies spend on marketing?
Gartner's survey of 402 CMOs puts the average at 7.7% of company revenue, but half of CMOs spend 6% or less. High-growth companies routinely invest 15-20%. The right number depends on your growth targets and competitive intensity - 7.7% is a maintenance budget, not a growth budget.
What's a good MQL-to-SQL conversion rate?
For B2B SaaS, 38% is the benchmark per First Page Sage's multi-year dataset. Below 25% typically signals a lead quality or scoring misalignment between marketing and sales. Above 40% means your teams agree on what "qualified" actually means.
How long is the average B2B sales cycle?
Dreamdata's data across 3.5 million customer journeys shows 272 days from first touch to revenue, with marketing owning 81% of that timeline. Measuring campaign ROI before 180 days gives you an incomplete and often misleading picture.
Why aren't email open rates reliable anymore?
Apple Mail Privacy Protection pre-fetches email content for all Apple Mail users, inflating open rates artificially regardless of whether the recipient actually read the message. Click-through rate and click-to-open rate are more reliable engagement metrics - and in 2026, that's the standard for most B2B lists.
How does contact data quality affect marketing performance?
Directly and dramatically. If 17% of cold emails never reach the inbox due to bounces, every downstream metric - reply rate, pipeline, revenue - is deflated. Fixing bounce rates to under 5% lifts every metric that follows. Snyk saw AE-sourced pipeline jump 180% after solving their data quality problem, which is why we always tell teams to audit their lists before touching their messaging.