B2B Marketing Strategy Framework for 2026 (With Benchmarks)
Most B2B marketing frameworks are channel lists dressed up as strategy. They tell you to "do content marketing" and "run LinkedIn ads" without answering the only question that matters: which accounts should you pursue, and how will you know it's working? B2B buyers now use an average of 10.2 channels in their buying journey, and they're nearly 70% through the purchasing process before they ever talk to a seller. That's not a lot of room for guesswork.
Here's the thing - most frameworks we've seen start with data infrastructure or dark funnel tracking. This one starts with ICP scoring, because without knowing who to target, infrastructure is overhead. A popular thread on r/SaaS makes the same argument: fix your ICP, then positioning, then channel selection. Tactics without that foundation are expensive noise.
What follows is a six-stage operating system built around pipeline, not pageviews.
The Framework at a Glance
- Score Your ICP - Tier accounts by fit using a 100-point rubric
- Lock Your Positioning - Align messaging to the buying committee
- Pick 1-3 Channels - Concentrate spend where your ICP actually lives
- Build Pipeline on Clean Data - Verified contacts or it's all theoretical
- Align Sales & Marketing - Shared definitions, shared pipeline
- Measure Pipeline, Not Pageviews - Attribution that ties to revenue

You just scored your ICP into tiers. Now turn Tier A accounts into real pipeline. Prospeo lets you filter 300M+ profiles by buyer intent, technographics, headcount growth, and 30+ other signals - then export verified emails with 98% accuracy on a 7-day refresh cycle. No bounced emails killing your framework before it starts.
Score your ICP, then fill it with contacts that actually connect.
The 6-Stage Strategic Framework
Stage 1 - Score Your ICP
Pull 50-100 closed-won deals from the last 12 months. You'll find that 70-80% of wins share 3-5 traits - industry, headcount range, tech stack, or buying trigger. Build a 100-point scoring rubric around those traits. This step isn't optional. Everything downstream depends on it.
If you need a starting point, use a scoring rubric that forces tradeoffs instead of vibes.
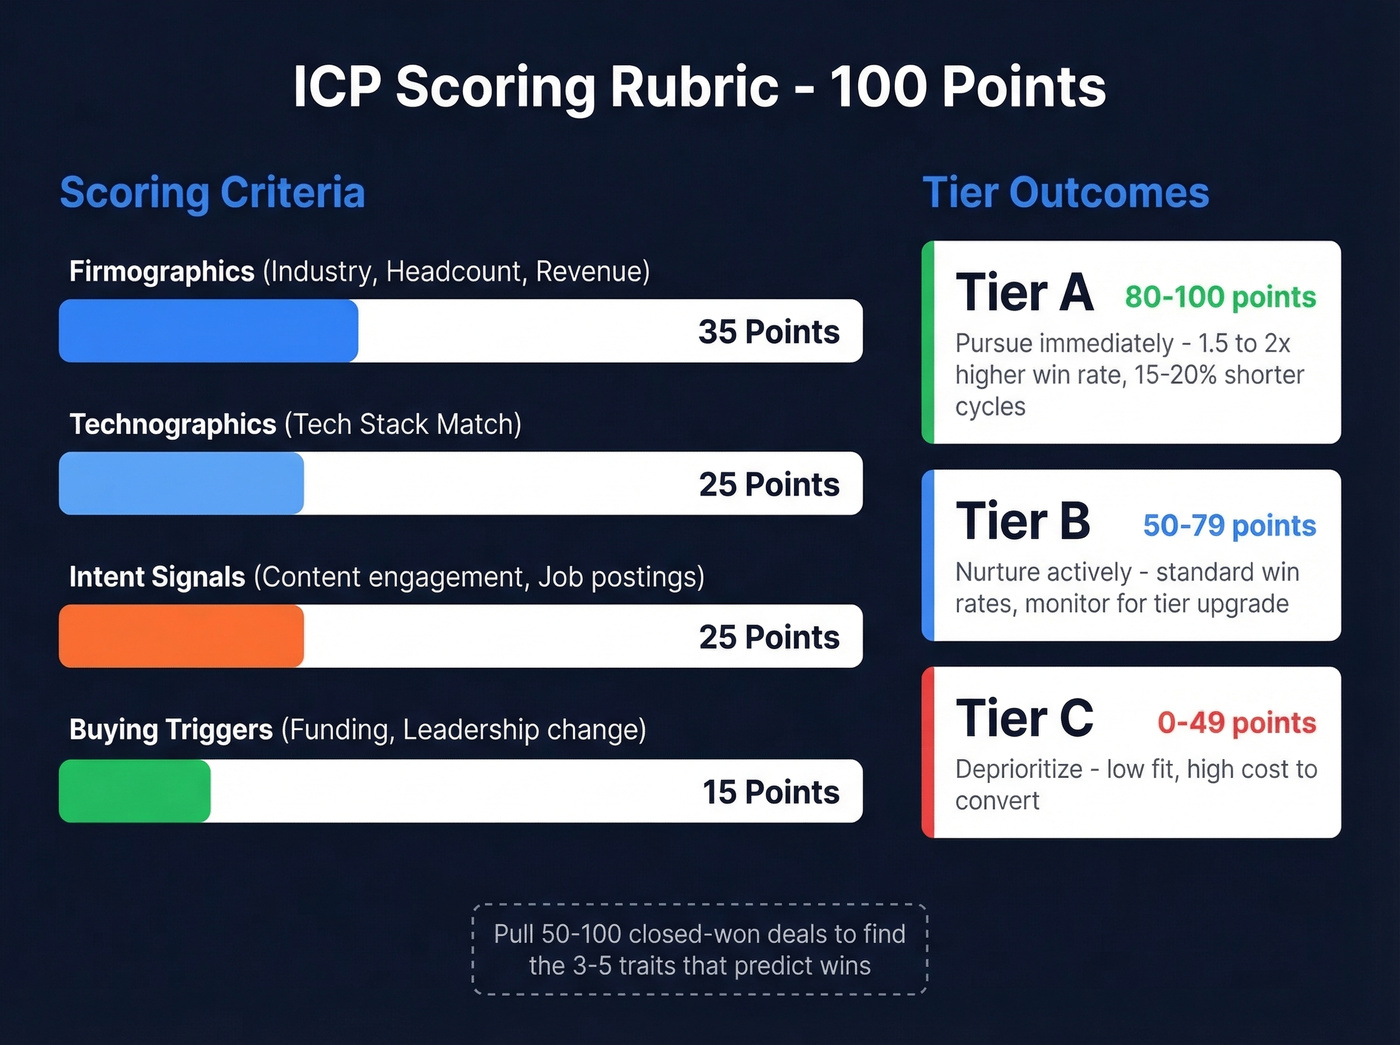
| Tier | Score | Action |
|---|---|---|
| A | 80-100 | Pursue immediately |
| B | 50-79 | Nurture, don't ignore |
| C | 0-49 | Deprioritize |
Weight firmographics, technographics, and intent signals based on what actually predicted past wins. Tier A win rates should run 1.5-2x higher than Tier B, with 15-20% shorter sales cycles. If they don't, your scoring criteria are wrong - go back to the data. We've rebuilt ICP rubrics three times at one company before the tiers started predicting outcomes reliably, and that kind of iteration is the real work that separates a framework from a slide deck.
Stage 2 - Lock Your Positioning
Your positioning has to work across a buying committee, not just one persona. Most B2B deals involve at least five roles: the champion, the economic buyer, the technical evaluator, the end user, and the blocker. Each needs a different angle on the same core message.
If you're tightening messaging, a practical next step is a B2B brand positioning pass before you scale spend.
McKinsey's "rule of thirds" applies here: at any stage of the journey, roughly a third of buyers prefer in-person, a third prefer remote, and a third prefer digital self-serve. Your messaging needs to hold up across all three modes. If your website says one thing and your AE says another, you've already lost the deal before the demo.
Stage 3 - Pick 1-3 Channels
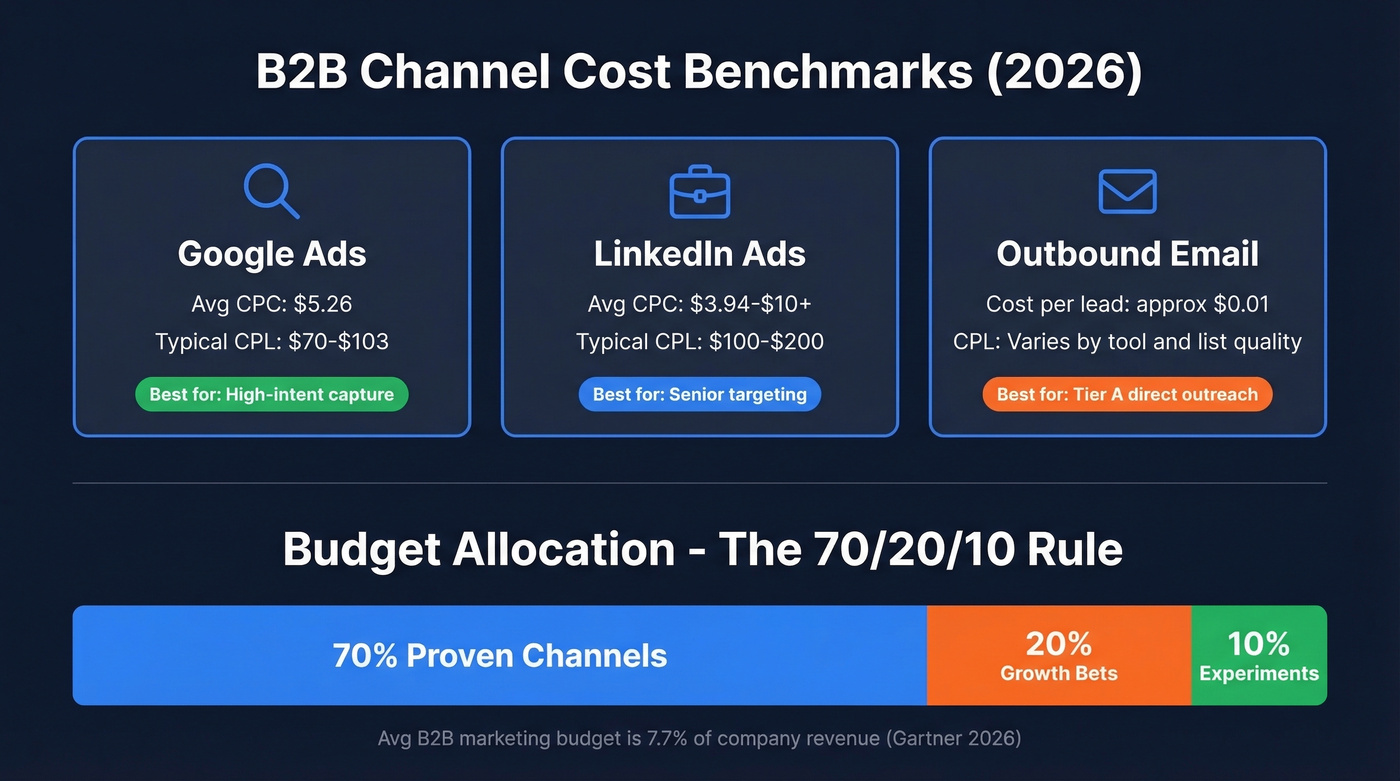
69% of B2B marketers expect budgets to increase in 2026, but the most recent Gartner CMO Spend Survey pegs the average at just 7.7% of company revenue. That's not a lot of room for experimentation.
So concentrate. Don't spread across six channels hoping something sticks.
| Channel | Avg CPC | Typical CPL | Best For |
|---|---|---|---|
| Google Ads | $5.26 | $70-$103 | High-intent capture |
| LinkedIn Ads | $3.94-$10+ | $100-$200 | Senior targeting |
| Outbound email | ~$0.01/lead | Varies by tool | Tier A direct outreach |
Use the 70/20/10 allocation heuristic: 70% on proven channels, 20% on growth bets, 10% on experiments. If you can't name your top two channels by conversion rate right now, you're spreading too thin. Skip the channel you added "because everyone else does it" and double down on what's actually converting.
If outbound is one of your 1-3 channels, build it like a system (not a blast) using proven sales prospecting techniques.
Stage 4 - Build on Clean Data
The average B2B SaaS website converts at 1.1%. Outbound is doing the heavy lifting for most teams - and outbound runs on contact data. If a third of your emails bounce, your framework is theoretical.
This is where data quality becomes a strategy problem, not just an ops problem. Upload your Tier A account list to a verified data platform like Prospeo, filter by job title and buyer intent across 30+ filters, and export verified contacts with 98% email accuracy on a 7-day refresh cycle. The free tier gives you 75 emails per month - enough to validate your ICP scoring on real prospects before scaling spend. For context, teams like Snyk cut bounce rates from 35-40% to under 5% and generated 200+ new opportunities per month after switching to verified data. That's the difference between a framework on paper and pipeline in your CRM.
If you're evaluating vendors, start with a shortlist of data enrichment services and compare refresh cycles and verification methods.

Stage 5 - Align Sales & Marketing
The old MQL handoff is broken.
Forrester's B2B Revenue Waterfall replaced the traditional demand waterfall by focusing on buying groups instead of individual leads - because that's how B2B actually works. Siemens adopted this model and pushed their opportunity acceptance rate to 85%. The key wasn't technology; it was shared definitions. Marketing and sales need to agree on what qualifies as a sales-accepted opportunity before anyone builds a dashboard. Without that alignment, even the best strategic plan falls apart the moment a lead crosses the handoff line, and you end up with marketing celebrating MQL volume while sales complains about lead quality in the same Slack channel.
To operationalize the handoff, define lead status stages that both teams actually use.
Stage 6 - Measure Pipeline
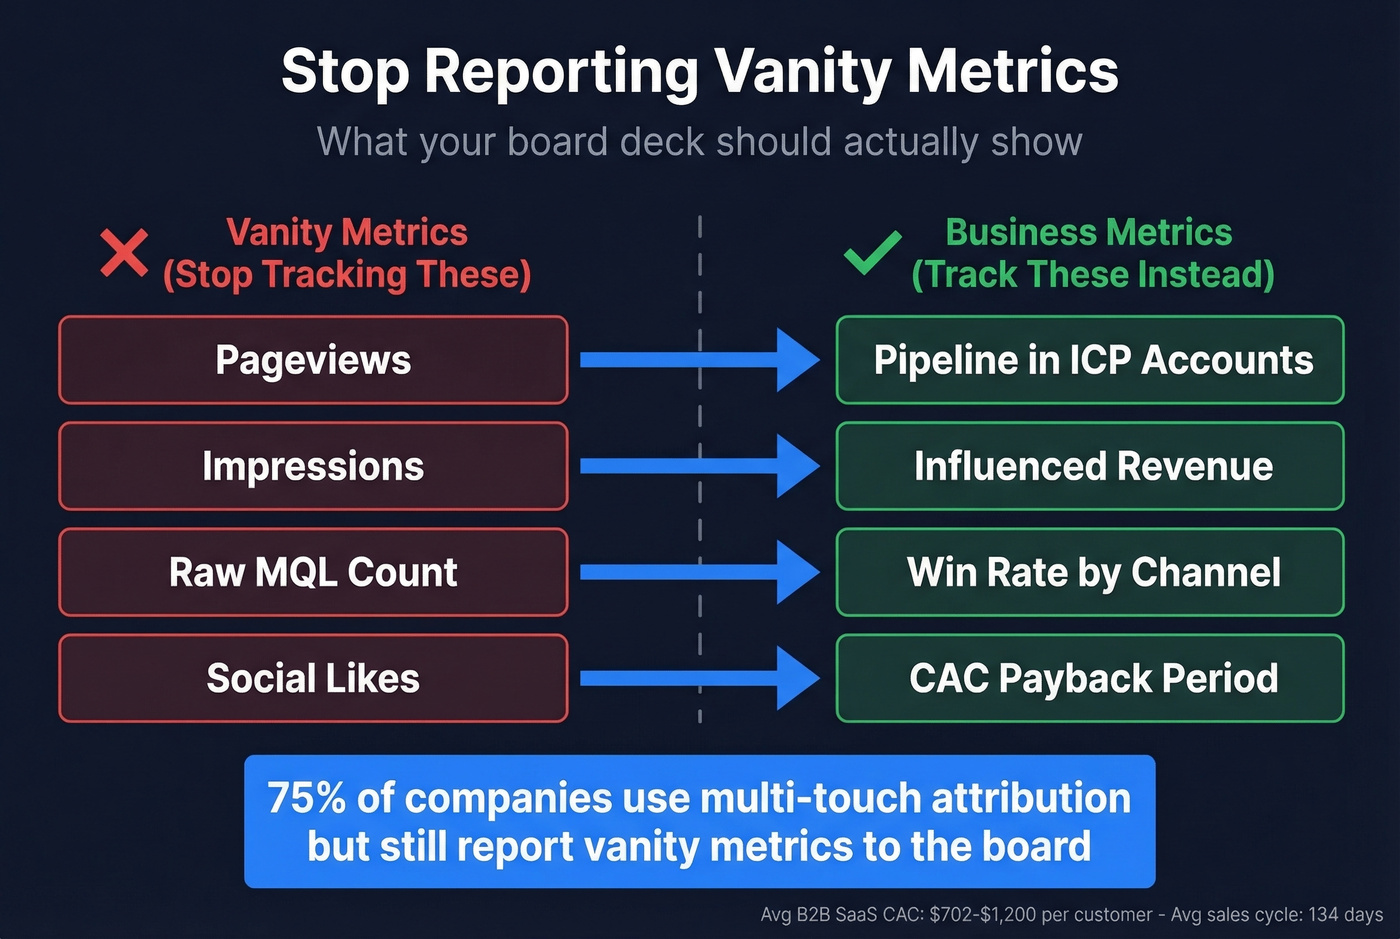
Let's be honest: 75% of companies now use multi-touch attribution, but most still report on vanity metrics in their board decks. The U-shaped model is the most practical starting point - 40% credit to first touch, 40% to the conversion touch, 20% split across the middle. Teams using multi-touch see ROI improvements up to 30% from smarter budget reallocation.
Average B2B SaaS CAC runs $702-$1,200 per customer, and the average sales cycle has stretched to 134 days, up from 107 in early 2022. If you can't connect marketing spend to pipeline velocity and CAC, you're flying blind with increasingly expensive fuel.
If you want a clean set of KPIs, track pipeline health metrics alongside CAC and cycle length.
Mistakes That Kill B2B Strategy
If your average deal size is under five figures, you probably don't need a complex martech stack. You need a tighter ICP and one outbound channel that works. Most strategy failures come from the same five mistakes:
Starting with tactics. "Let's run LinkedIn ads" isn't a strategy. It's a line item. Start with ICP scoring.
Vague ICP definitions. "Mid-market SaaS companies" isn't an ICP. It's a category. Score accounts or you're guessing.
Chasing vanity metrics. Pageviews feel good in a slide deck but don't predict revenue. See the table below.
Siloed teams. When marketing optimizes for MQLs and sales optimizes for close rate, nobody optimizes for revenue. I've watched this play out at three different companies, and it always ends the same way - finger-pointing in a quarterly review while pipeline stalls.
Wasting martech budget. 59% of CMOs say they don't have enough budget, yet martech spending runs 22-31% of marketing budgets with an estimated 60% going to underutilized tools. Audit before you add.
| Vanity Metric | Business Metric |
|---|---|
| Pageviews | Pipeline in ICP accounts |
| Impressions | Influenced revenue |
| Raw MQL count | Win rate by channel |
| Social likes | CAC payback period |
A six-stage framework means nothing if Stage 4 breaks. Snyk's 50 AEs cut bounce rates from 35% to under 5% and generated 200+ opportunities per month on Prospeo data. At $0.01 per verified email, clean data costs less than one wasted LinkedIn ad click.
Stop funding a strategy built on bad data. Start with 75 free verified emails.
FAQ
What's the difference between a B2B marketing strategy and a marketing plan?
A strategy is the framework of decisions about who to target, how to position, and what to measure. A plan is the tactical calendar that executes the strategy. Most teams skip straight to the plan - that's why they end up with random acts of marketing that don't compound.
How much should a B2B company spend on marketing?
The 2026 Gartner CMO Spend Survey puts the average at 7.7% of company revenue. Allocate using the 70/20/10 split: 70% to proven channels, 20% to growth bets, 10% to experiments. Review quarterly based on pipeline contribution, not lead volume.
How do I build a B2B marketing strategy framework from scratch?
Start with ICP scoring - pull your closed-won data, identify shared traits, and build a tiered rubric. Then lock positioning for the buying committee, select 1-3 channels, and source verified contact data. The six stages in this guide give you a repeatable process whether you're a two-person team or a 50-person department.
How do I get accurate contact data for my ICP accounts?
Use a verified B2B data platform with 98%+ email accuracy and a short refresh cycle. A 7-day refresh with 5-step verification - including catch-all handling and spam-trap removal - keeps bounce rates under 5% for outbound teams. Start with a free tier to test against your Tier A accounts before committing budget.