B2B Sales Funnel Stages: The 2026 Guide With Real Benchmarks
It's Monday morning. Your VP pulls up the dashboard and asks why 200 MQLs last month turned into 12 SQLs. You don't have a good answer - because nobody's actually measuring the stages between "lead came in" and "deal closed." 67% of B2B buyers now prefer a rep-free experience, which means the funnel your team built in 2022 is structurally wrong for how people buy today.
That gap between MQLs and SQLs? It's not a mystery. It's a measurement problem - and it's fixable once you know where to look.
The Quick Version
Six stages matter: Awareness, Interest, Evaluation, Intent, Purchase, and Retention. The benchmark that exposes most problems is MQL-to-SQL conversion - across industries it averages around 15%, meaning 85% of your "qualified" leads never reach a real sales conversation. The formula tying everything together is pipeline velocity: (Opportunities x Deal Value x Win Rate) / Cycle Length. If you only read one section, jump to the benchmarks table below.
Funnel vs. Pipeline
These terms get used interchangeably, and that causes real confusion. A funnel measures buyer conversion - how prospects move through stages and where they drop off. A pipeline tracks seller deal progression - the active opportunities your reps are working right now.
You need both, and they need to talk to each other. Teams that align funnel metrics with pipeline stages see 38% higher win rates and 36% higher retention.
| Funnel Stage | Pipeline Stage |
|---|---|
| Awareness | Prospecting |
| Interest | Qualification |
| Evaluation | Needs Analysis |
| Intent | Proposal |
| Purchase | Closed Won |
| Retention | Expansion |
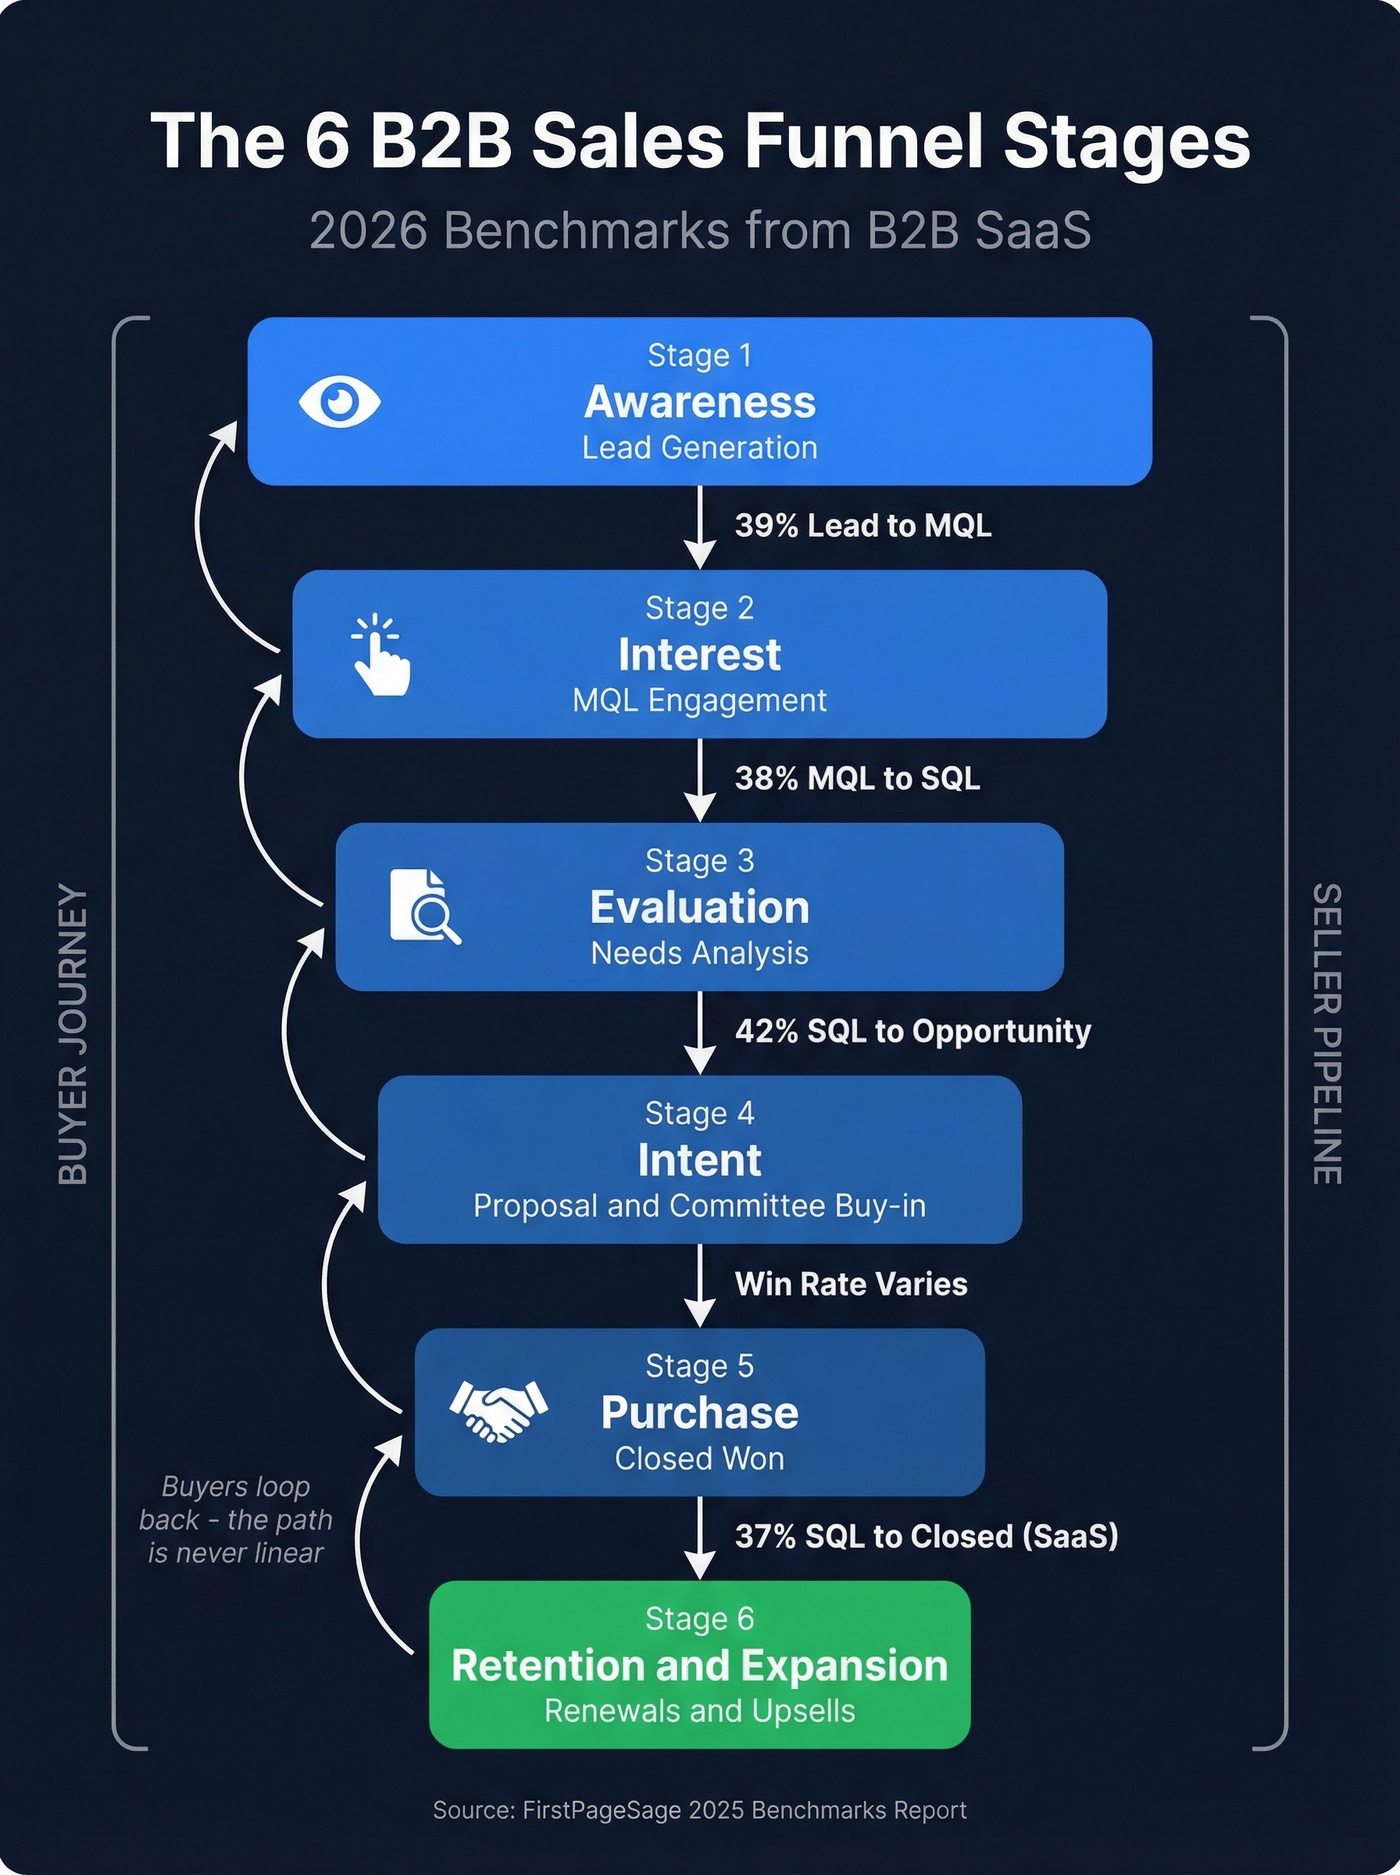
The 6 B2B Funnel Stages
Stop adding stages. Start measuring the ones you have. And let's be honest - buyers don't move through these in a straight line. They loop back, skip ahead, and revisit earlier stages constantly. These stages still matter because they give you measurement points, even when the path is messy.
Awareness
This is where your funnel either starts clean or starts poisoned. 73% of B2B buyers actively avoid suppliers who send irrelevant outreach - and "irrelevant" includes emails that bounce, hit the wrong person, or reach someone who left the company six months ago.
Here's what that looks like in practice: you send 5,000 cold emails. Hundreds bounce. Thousands go to people who've changed jobs. That's not a messaging problem - it's a data problem. Tools like Prospeo catch this at the source with 98% email accuracy and a 7-day refresh cycle, before bad data poisons everything downstream.
In B2B SaaS, Lead-to-MQL conversion benchmarks around 39%, but that number means nothing if your list is half-dead contacts. (If you want a deeper KPI set, see funnel metrics.)

Interest
The prospect knows you exist and has engaged - downloaded a whitepaper, attended a webinar, replied to an email. Conversion here depends on speed. Leads contacted within five minutes convert at 100x the rate of those contacted an hour later.
Most teams don't respond for 24-48 hours. That's not a process gap. That's revenue left on the floor.
The benchmark to watch: MQL-to-SQL conversion. B2B SaaS benchmarks around 38% according to FirstPageSage, while the broader cross-industry average sits closer to 15%. If yours is below that, your qualification criteria are either too loose or too tight. (Need sequences that actually move leads? Use these sales follow-up templates.)
Evaluation
Buyers compare you against two or three alternatives here. For deals under $25K with shorter cycles, BANT (Budget, Authority, Need, Timeline) works - it's fast and filters efficiently. The key metric is SQL-to-Opportunity, which runs 42% in B2B SaaS and as high as 49% in financial services.
Where this stage breaks: 69% of buyers report inconsistencies between what your website says and what your sellers say. That misalignment between marketing content and sales conversations kills deals here more than pricing does. (If your scoring is fuzzy, tighten it with a real lead scoring model.)
Intent
Enterprise deals get complicated at this stage. You're dealing with 6-12 stakeholders in a buying committee, each with different priorities. This is where MEDDIC (Metrics, Economic Buyer, Decision Criteria, Decision Process, Identify Pain, Champion) earns its keep.
BANT filters for velocity. MEDDIC maps for precision. If your average deal involves more than five decision-makers, MEDDIC isn't optional - it's survival. Arm your internal champion with comparison content and ROI proof they can circulate without you in the room. Between 40-60% of qualified deals die to "no decision", and that usually means you didn't map the buying committee well enough. (For enterprise motion specifics, see enterprise B2B sales.)
Purchase
The deal is won on paper, but this stage has its own failure modes - procurement delays, legal redlines, last-minute budget freezes. SQL-to-Closed Won rates vary wildly: 37% in B2B SaaS, 53% in financial services, 60% in eCommerce.
The biggest mistake we see: treating this as a formality. Deals that stall in contracting die quietly. Set clear next steps with specific dates, and don't let more than 48 hours pass without contact during final negotiation. (If you’re standardizing close steps, use a product demo checklist to reduce late-stage drift.)
Retention & Expansion
Most funnel diagrams stop at "Closed Won." That's a mistake.
Retention has its own conversion rate (renewal rate), its own leakage points (poor onboarding, missing QBRs), and its own revenue math. The tactic that matters most: structured onboarding with clear milestones in the first 90 days. Skip this, and you'll spend more acquiring replacement revenue than you would have spent keeping the customer. (Track it cleanly with a consistent renewal rate definition.)
85% of MQLs never become SQLs - and bad contact data is the #1 reason top-of-funnel leads die before sales ever touches them. Prospeo's 98% email accuracy and 7-day refresh cycle means your reps reach real buyers, not dead inboxes. GreyScout cut bounce rates from 38% to under 4% and grew pipeline 140%.
Stop feeding stale data into a funnel you spent months building.
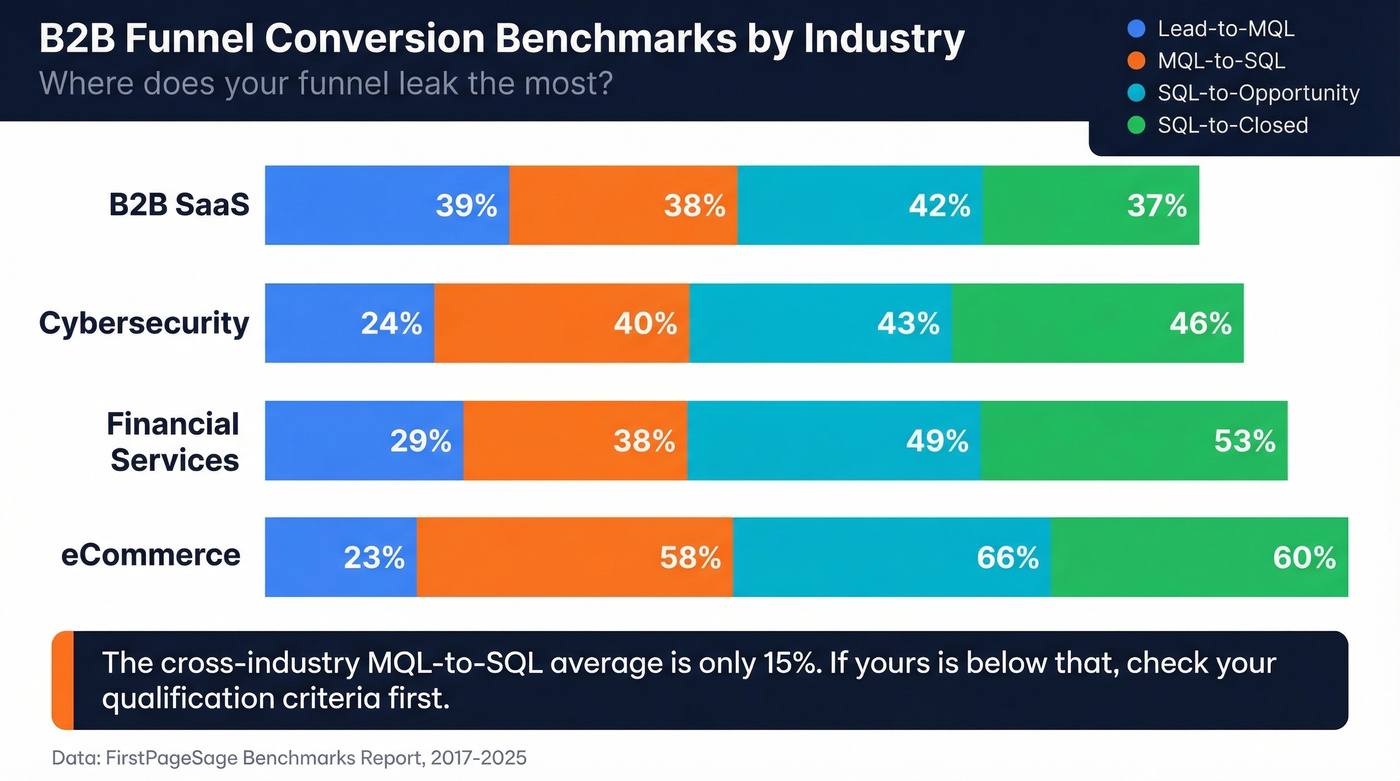
Benchmarks by Industry
These numbers come from FirstPageSage's benchmarks report covering data from 2017-2025 across a client base that's roughly 65% B2B.
| Industry | Lead-to-MQL | MQL-to-SQL | SQL-to-Opp | SQL-to-Closed |
|---|---|---|---|---|
| B2B SaaS | 39% | 38% | 42% | 37% |
| Cybersecurity | 24% | 40% | 43% | 46% |
| Financial Services | 29% | 38% | 49% | 53% |
| eCommerce | 23% | 58% | 66% | 60% |
The MQL-to-SQL column is where most B2B funnels hemorrhage. The cross-industry average is around 15%, which means even B2B SaaS at 38% is an outlier. If your rate is below 15%, the problem is almost always qualification criteria - either marketing is passing leads that aren't ready, or sales is cherry-picking and ignoring the rest. Up to 55% of leads get neglected entirely due to poor qualification processes. (To compare your numbers, use these sales conversion rate benchmarks.)
Where B2B Funnels Leak
Traffic up, revenue flat? Your funnel has a leak.
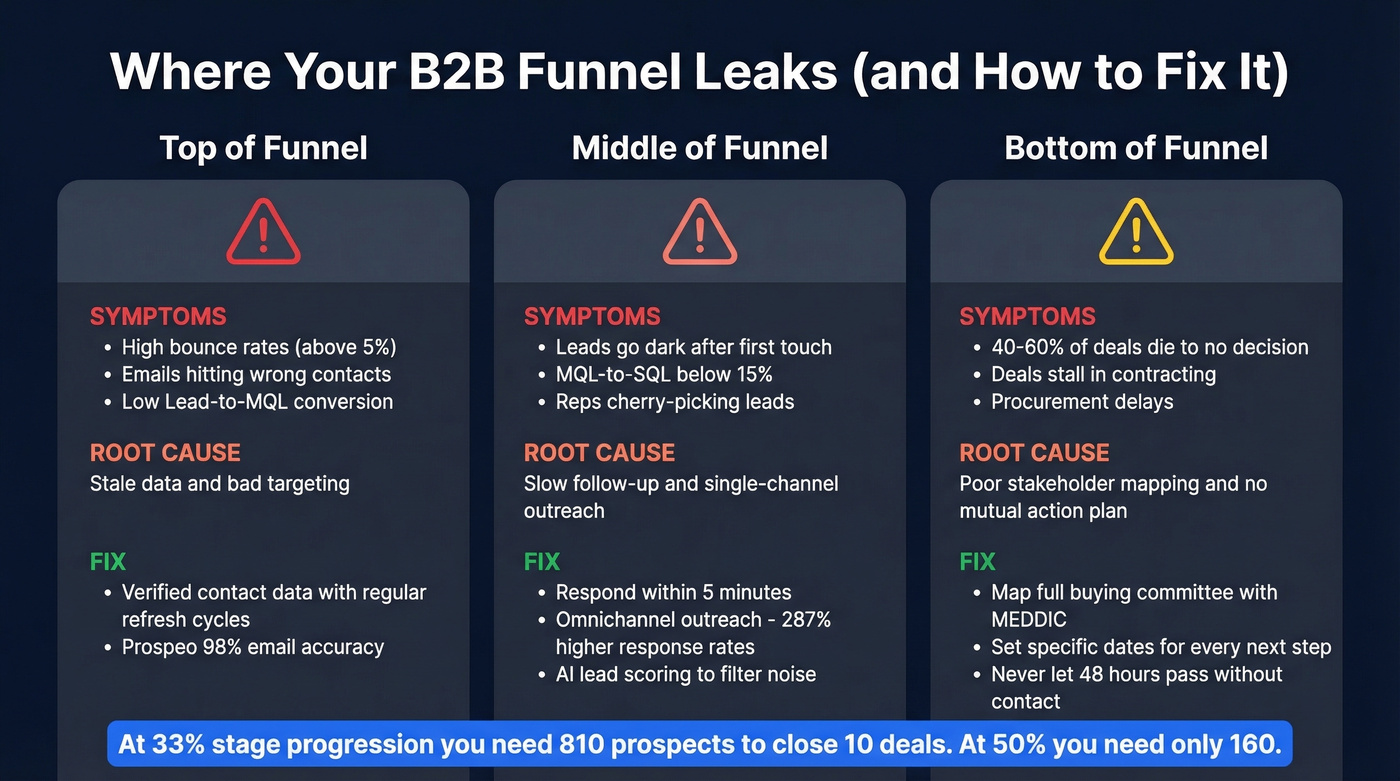
Top of funnel (Awareness/Interest): Bad targeting, stale data, irrelevant outreach. If your bounce rate is above 5%, you have a data problem before you have a conversion problem. When GreyScout switched to verified contact data, bounce rates dropped from 38% to under 4% and pipeline jumped 140%. (If you’re diagnosing deliverability, start with email bounce rate.)
Middle of funnel (Evaluation/Intent): Leads go dark because follow-up is slow or generic. Omnichannel outreach yields 287% higher response rates than single-channel. If your SDRs are email-only, you're leaving pipeline on the table. (Build a repeatable motion with sales prospecting techniques.)
Bottom of funnel (Purchase/Retention): Deals stall in "no decision" limbo. The fix is almost always better stakeholder mapping and a clearer mutual action plan.
Here's the math that makes leakage brutal: at 33% stage-to-stage progression, you need 810 prospects entering the funnel to close 10 deals. At 50% progression, you need 160. The difference between a skinny funnel and a healthy one isn't more leads - it's less leakage.
Pipeline Velocity Formula
This is the one formula every RevOps team should have on their dashboard:
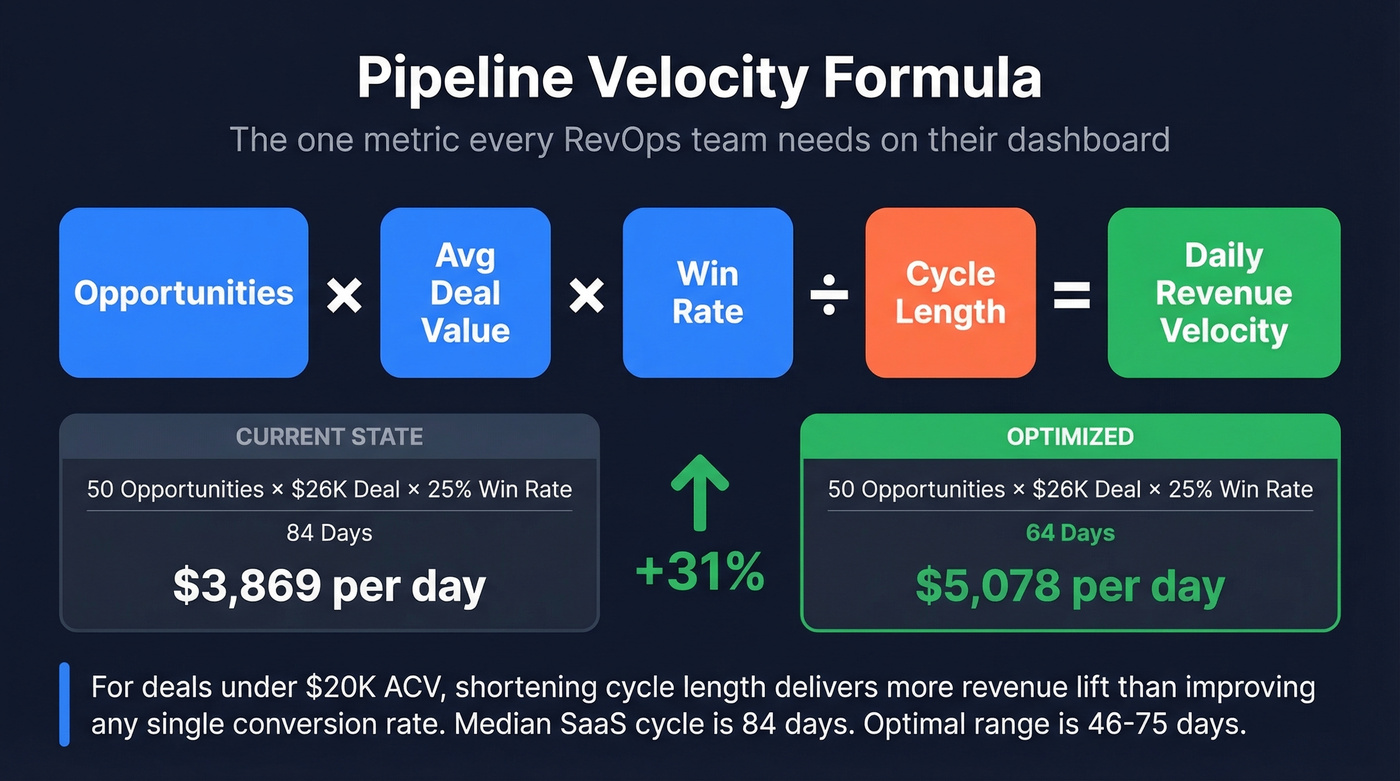
(Opportunities x Average Deal Value x Win Rate) / Sales Cycle Length = Daily Revenue Velocity
Plug in median SaaS benchmarks: 50 opportunities, 25% win rate, $26K average deal, 84-day cycle. That gives you $3,869 in daily pipeline velocity. Shorten the cycle to 64 days - everything else stays the same - and you're at $5,078/day. A 31% increase from changing one variable.
The median SaaS sales cycle runs 84 days. The optimal range is 46-75 days. We've seen teams shave 20+ days off their cycle just by implementing mutual action plans with specific dates for every remaining step. (If you want a broader diagnostic, use these pipeline health metrics.)
Here's the thing: if your average deal is under $20K ACV, obsessing over granular funnel-stage optimization is the wrong move. Just shorten your cycle length. Pipeline velocity math shows that reducing cycle time delivers more revenue lift than improving any single conversion rate.
AI and the Funnel in 2026
45% of B2B buyers used AI during their most recent purchase. AI-agent automated customer interactions are projected to jump from 3.3 billion in 2025 to 34 billion+ by 2027. On the seller side, 85% of GTM teams using AI report productivity improvements, and AI-powered lead scoring drives 20% higher conversion rates.
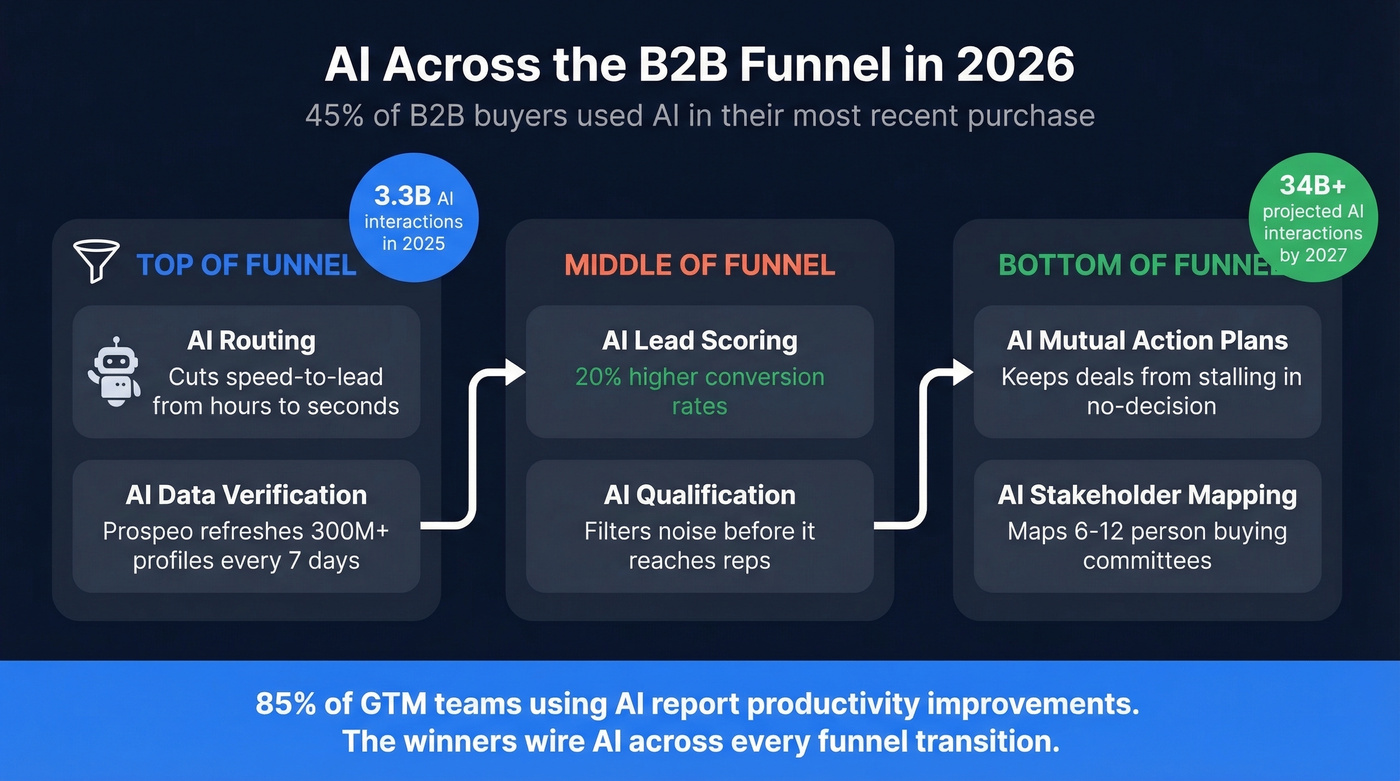
The practical applications by stage: AI routing at the top of funnel cuts speed-to-lead from hours to seconds. AI scoring in the middle improves MQL-to-SQL by filtering noise before it reaches reps. AI-generated mutual action plans at the bottom keep deals from stalling. The teams winning right now aren't using AI for one stage - they're wiring it across every funnel transition to compound gains. (For what’s changing fastest, see lead generation trends.)
Pipeline velocity = (Opportunities × Deal Value × Win Rate) / Cycle Length. Every variable improves when reps connect with the right person on the first attempt. Prospeo gives you 300M+ profiles with 30+ filters - buyer intent, job changes, technographics - so your funnel starts with qualified contacts, not guesswork.
Increase pipeline velocity by fixing the data that feeds every stage.
FAQ
How many stages should a B2B sales funnel have?
Six: Awareness, Interest, Evaluation, Intent, Purchase, and Retention. These cover every measurable conversion point from first touch to expansion revenue. Add micro-stages only after you can reliably measure and optimize the core six.
What's a good MQL-to-SQL conversion rate?
The cross-industry average is 15%; B2B SaaS benchmarks around 38%. Below 15% signals broken qualification criteria - either marketing is passing unready leads or sales is ignoring them. Audit your scoring model before adding more top-of-funnel volume.
What's the difference between a funnel and a pipeline?
A funnel measures buyer conversion rates across stages; a pipeline tracks active seller deal progression. Companies that align both see 38% higher win rates. Map each funnel stage to a corresponding pipeline stage so marketing and sales share the same language.
How does bad contact data affect the funnel?
Bounced emails damage sender reputation, waste SDR hours, and inflate every cost-per-stage metric. Keeping bounce rates under 4% through verified data and regular refresh cycles is the baseline - anything above 5% means your data source is the bottleneck, not your messaging.
Should I use BANT or MEDDIC?
Use BANT for deals under $25K with fewer than four stakeholders - it filters fast. Switch to MEDDIC for enterprise deals with six-plus decision-makers where mapping the buying committee determines whether you win or lose to "no decision."